A Dissertation on
INFLUENCE OF LEFT VENTRICULAR SYSTOLIC DYSFUCTION ON THE SURFACE
ELECTROCARDIOGRAM – A CASE CONTROL STUDY
Submitted to
THE TAMIL NADU DR. M.G.R. MEDICAL UNIVERSITY
CHENNAI – 600 032.
In fulfillment of the Regulations For the Award of the Degree of
M.D. GENERAL MEDICINE
BRANCH - I, PART - II
DEPARTMENT OF GENERAL MEDICINE
KILPAUK MEDICAL COLLEGE CHENNAI – 600 010.
CERTIFICATE
This is to certify that Dr. S.J. AJEET ARULKUMAR, Post -Graduate Student (July. 2003 to September 2006) in the Department of Medicine, Kilpauk Medical College, Chennai- 600 010, has done this
dissertation on “INFLUENCE OF LEFT VENTRICULAR
SYSTOLIC DYSFUCTION ON THE SURFACE
ELECTROCARDIOGRAM – A CASE CONTROL STUDY” under
my guidance and supervision in fulfillment of the regulations laid down by the Tamilnadu Dr.M.G.R. Medical University, Chennai, for M.D. (General Medicine), Degree Examination to be held in September 2006.
Dr. THIYAGAVALLI KIRUBAKARAN M.D., The Dean
Kilpauk Medical College Chennai 600 010.
Date :
Station : Chennai.
Prof. K.S. SAIKUMAR,M.D.,
Professor & HOD
Department of Internal Medicine Kilpauk Medical College Hospital Chennai.
Prof .D.S.SOMASEKAR, M.D,
Professor of Medicine
Department of Internal Medicine Govt. Royapettah Hospital
ACKNOWLEDGMENT
I thank God Almighty without whom none of this would be
possible.
I would like to express my sincere gratitude to the Dean,
Dr.THIAGAVALLI KIRUBAKARAN,
M.D, Kilpauk MedicalCollege for allowing me to use the materials available in this hospital for
the study.
I wish to extend my grateful thanks to the professor of medicine
Prof. K.S. SAIKUMAR,
M.D, for giving me an opportunity to conduct this study.I am very grateful to my Chief
Prof. D.S.SOMASEKAR,
M.D, for his inspiring suggestions and encouragement at every stage of
this study.
I feel deeply indebted to the Prof and Head of the Department of
Cardiology
Prof. B. RAMAMOORTHY
, M.D, D.M, for hisvaluable guidance and encouragement in the course of study.
I would like to utilize the occasion to thank my Asst.
Professor
Dr.MAYILVAHANAN,
M.D,Dr.ROHINI
, andDr.VASANTHI,
M.D, for their co-operation in accomplishment of this work.Last but not the least I extend my heartfelt thanks to my wife,
parents, and fellow post graduate students for their untiring support and
CONTENTS
S. No. Title Page No.
1. Introduction 1
2. Aim of the Study 4
3. Review of Literature 5
4. Materials and Methods 34
5. Computation of data 38
6. Discussion 48
7. Limitation 50
8. Conclusion 51
9. Study Proforma
10. Master Chart
Introduction
Heart failure is a significant public health concern
worldwide. Heart failure affects an estimated 1 percent of adults 50 to 60
years of age and 10 percent of adults in their 80s. This clinical syndrome
is the most frequent cause of hospitalization in patients older than 65
years. Half of all patients with a diagnosis of heart failure will die within
4 years, and in patients with severe heart failure, more than half will die
in one year. 1, 2
The prevalence of heart failure is higher in our country than
in developed countries. This is because coronary artery disease in Indians
occurs at a younger age, is more severe and extensive and follows a
malignant course. 3. By the year 2020, the burden of cardiovascular
disease in India will surpass that in other regions of the world4. The
higher prevalence is directly related to the higher incidence and
prevalence of hypertension and diabetes. This problem is particularly
exacerbated by a lack of access to health care and to substandard
preventive health care in India.
While modern methods of diagnosing heart failure such as
the echocardiogram, perfusion scan, Radionuclide angiography, Left
ventricular angiography, Magnetic resonance imaging (MRI) and ultra
majority of our population must be content with the treatment and
investigations available in the primary health center. Often the only
investigations available here to evaluate a patient with suspected cardiac
disorder are an electrocardiogram and a chest x ray. Therefore the treating
physician has to make a decision regarding the presence of left
ventricular dysfunction based on his clinical assessment and with the help
of electrocardiogram and Chest X-ray. Diagnosis of heart failure is
definitely possible with the help of a thorough clinical examination and
simple tools such as electrocardiogram and chest X-Ray.
Numerous studies have shown that left ventricular systolic
dysfunction is very unlikely in a patient with a normal electrocardiogram.
This means that left ventricular systolic dysfunction screening could be
concentrated towards patients with abnormal electrocardiograms. Hence,
especially in a developing country like ours it would be a cost effective
approach to use the electrocardiogram as the initial investigation. In a
study done by AP Davie et al if screening is restricted to those with major
ECG abnormalities, the incidence of left ventricular systolic dysfunction
increased from 18% to 37%.5. If the tracing is normal other diagnoses
should be considered. Only if these have been excluded should an
echocardiogram be performed.
Patients with congestive heart failure have a poor prognosis
and 30% in the second year. Even among patients with ischemic heart
disease, the single most important prognostic factor is the degree of LV
dysfunction. Although significant progress has been made in the
treatment of heart failure, patients continue to have a poor quality of life
and an unacceptably high mortality.
The question often arises in our mind – if most patients with
significant LV dysfunction have electrocardiographic abnormalities then,
are there any specific electrocardiographic abnormalities specific for
Aims of the Study
1. To study specific ECG changes in patients with and left ventricular
systolic dysfunction.
2. To determine if there is an association between decreasing Ejection
fraction and the electrocardiogram.
3. To quantify the association between certain electrocardiographic
Review of the literature.
Heart failure is primarily a disease of the elderly.6 It is
responsible for 5 to 10 percent of all hospital admissions. Approximately
6% to 10% of people older than 65 years have heart failure.7 Around 80%
of patients hospitalized with heart failure are more than 65 years old.8
Heart failure causes or contributes to approximately 250,000 deaths every
year. Although significant progress has been made in the treatment of
heart failure, patients continue to have a poor quality of life and an
unacceptably high mortality.
Definition
By definition Heart failure is the pathophysiologic state in
which the heart, via an abnormality of cardiac function (detectable or
not), fails to pump blood at a rate commensurate with the requirements of
the metabolizing tissues and/or pumps only from an abnormally elevated
diastolic filling pressure.9
Pathophysiology
Heart failure may be caused by myocardial failure but may
also occur in the presence of near-normal cardiac function under
conditions of high demand. Heart failure always causes circulatory
failure, but the converse is not necessarily the case because various
produce circulatory failure in the presence of normal, modestly impaired,
or even supranormal cardiac function.
Inadequate adaptation of the cardiac myocytes to increased
wall stress in order to maintain adequate cardiac output following
myocardial injury (whether of acute onset or over several months to
years, whether a primary disturbance in myocardial contractility or an
excessive hemodynamic burden placed on the ventricle, or both), is the
inciting event in CHF.
Most important among these adaptations are the (1)
Frank-Starling mechanism, in which an increased preload helps to sustain
cardiac performance; (2) myocardial hypertrophy with or without cardiac
chamber dilatation, in which the mass of contractile tissue is augmented;
and (3) activation of neurohumoral systems, especially the release of
norepinephrine (NE) by adrenergic cardiac nerves, which augments
myocardial contractility and the activation of the
renin-angiotensin-aldosterone system (RAAS) and other neurohumoral adjustments that act
to maintain arterial pressure and perfusion of vital organs.
The primary myocardial response to chronic increased wall
stress includes myocyte hypertrophy and remodeling, usually of the
eccentric type. The reduction of cardiac output following myocardial
injury sets into motion a cascade of hemodynamic and neurohormonal
notably the above-mentioned adrenergic systems and
renin-angiotensin-aldosterone system. The release of epinephrine (E) and NE, along with
the vasoactive substances endothelin-1 (ET-1) and vasopressin (V),
causes vasoconstriction, which increases afterload, and, via an increase in
cyclic adenosine monophosphate (cAMP), causes an increase in cytosolic
calcium entry. The increased calcium entry into the myocytes augments
myocardial contractility and impairs myocardial relaxation (lusitropy).
The calcium overload may also induce arrhythmias and lead
to sudden death. The increase in afterload and myocardial contractility
(known as inotropy) and the impairment in myocardial lusitropy lead to
an increase in myocardial energy expenditure and a further decrease in
cardiac output. The increase in myocardial energy expenditure leads to
myocardial cell death, resulting in heart failure and further reduction in
cardiac output, thus starting an accelerating cycle of further increased
neurohumoral stimulation and further adverse hemodynamic and
myocardial responses as described above.
The activation of the renin-angiotensin-aldosterone system
leads to salt and water retention, resulting in increased preload and further
increases in myocardial energy expenditure. Increases in renin, mediated
by decreased stretch of the glomerular afferent arteriole, reduced delivery
of chloride to the macula densa, and increased beta1-adrenergic activity
angiotensin II levels and, in turn, aldosterone levels. This results in
stimulation of release of aldosterone. Angiotensin II, along with ET-1, is
crucial in maintaining effective intravascular homeostasis mediated by
vasoconstriction and aldosterone-induced salt and water retention.
As heart failure advances and/or becomes progressively
decompensated, there is a relative decline in the counter regulatory
effects of endogenous vasodilators, including nitric oxide (NO),
prostaglandins (PGs), bradykinin (BK), atrial natriuretic peptide (ANP),
and B-type natriuretic peptide (BNP). This occurs simultaneously with
the increase in vasoconstrictor substances from the
renin-angiotensin-aldosterone system and adrenergic systems. This fosters further increases
in vasoconstriction and thus preload and afterload, leading to cellular
proliferation, adverse myocardial remodeling, and antinatriuresis with
total body fluid excess and worsening CHF symptoms.
Natriuretic peptides
ANP and BNP are endogenously generated peptides
activated in response to atrial and ventricular volume/pressure expansion.
ANP and BNP are released from the atria and ventricles, respectively,
and both promote vasodilation and natriuresis. Their hemodynamic
to reductions in cardiac preload and afterload. BNP, in particular,
produces selective afferent arteriolar vasodilation and inhibits sodium
reabsorption in the proximal convoluted tubule. BNP inhibits renin and
aldosterone release and, possibly, adrenergic activation as well.
Both ANP and BNP are elevated in chronic heart failure.
BNP, in particular, has potentially important diagnostic, therapeutic, and
prognostic implications. A large study has confirmed that BNP could help
differentiate cardiac from respiratory acute breathlessness in the
emergency room setting.10 In particular; the negative predictive accuracy
was 97%. The positive predictive value was also high at 70%.11,12
Systolic and diastolic heart failure
There are two types of heart failure – systolic and diastolic.
In systolic heart failure, there is reduced cardiac contractility (decreased
left ventricular systolic function with an ejection fraction less than 50%),
whereas in diastolic heart failure there is impaired cardiac relaxation and
abnormal ventricular filling (symptoms and signs of heart failure in the
presence of normal ejection fraction). Both systolic and diastolic heart
failure result in a decrease in stroke volume. This leads to activation of
peripheral and central baroreflexes and chemoreflexes that are capable of
eliciting marked increases in sympathetic nerve traffic.
In individuals with systolic dysfunction, the neurohormonal
systolic blood pressure and tissue perfusion. However, in all
circumstances, the existing data support the notion that these
neurohormonal responses accelerate the downward spiral of myocardial
dysfunction in the long term.
In diastolic heart failure, the same pathophysiologic
processes to decreased cardiac output that occur in systolic heart failure
also occur, but they do so in response to a different set of hemodynamic
and circulatory environmental factors that depress cardiac output.
Etiology of heart failure
There are several causes for heart failure. However in about
two thirds the cause of heart failure is coronary artery disease.13 The
etiology differs in doth systolic and diastolic heart failure but a significant
overlap occurs. The principal causes are mentioned below.
Dominant systolic heart failure
1. Ischemic myocardial disease, coronary artery disease
2. Alcoholic cardiomyopathy
3. Diabetic cardiomyopathy
4. Cocaine cardiomyopathy
5. Drug-induced cardiomyopathy (e.g., doxorubicin)
6. Idiopathic cardiomyopathy
7. Peripartum cardiomyopathy
9. Preterminal valvular heart disease
10. Congenital heart disease with severe pulmonary hypertension
Dominant diastolic heart failure
1. Hypertension
2. Severe aortic stenosis
3. Hypertrophic cardiomyopathy
4. Restrictive cardiomyopathy
5. Ischemic myocardial disease, coronary artery disease
6. Acute heart failure
7. Acute mitral or aortic regurgitation
8. Rupture of valve leaflets or supporting structures
9. Infective endocarditis with acute valve incompetence
10. Myocardial infarction
11. High-output heart failure
12. Anemia
13. Systemic arteriovenous fistulas
14. Hyperthyroidism
15. Beriberi heart disease
16. Paget disease of bone
In a study conducted by Chin MH et al out of 435
patients admitted with heart failure, precipitating factors could be
identified in 66%.14 A well compensated patient with heart failure may
become decompensated due to numerous precipitating factors and not
necessarily due to worsening heart failure. The most common of these
are inappropriate reduction in the intensity of treatment, be it dietary
sodium and fluid restriction or pharmacological therapy. Other
important precipitating factors include arrhythmias, systemic
infection, physical, emotional and environmental stress, pulmonary
disease and development of an unrelated illness.
Stages
The evolution of heart failure from an asymptomatic to a
symptomatic stage has recently been classified.15
ACC/AHA Classification of Chronic Heart Failure
Stage Description
A. High risk for developing heart failure. (Hypertension,
diabetes mellitus, CAD, family history of cardiomyopathy )
B. Asymptomatic heart failure. (Previous MI, LV dysfunction,
valvular heart disease )
C. Symptomatic heart failure. (Structural heart disease, dyspnea
D. Refractory end-stage heart failure. (Marked symptoms at rest
despite maximal medical therapy)
The clinical syndrome of heart failure manifests when
cellular respiration becomes impaired. The Framingham, Duke and
Boston criteria were established before noninvasive techniques for
assessing systolic and diastolic dysfunction became widely available. The
three sets of criteria were designed to assist in the diagnosis of heart
failure. The Boston criteria16 have been shown to have the highest
combined sensitivity (50 percent) and specificity (78 percent). All of
these criteria are most helpful in diagnosing advanced or severe heart
failure, a condition that occurs in 20 to 40 percent of patients with a
decreased ejection fraction.
Boston Criteria for Diagnosing Heart Failure
Category I: history Points
Rest dyspnea 4
Orthopnea 4
Paroxysmal nocturnal dyspnea 3
Dyspnea while walking on level area 2
Dyspnea while climbing 1
Category II: physical examination
Heart rate abnormality (1 point if 91 to 110 beats per
minute; 2 points if more than 110 beats per minute)
1 or 2
Jugular venous elevation (2 points if greater than 6 cm
H2O; 3 points if greater than 6 cm H2O plus
hepatomegaly or edema)
Lung crackles (1 point if basilar; 2 points if more than
basilar)
1 or 2
Wheezing 3
Third heart sound 3
Category III: chest radiography
Alveolar pulmonary edema 4
Interstitial pulmonary edema 3
Bilateral pleural effusion 3
Cardiothoracic ratio greater than 0.50 3
Upper zone flow redistribution 2
No more than 4 points are allowed from each of three
categories; hence the composite score (the sum of the subtotal from each
category) has a possible maximum of 12 points. The diagnosis of heart
failure is classified as "definite" at a score of 8 to 12 points, "possible" at
a score of 5 to 7 points, and "unlikely" at a score of 4 points or less.
Early diagnosis of heart failure is essential for successfully
addressing underlying diseases or causes and, in some patients,
preventing further myocardial dysfunction and clinical deterioration.
However, initial diagnosis may be difficult because the presentations of
heart failure can change from no symptoms to pulmonary edema with
cardiogenic shock. It is estimated that heart failure is correctly diagnosed
The first step in diagnosing heart failure is to obtain a
complete clinical history. The patient should be questioned about
dyspnea, cough, nocturia, generalized fatigue and other signs and
symptoms of heart failure. Peripheral edema, raised jugular venous
pressure and hepatomegaly are the characteristic feature of congestion of
systemic veins.18,19
Dyspnea, a cardinal symptom of a failing heart, often
progresses from dyspnea on exertion to orthopnea, paroxysmal nocturnal
dyspnea and dyspnea on rest. Cough, usually nocturnal and
nonproductive, may accompany dyspnea and often occurs in similar
settings (i.e., on exertion or when the patient is supine).
The NYHA functional classification scheme is used to assess
the severity of heart failure and correlates fairly well with prognosis.20
New York Heart Association Heart Failure Symptom Classification
System
I No symptom limitation with ordinary physical activity
II Ordinary physical activity somewhat limited by dyspnea (i.e., long
distance walking, climbing 2 flights of stairs)
III Exercise limited by dyspnea at mild work loads (ie, short distance
walking, climbing one flight of stairs)
Nocturia, also a frequent sign of heart failure, occurs
secondary to increased renal perfusion when the patient is supine.203
Generalized fatigue (caused by the low perfusion state) and peripheral
edema with inability to wear usual footwear are frequent complaints.
With severe, longstanding heart failure, cardiac cachexia
(emaciation resulting from heart disease) may develop secondary to
protein-losing enteropathy and increased levels of certain cytokines, such
as tumor necrosis factor. Cardiac cachexia may mimic the cachexia seen
in patients with disseminated malignant disease.
Confusion and altered mental status may occur because of
decreased cerebral perfusion or cardiac cirrhosis. In heart failure,
cirrhosis develops secondary to chronic passive congestion of the liver.
The patient should be asked about previous chest pain or
myocardial infarction because coronary artery disease is responsible for
up to 75 percent of cases of heart failure with decreased left ventricular
function.5 A history of myocardial infarction has a better combination of
sensitivity, specificity and positive and negative predictive value for heart
failure compared with other symptoms or aspects of the medical history.5
Once heart failure is suspected, the functional class of the
functional classification of congestive heart failure is commonly used in
clinical practice.
Physical Examination
A complete physical examination is the second component
in the diagnosis of heart failure. The patient’s general appearance should
be assessed for evidence of resting dyspnea, cyanosis and cachexia.
Blood Pressure and Heart Rate
The patient’s blood pressure and heart rate should be
recorded. High, normal or low blood pressure may be present. The
prognosis is worse for patients who present with a systolic blood pressure
of less than 90 to 100 mm Hg when not receiving medication
(angiotensin-converting enzyme [ACE] inhibitors, beta blockers or
diuretics). Tachycardia may be a sign of heart failure, especially in the
decompensated state. The heart rate increases as one of the compensatory
ways of maintaining adequate cardiac output. A decrease in the resting
heart rate with medical therapy can be used as a surrogate marker for
treatment efficacy. A weak, thready pulse and pulsus alternans are
associated with decreased left ventricular function. The patient should
also be monitored for evidence of periodic breathing (Cheyne-Stokes
Jugular Venous Distention
Jugular venous distention is assessed while the patient is
supine with the upper body at a 45-degree angle from the horizontal
plane. The top of the waveform of the internal jugular venous pulsation
determines the height of the venous distention. A height of more than 4 to
5 cm from the sternal angle is considered significant.
Elevated jugular venous pressure is a specific (90 percent)
but not sensitive (30 percent) sign of elevated left ventricular filling. The
reproducibility of the jugular venous distention assessment is low.23
Point of Maximal Impulse
The point of maximal impulse of the left ventricle is usually
located in the midclavicular line at the fifth intercostal space.
Cardiomegaly usually displaces the cardiac impulse laterally and
downward.
Third and Fourth Heart Sounds
A double apical impulse can represent an auscultated third
heart sound (S3). Just as with the displaced point of maximal impulse, a
third heart sound is not sensitive (24 percent) for heart failure, but it is
highly specific (99 percent).5
Patients with heart failure and left ventricular hypertrophy
murmurs, which can provide information about the cause of heart disease
and also aid in the selection of therapy.
Pulmonary Examination
Physical examination of the lungs may reveal crepitations
and pleural effusions. Despite the presence of pulmonary congestion,
crepitations can be absent because of increased lymphatic drainage and
compensatory changes in the perivascular structures that have occurred
over time. Wheezing may be the sole manifestation of pulmonary
congestion. Frequently, asthma is erroneously diagnosed in patients who
actually have heart failure.
Liver Size and Hepatojugular Reflux
The key component of the abdominal examination is the
evaluation of liver size. Hepatomegaly may occur because of right-sided
heart failure and venous congestion.
The hepatojugular reflux can be a useful test in patients with
right-sided heart failure. This test should be performed while the patient
is lying down with the upper body at a 45-degree angle from the
horizontal plane. The patient keeps the mouth open and breathes normally
to prevent Valsalva’s maneuver, which can give a false-positive test.
Moderate pressure is then applied over the middle of the abdomen for 30
increases by at least 3 cm and the increase is maintained throughout the
compression.23
Lower Extremity Edema
Lower extremity edema, a common sign of heart failure, is
usually detected when the extracellular volume exceeds 5 L. The edema
may be accompanied by stasis dermatitis, an often chronic, usually
eczematous condition characterized by edema, hyperpigmentation and,
commonly, ulceration.
Valsalva’s Maneuver
Valsalva’s maneuver is rarely used in the evaluation of
patients with heart failure. Yet this test is simple to perform and carries
one of the best combinations of specificity (91 percent) and sensitivity
(69 percent) for the detection of left ventricular systolic and diastolic
dysfunction in patients with heart failure. 25
Valsalva’s maneuver is performed with the blood pressure
cuff inflated 15 mm Hg over the systolic blood pressure. While the
physician auscultates over the brachial artery, the patient is asked to
perform a forced expiratory effort against a closed airway (the Valsalva’s
maneuver).
A normal response would be an initial rise in systolic blood
pressure at the onset of straining (phase I) with Korotkoff’s sounds heard.
pressure occurs with loss of Korotkoff’s sounds. Release of the maneuver
(phase III) is followed by an overshoot of blood pressure and the
reappearance of heart sounds (phase IV). Abnormal responses occurring
in patients with heart failure are maintenance of beats throughout
Valsalva’s maneuver (square wave) or lack of reappearance of
Korotkoff’s sounds after release of the maneuver (absent overshoot).
Laboratory Findings
Most patients with heart failure have normal electrolyte
levels. However, extended use of kaliuretic diuretics can lead to
hypokalemia, and the use of potassium-sparing diuretics and ACE
inhibitors may result in hyperkalemia. Blood urea nitrogen and creatinine
levels may become elevated, reflecting prerenal azotemia. Hyponatremia
may be present in patients with advanced heart failure.
When the liver becomes congested, serum transaminase and
bilirubin levels may become elevated, and jaundice may be present. With
chronic congestive hepatomegaly, cardiac cirrhosis may occur and cause
hypoalbuminemia, hypoglycemia and an increased prothrombin time.
The prognosis is worse in patients with hyponatremia or
abnormalities secondary to congested hepatomegaly.
Anemia may contribute to worsening heart failure. When
In all patients with newly diagnosed heart failure, thyroid
function tests should be performed to rule out hypothyroidism or
hyperthyroidism.
It may soon be possible to routinely obtain serum
measurements of two plasma enzymes secreted by the overloaded heart.
Plasma atrial natriuretic peptide is secreted in response to increased
intra-atrial pressure, and brain natriuretic peptide (BNP) is secreted by the
failing ventricle. Levels of these enzymes, but specifically BNP, are
elevated in patients with dyspnea resulting from heart failure. In one
study, elevated BNP levels had more than a 90 percent specificity and
sensitivity for heart failure. 26
Diagnostic Tests
Patients with heart failure and atrial fibrillation, atrial
tachycardia, ventricular tachycardia or left bundle branch block have a
worse prognosis than patients with heart failure who do not have these
electrocardiographic findings.
Electrocardiography
An electrocardiogram (ECG) should be obtained in all
patients who present with heart failure. A normal electrocardiogram
suggests that the diagnosis of Heart failure should be carefully reviewed.
The negative predictive value of normal electrocardiogram to exclude LV
anterior Q waves and a left bundle branch block in patients with ischemic
heart disease are good predictors of decreased Ejection fraction.28
Electrocardiographic signs of left atrial overload or left ventricular
hypertrophy may be associated with systolic as well as isolated diastolic
dysfunction, but they have a low predictive value. A QRS width of more
than 120 milliseconds suggests that cardiac dyssynchrony may be present
and a target for therapy. The electrocardiogram is crucial for detecting
atrial fibrillation or flutter, and sometimes ventricular arrhythmia, all of
which are causative or contributive factors for heart failure. The
diagnostic contribution of the electrocardiogram increases if completed
with clinical signs and symptom of cardiac failure.
Chest Radiography
Chest radiographs can be helpful in the diagnosis of heart
failure. Cardiomegaly is usually manifested by the presence of an
increased cardiothoracic ratio (greater than 0.50) on a posteroanterior
view. However, patients with predominantly diastolic dysfunction may
have normal heart size, one of the distinguishing markers of diastolic
versus systolic dysfunction. Similarly Cardiomegaly is frequently absent
in patients with acute heart failure of any cause. Right ventricular
enlargement is suggested by the loss of free space between the cardiac
Signs of increased pulmonary venous pressure seen on chest
radiographs may progress from redistribution of blood flow from the
bases of the lungs to the apices to linear densities reflecting interstitial
edema (Kerley’s lines) to a hazy appearance concentrated mostly around
the hila of the mediastinum and presenting a butterfly pattern.
Echocardiography
Transthoracic two-dimensional echocardiography with
Doppler flow studies is the investigation of choice for all patients with
heart failure.29 This test helps in the assessment of left ventricular size,
mass and ejection fraction.
The ejection fraction is defined as the ratio of the stroke
volume to end diastolic volume. It is most often computed as follows
EF = EDV – ESV / EDV x 100 (%)
The ejection fraction can be calculated by several methods,
including visual estimation, which has good correlation with ejection
fractions obtained by angiography30 or radionuclide cineangiography.31
Regional wall motion and valvular integrity, can also be evaluated.
Transesophageal echocardiography offers higher quality
images than transthoracic studies. However, this technique is invasive
and is best reserved for use when the quality of the two-dimensional
echocardiogram is unacceptable.
Radionuclide angiography is another noninvasive method for
assessing systolic and diastolic function. This imaging technique is used
when two-dimensional echocardiography is not diagnostic because
adequate images could not be obtained or the findings do not agree with
the clinical picture. Radionuclide angiography provides a reliable and
quantitative measurement of the left ventricular ejection fraction and the
regional wall motion. Left ventricular angiography can be used to assess
the ejection fraction, the left ventricular volume and the severity of
valvular regurgitation or stenosis.
Other Techniques
Magnetic resonance imaging (MRI) and ultrafast or cine
computed tomography (CT) 31 can measure the ejection fraction and
assess regional wall motion. However, assessment of cardiac function
using these studies is only performed in a limited number of centers, and
the superiority of the studies to echocardiography and angiography has
not been proved.
In patients with known coronary artery disease and heart
failure but no angina, coronary arteriography or noninvasive testing (i.e.,
a thallium stress test or stress echocardiogram), followed by coronary
arteriography in those patients with ischemia, should be considered. The
disease depends on the patient’s probability of having coronary artery
disease.
The electrocardiogram
An electrocardiogram or ECG (also known as EKG -
abbreviated from the German word Elektro-Kardiographie), is surface
measurement of the electrical potential generated by electrical activity in
cardiac tissue. It is the product of a series of technological and
physiological advances pioneered over the past two centuries.32 British
physiologist Augustus D. Waller was the pioneer of electrocardiography
and in 1887 published the first human electrocardiogram. Yet in 1911
Waller said, “I do not imagine that electrocardiography is likely to find
any very extensive use in the hospital. It can at most be of rare and
occasional use to afford a record of some rare anomaly of cardiac action.”
However, the invention of the string galvanometer in 1901 by Dutch
physiologist, Willem Einthoven provided a reliable and direct method of
registering electrical activity of the heart. 13 years later, the Nobel Prize
in Medicine was awarded to Willem Einthoven.
Basic principles
The electrocardiogram is a graphic recording of the electric
metal electrodes attached to the extremities and chest wall and are then
amplified and recorded by the electrocardiograph. ECG leads actually
display the instantaneous differences in potential between these
electrodes. The clinical utility of the ECG derives from its immediate
availability as an invasive, inexpensive and highly versatile test.
In addition to its use in detecting arrhythmias, conduction
disturbances and myocardial ischemia, electrocardiography may reveal
other findings related to life threatening metabolic disturbances (eg.
Hyperkalemia) or increased susceptibility to sudden cardiac death (e.g.
QT prolongation syndromes)
The standard clinical Electrocardiogram includes recording
from 12 leads. These 12 leads includes 3 bipolar (leads I, II and III), 6
unipolar precordial leads (leads V1 through V6) and 3 modified unipolar
limb leads (the augmented leads aVR, aVL and aVF).
Einthoven’s Law
The electrical connections for these leads are such that the
potential in lead II equals the sum of potentials sensed in leads I and III
I + III = II
This relationship is known as Einthoven’s Law or
Einthoven’s equation.
The standard 12 lead electrocardiogram is composed of
waves complexes, intervals and segments. Waves are positive and
negative deflection in the electrocardiograph baseline. The waves are
labeled alphabetically beginning with the letter P. Interval refers to the
length of a wave plus the isoelectric line that follows it. The length of an
interval ends when another wave begins. They are named by using the
letters of both waves on either side. Intervals contain waves. Segments
refer to the baseline between the end of one wave and the beginning of
the next wave. Segments are the lines between waves.
These include in the normal sinus rhythm the P wave, PR
Interval, PR Segment, QRS Complex, ST Segment, QT Interval, T wave
and occasionally U wave.
The P wave is caused by atrial depolarization. Electrical
impulses originating in the SA node trigger atrial depolarization. The
normal P wave is no more than 0.1 second in duration and 2.5mm high.
The direction of electrical activity is from SA to AV node. The P wave is
a representation of the time it takes for atrial depolarization. It is viewed
normally as small and curved with a positive deflection. Seen at it's tallest
on lead II.
The PR interval is the portion of the electrocardiogram wave
beginning of the QRS complex (onset of ventricular depolarization). It is
normally 0.12 - 0.20 seconds.
The PR segment is the portion on the electrocardiogram
wave from the end of the P wave to the beginning of the QRS complex.
The PR segment corresponds to the time between the end of atrial
depolarization to the onset of ventricular depolarization. It is an
isoelectric segment.
The QRS complex represents the time it takes for
depolarization of the ventricles. - Due to ventricular depolarization. It
consists of three waveforms. The normal complex begins with a
downward deflection known as the Q wave, followed by an upward
deflection called the R wave. The next downward deflection will be the S
wave. All ventricular complexes are known as QRS complexes even if
every wave is not present in all complexes. The normal QRS is 0.04 to
0.12 seconds measured from the first deflection to the end of the QRS
complex.
QT Interval is the beginning of the QRS complex to the end
of the T wave. In the presence of a U wave the measure should be from
the beginning of the QRS complex to the end of the U wave.
ST Segment is the length between the end of the S wave of
the QRS complex and the beginning of the T wave. It is electrically
The ST Segment represents the period of ventricular muscle
contraction before repolarization. The ST segment is normally isoelectric.
The QT interval begins at the onset of the QRS complex and
to the end of the T wave. It represents the time of ventricular
depolarization until ventricular repolarization.
The T wave is due to ventricular repolarization. The polarity
of the T wave is generally the same as the net polarity of the preceding
QRS complex. T waves are usually upright in leads I, II, aVL, aVF and
the lateral precordial leads.
The U wave is a low amplitude wave that may follow the T
wave. It is largest in mid precordial leads at slow heart rates. It is of the
same deflection as T Wave and similar to shape to P Wave. The U Wave
is thought to represent late repolarization of the Purkinje fibers in the
Ventricles and is more often not shown on a rhythm strip.
ECG in left ventricular systolic dysfunction
Systolic dysfunction of the left ventricle not only results in
an mechanical failure where in the left ventricle is not able to pump a
stroke volume that is adequate tissues, but also leads to a disarray of the
myocytes which lead to a change in their electric potential. This is
reflected in the surface electrocardiogram. A dilated left ventrical which
electrocardiographic picture of chamber hypertrophy and more
commonly an increase in QRS duration
Numerous studies have shown that left ventricular systolic
dysfunction is unlikely to be present if the electrocardiogram is normal
(or shows only minor abnormalities). Conversely, there is usually a major
electrocardiographic abnormality in the presence of increasing left
ventricular systolic dysfunction.33
Prolongation of QRS (120 ms) occurs in 14% to 47% of
heart failure (HF) patients. Left bundle branch block is far more common
than right bundle branch block.34 In a study done by A P Davie et al in
1996, Western General Hospital, Edinburgh, a total of 534 patients aged
17-94 were assessed. Ninety six had impaired left ventricular systolic
function. Of these, 90 had major electrocardiographic abnormalities
(atrial fibrillation, previous myocardial infarction, left ventricular
hypertrophy, bundle branch block, or left axis deviation); none had a
normal electrocardiogram. Of 438 patients with normal left ventricular
systolic function, 169 had major electrocardiographic abnormalities.5
In another study conducted by Xiao HB, Roy C, Fujimoto S, Gibson DG
et al., 1996, 58 patients with dilated cardiomyopathy were followed for 4
years.A QRS duration over 160 ms was found in 8 out of the 10 patients
who died, 6 of 9 who had a pacemaker and only in 5 out of the 39 stable
A prolonged QRS duration AND the presence of LBBB as a marker of
significant left ventricular systolic dysfunction was confirmed by several
studies.35,36
Apart from wide QRS duration and bundle branch blocks, up
to 50% of heart failure patients have minor intraventricular conduction
delays that result in abnormal electrical depolarisation of the heart and
mechanical asynchrony of the ventricles. Hence examination of a surface
ECG would pick up these changes.
Amplitude of the QRS complex also predicts left ventricular
dysfunction. In a study done by Wilensky RL et al., 1998, progressive
electrocardiographic changes were common in patients with idiopathic
dilated cardiomyopathy and QRS amplitude criteria were accurate in the
prediction of left ventricular dysfunction.37
There are also data which suggest that in more advanced
stages of congestive heart failure, power spectral analysis of heart rate
variability allows identification of a subgroup of patients with higher
sympathetic activation and poorer clinical status who are at major risk of
Methods and materials used.
Study population
The study was conducted among 50 randomly selected
patients referred to the Cardiology Department of Government
Royapettah Hospital for cardiac evaluation. Another 50 patients who had
normal left ventricular systolic function were used as controls.
Study duration
The period of study was from July 2004 to December 2005.
Inclusion criteria
1. Adult patients between ages 18 to 80
2. Left ventricular systolic function as defined by
an EF< 50 % in ECHO (the study population)
Exclusion criteria
1 Patients with myocarditis.
2. Recent Myocardial infarction.
3. Presence of pericardial effusion.
4. Patients in Cardiogenic Shock.
Study protocol
The patients included in the study were evaluated clinically.
echocardiography with Doppler flow. Left ventricular systolic function
was quantified in terms of fractional shortening derived from M mode.
Regional wall motion and valvular integrity were also evaluated.
Normal ejection fraction was defined as an ejection fraction
of 0.50 or more (50%). Left ventricular systolic dysfunction was defined
as an ejection fraction less than 0.50 (50%), an arbitrary definition based
on criteria used in studies such as the SOLVD study.
The patients were classified into study population
(EF<50%) and control population (EF > 50%). The study population was
furthered categorized into those with mild, moderate and severe left
ventricular systolic dysfunction. The classification used in our study is
shown below.
Mild Moderate Severe
Both the control and study population were evaluated
clinically. A standard 12 lead electrocardiogram along with a rhythm
strip was analyzed in detail and the study performa was completed.
The following points were noted in the electrocardiogram –
normal or abnormal, rate, rhythm, axis, presence of atrial or ventricular
ectopics, conduction defects, left atrial Abnormality, ventricular
enlargement and QRS duration.
The presence of certain electrocardiographic criteria such as
the Q waves, ST Segment and T wave abnormalities were not taken into
account as majority of the patients had ischemic heart disease.
For the purpose of the study the following criteria were
observed when interpreting the electrocardiogram.
Rate
A rate of more than 100 –Tachycardia
A rate of less than 60 – Bradycardia
Normal sinus rhythm
Equal R-R, PR, PP intervals
Each p wave followed by a QRS complex
P waves with normal morphology
P wave rate 60 - 100 bpm with <10% variation
Normal Axis – 30 to +100 degrees
Left Axis deviation – 90 to – 30 degrees
Right Axis deviation +100 to +180 degrees
Left atrial abnormality
Broad, notched P waves in II and AVF (greater than 2.5
millimeters wide)
A negative component in V1 or V2 (that exceeds one millimeter
by one millimeter, e.g., 40 milliseconds by 0.1 millivolt)
Right Bundle Branch Block
Wide QRS, more than 120 ms (3 small squares)
An rSR' or rsR' in right-sided lead V1
Prominent, delayed and wide terminal S in V5 or V6
Left Bundle Branch Block
Wide QRS, more than 120 ms (3 small squares)
An upright (monophasic) QRS complex in leads I and V6
A predominantly negative QRS complex in lead V1
Left anterior hemiblock
QRS axis more left than -30 degrees
Initial R wave in the inferior leads (II, III and aVF)
Absence of any other cause of left axis deviation
Normal QRS complex
LV Hypertrophy
Sokolow’s criterion (S wave in lead V1 [SV1] + R wave in lead V5
or V6 [RV5 or RV6] > 35 mm)
RV hypertrophy
Dominance of R in right-oriented leads
Right axis deviation.
Using the above criteria each electrocardiogram was read
and the results were tabulated. These were then analyzed with the data
Computation of results
Of the Electrocardiograms studied in the study group (with
left ventricular systolic dysfunction) only 2 (4%) were absolutely normal.
Among the control group 70% of the electrocardiograms were normal.
Control Study
Normal ECG 35 2
Abnormal
ECG
15 48
Age distribution
The age distribution of the study group was tabulated. The
youngest person was 24 years old and the oldest patient was 84years old.
The average age of the study group was 54.7 years.
Study Control
18-29 2 4
30-39 6 13
40-49 9 11
50-59 12 10
60-69 15 9
70-79 5 2
80-89 2 1
Sex distribution
Majority of the patients were male both in the control
population and in the study population.
Study Control
Male 30 (60%) 30 (60%)
Female 20 (40%) 20 (40%)
Total 50 50
Etiology of Heart failure
In our study majority (68%) of the patients had ischemic
heart disease. The other causes included hypertensive heart disease,
valvular heart disease and cardiomyopathies.
Etiology Study
Coronary artery disease 32
Hypertensive heart disease 5
Valvular heart disease 7
Variation in heart rate
The average resting heart rate in the study group was 99.8
with a range from 72 to 124. Whereas the average heart rate in the control
population was 80.16 with a range from 60 to 110.
Control Mild Moderate Severe
Normal rate
(60 to 100)
47 15 8 2
Sinus tachycardia
(>100)
3 4 10 4
Average heart
rate
80.16 93.3 103.6 110.5
Rhythm abnormalities
As the Ejection fraction decreased, then incidence of atrial
and ventricular ectopics increased. 94% of the control population had
normal sinus rhythm. This decreased to 42% among those with left
ventricular systolic dysfunction.
Control Mild Moderate Severe
Normal sinus rhythm 47 15 9 2
Atrial ectopics 3 3 4 4
Ventricular ectopics 4 4 5 5
Axis deviation
Normal axis was present in 96% of the control population,
whereas only 68% of the study population had normal axis. The mean
axis in control population was 37.5 (range -40 to 70) and in the study was
20.9 (range -60 to 120).
Control Mild Moderate Severe
Normal Axis 48 17 14 3
Left axis deviation 2 4 3 5
Right axis deviation 0 3 1 0
Extreme axis 0 0 0 0
Average axis 37.5 36.2 19.16 -21.2
Chamber hypertrophy
12% of the control population had left ventricular
hypertrophy. Among the study population 36% had LV hypertrophy and
4% had RV hypertrophy.
Control Mild Moderate Severe
LV hypertrophy 6 11 4 3
RV hypertrophy 0 2 0 0
No hypertrophy 44 11 14 5
Normal conduction was present in 46 (92%) persons of the
control population. This decreased to 33 (66%) in the study population.
The most common form of conduction defects was Left Anterior
Fascicular block.
Control Mild Moderate Severe
Normal
conduction
46 20 11 2
LAFB 2 4 1 3
RBBB 1 1 2 2
LBBB 1 1 0 4
Left Atrial Abnormality
Abnormal wide P waves were present in 48% of the persons
with left ventricular systolic dysfunction, but occurred only in 10% of
them with normal left ventricular systolic function.
Study Control
Normal p 26 45
Abnormal p
(LA Abnormality)
QRS Duration
Average QRS duration in the control population was 86.6
milliseconds (range 75 to 110). In the group with left ventricular systolic
dysfunction it was 107.4 milliseconds (range 80 to 140). None of the
patients in the study population had a QRS duration more than 120
milliseconds. On the other hand 30% of the study population had QRS
duration more than 120 milliseconds
QSR
duration
Control Mild Moderate Severe
70-79 1 0 0 0
80-89 27 6 1 0
90-99 19 7 3 0
100-109 2 4 5 0
110-119 1 4 4 1
120-129 0 1 4 1
130-139 0 1 1 2
140-149 0 1 0 4
Combination of criteria
Combination 1: Heart rate more than 90, left atrial abnormality and
QRS duration >110 milliseconds
Combination 2: Heart rate more than 90, Axis < 0 or > 90 and QRS
duration > 110 milliseconds
Combination 3: Heart rate more than 90, and QRS duration >110
milliseconds
Control Study Mild Moderate Severe
Combination 1 0 11 (22) 5 (20) 3 (16.6) 3(37.5)
Combination 2 0 12 (24) 2 (8) 4 (22.2) 6 (75)
Combination 3 0 22 (44) 7 (29) 8 (44.4) 7(87.5)
None of the control population had more than one criteria present. Hence
none of the combination criteria was present. A combination of Heart rate
more than 90, and QRS duration >110 milliseconds (combination 3) was
present in 87.5 % of patients with very low ejection fraction. However all
3 three combinations were not present in majority of patients with mild
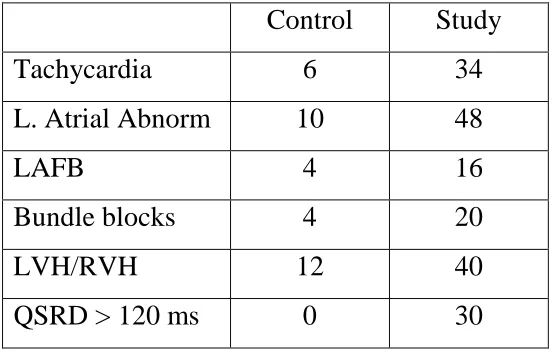
Summary
Table showing in percentage the difference between the
heart rate, left atrial abnormality (LAA), ectopics, ventricular
hypertrophy, and increased QRS duration between the control population
and the study population.
Control Study
Tachycardia 6 34
L. Atrial Abnorm 10 48
LAFB 4 16
Bundle blocks 4 20
LVH/RVH 12 40
[image:49.595.160.437.264.441.2]Discussion
A total of 100 patients were analyzed in this study of which
50 were patients with left ventricular systolic dysfunction (EF < 50%)
and 50 patients with normal left ventricular function. Analysis of the data
shows us that majority of the patients were male (60%) both in the study
and control population.
The most common cause of heart failure in this study was
coronary artery disease (64%). Similar findings were observed in other
studies.13
48 patients in the study population had ECG abnormalities
(96%). In contrast only 30% had abnormal electrocardiograms among the
control population. Hence the negative predictive value of a normal
electrocardiogram is very high.
Our study showed that as the Ejection fraction decreased the
resting heart increased. The average heart rate in the control population
was 80.1 per minute. It increased to 93.3 per minute in the control
population. In patients with severe left ventricular systolic dysfunction it
was still higher (110.5 per minute). 34 % of the control population had
sinus tachycardia and 14% had atrial fibrillation. In strong contrast only
fibrillation. Hence an increasing heart rate is associated with low EF but
should be interpreted with the help of associated findings.
Axis deviation was more in patients with left ventricular
systolic dysfunction (32% compared to 4% among control population).
Among this left axis deviation was more common (24%) than right axis
deviation (12%). However axis deviation cannot be taken as a significant
ECG criterion as majority of the patients even with left ventricular
systolic dysfunction (i.e. 68%) had normal axes.
In our study the QRS duration was the single most important
ECG criterion strongly associated with left ventricular systolic
dysfunction. As the QRS duration increased the EF decreased. The
average QRS duration in the control population was 86.6 milliseconds
(range 75 to 110). This increased to 107.8 ms in the study population.
Moreover among patients with severe left ventricular systolic dysfunction
the average QRS duration was 131.85 milliseconds. Looking at the
incidence, none of the patients in the study group had QRS duration more
than 120 milliseconds. This rose to 30 % among the control group.
Among patients with severe left ventricular systolic dysfunction 87.5%
had a QRS duration more than 120 milliseconds.
These results are similar to the conclusions of several studies
with more advanced myocardial disease including those by A P Davie,
Amir Kashani, Das MK, Cheripambil K, Bedi A, et al.33, 34, 35
Left atrial abnormality as evidenced by abnormal P waves is
another ECG criterion closely associated with left ventricular systolic
dysfunction. In our study 48 % of the patients with left ventricular
systolic dysfunction had left atrial abnormality, while it was present in
only 10% of the control population. Thus in the absence of systemic
hypertension and mitral valve disease, left atrial abnormality can be taken
as an indicator to the presence of left ventricular dysfunction.
34% of our patients in study population had conduction
abnormalities, compared to only 8 % of the control population. The most
common abnormality was Left anterior fascicular block. However, in
patients with severe left ventricular systolic dysfunction 50 % had a left
bundle branch block. Studies done by Das MK, Cheripambil K, Bedi A,
et al and Murkofsky RL et al also confirms similar observation that
LBBB is a marker of significant left ventricular systolic dysfunction.35, 36
12% of the control population had left ventricular
hypertrophy. Among the study population 36% had LV hypertrophy and
4% had RV hypertrophy. Although incidence of LV hypertrophy is more
in the study population, chamber hypertrophy is both non specific and
Finally in this study combination of several ECG criteria
were used. A combination of heart rate more than 90, left atrial
abnormality and QRS duration >110 milliseconds was present in 37.5%
of patients with severe LV dysfunction but in only 20% of the mild LV
dysfunction group. Another combination of Heart rate more than 90, and
QRS duration >110 milliseconds was present in majority (87.5%) of
patients with severe LV dysfunction but in only 29% of the mild LV
dysfunction group. However none of the control population had more
than single ECG abnormality. Hence use of combination criteria would
Limitations of our study
1. The etiology of heart failure in most of the patients in the study
population was coronary artery disease. The electrocardiographic
changes produced by ischemia in those patients could be a source
of error.
2. In view of the high incidence of coronary artery disease, certain
criteria such as Q waves, ST segment and T wave changes were not
used for analysis.
3. This study had certain confounding factors such as age,
emphysema, obesity, electrolyte imbalance, drugs etc. which could
alter the surface electrocardiogram.
4. The study population is small and the design was retrospective. A
larger study population and a prospective study may have produced
Conclusions
1. Coronary artery disease is the most common cause of left
ventricular systolic dysfunction.
2. There is a consistent association between the standard 12 lead
electrocardiogram and left ventricular systolic dysfunction.
3. A normal electrocardiogram virtually excludes chronic heart
failure due to left ventricular systolic dysfunction.
4. There are usually major electrocardiographic abnormalities as the
severity of left ventricular systolic dysfunction increases.
5. The resting heart rate increases consistently with decreasing left
ventricular systolic function.
6. Ectopic activity (Both Atrial and ventricular) increases with
decreasing left ventricular ejection fraction.
7. Conduction defects increases with worsening Left ventricular
systolic function. Left anterior fascicular block is the most
common conduction abnormality. However a Left bundle branch
block is more common in those with severe left ventricular systolic
dysfunction.
8. Increasing QRS duration is the single most specific criteria which
correlates well with decreasing ejection fraction. A QRSD duration
conduction defect signifies significant left ventricular systolic
dysfunction
9. Among the electrocardiographic abnormalities a combination of
sinus tachycardia, left Atrial abnormalities and QRS duration were
found to be most specific but loses sensitivity.
10. The electrocardiogram is not a substitute for echocardiography, as
an abnormal electrocardiogram does not accurately predict the
presence of left ventricular systolic dysfunction.
11. An abnormal electrocardiogram does not mean that the patient has
S.N o.
Name A
G E
S e x
Cause EF Rate Rhythm Axis LAA LAFB QRSD APC VPC LVH RVH RBBB LBBB
1 Raghu 35 M CM 25 120 ST -40 + + 140 -- -- -- -- + --
2 Vaidyanathan 50 M CAD 35 124 ST -45 + -- 85 + -- -- -- -- --
3 Revathi 56 F CAD 40 78 NSR 30 -- -- 110 -- -- + -- -- --
4 Muhtulaxmi 84 F CAD 42 120 AF 25 NA -- 120 NA + -- -- -- --
5 Varadhan 65 M Valv 44 98 NSR 40 + -- 110 -- -- -- -- -- --
6 Destagiri 58 M CAD 40 102 ST -50 + + 130 + + -- -- -- +
7 Padma 40 F CAD 48 90 NSR 30 -- -- 110 -- -- + -- -- --
8 Devika 25 M Valv 40 75 AF 120 + -- 90 + -- + -- -- --
9 Jeyaraman 80 M CAD 45 110 ST 50 -- -- 80 -- -- -- -- -- --
10 Mary 32 F CM 35 98 NSR -35 + + 125 -- -- -- -- + --
11 Yunus 63 M CAD 28 72 NSR -60 + + 110 + + + -- -- --
12 Thulukanam 52 M Valv 39 110 ST 45 + -- 100 -- -- + -- -- --
13 AbdulMazzed 75 M CM 30 98 NSR 60 -- -- 120 -- + -- -- -- --
14 Ulaganathan 51 M CM 25 100 NSR 20 -- -- 140 -- -- -- -- -- --
15 Ahamed 65 M CAD 32 110 ST 35 -- -- 95 -- + + -- -- --
16 Annaraj 46 M CAD 42 75 NSR 35 + -- 85 -- -- -- -- -- --
17 Samuel 24 M Valv 49 100 AF 110 NA -- 90 NA + + + -- --
18 Aarthi 42 F CAD 38 98 NSR 60 -- -- 90 -- -- -- -- -- --
19 Devika 70 F CAD 42 110 ST 55 + -- 95 -- -- -- -- -- --
20 James 40 M HHD 49 86 AF 30 NA -- 100 -- -- + -- -- --
21 Allah Basha 58 M CAD 30 120 ST -35 -- -- 125 + -- -- -- + --
22 Parvathi 60 F CAD 28 122 ST -45 + -- 130 + -- + -- -- +
23 Laxmi 62 F CAD 39 98 NSR 100 + -- 105 -- -- + -- -- --
24 Mohammed 55 M HHD 45 74 NSR 30 + -- 85 -- -- + -- -- --
25 Prabu 65 M CM 26 112 AF -35 NA + 140 + + -- -- + --