A Physical Model for the Luminosity
Function of High#Redshift Quasars
The Harvard community has made this
article openly available.
Please share
how
this access benefits you. Your story matters
Citation
Wyithe, J. S. B., and A. Loeb. 2002. “A Physical Model for the
Luminosity Function of High#Redshift Quasars.” The Astrophysical
Journal 581 (2): 886–94. https://doi.org/10.1086/344249.
Citable link
http://nrs.harvard.edu/urn-3:HUL.InstRepos:41393303
Terms of Use
This article was downloaded from Harvard University’s DASH
repository, and is made available under the terms and conditions
applicable to Other Posted Material, as set forth at
http://
A PHYSICAL MODEL FOR THE LUMINOSITY FUNCTION OF HIGH-REDSHIFT QUASARS
J. S. B. Wyithe1 and A. Loeb
Harvard-Smithsonian Center for Astrophysics, 60 Garden Street, Cambridge, MA 02138; [email protected], [email protected]
Received 2002 June 10; accepted 2002 August 19
ABSTRACT
We provide a simple theoretical model for the quasar luminosity function at high redshifts that naturally reproduces the statistical properties of the luminous Sloan Digital Sky Survey (SDSS) quasar sample at redshiftsz4:3 andze5:7. Our model is based on the assumptions that quasar emission is triggered by galaxy mergers and that the black hole mass is proportional to a power law in the circular velocity of the host galactic halo,vc. We assume that quasars shine at their Eddington luminosity over a time proportional to the
mass ratio between the small and final galaxies in the merger. This simple model fits the quasar luminosity function atz2–3, reproduces the normalization and logarithmic slope ( 2:58) atz4:3, explains the space density of bright SDSS quasars atz6:0, reproduces the black hole-halo mass relation for dormant black holes in the local universe, and matches the inferred duty cycle of quasar activity (107yr) in Lyman
break galaxies at z3. An acceptable fit to all of these constraints requires 0:7d8d1:0. Based on the
derived luminosity function, we predict the resulting gravitational lensing rates for high-redshift quasars. The lens fractions in the SDSS samples are predicted to be2% atz4:3 and8% atze5:7. It is interesting to note that the limiting quasar luminosity in our best-fit relationL/v5
c=Gscales as the binding energy of the
host galaxy divided by its dynamical time, implying that feedback is the mechanism that regulates black hole growth in galactic potential wells.
Subject headings:gravitational lensing — quasars: general
1. INTRODUCTION
While the quasar luminosity function has been studied extensively at redshifts belowz3 (e.g., Boyle, Shanks, & Peterson 1988; Hartwick & Schade 1990; Pei 1995; Boyle et al. 2000), the Sloan Digital Sky Survey (SDSS; Fukugita et al. 1996; Gunn et al. 1998; York et al. 2001) has, in recent years, substantially increased the number of quasars known at ze3:5 (Fan et al. 2001a, 2001b; Schneider et al. 2001). Two samples of very high-redshift SDSS quasars have been presented to date. The first of these is a sample of 39 lumi-nous quasars with redshifts in the range 3:6<z<5:0 and a median of 4.3. The second sample consists of four quasars atze5:7, including the quasar with the highest known red-shift (z¼6:28). These samples begin to sketch out the lumi-nosity function of quasars atze4 and are very important for studies of the ionizing background radiation and of qua-sar evolution around the epoch of reionization (Haiman & Loeb 1998). Although the logarithmic slope of the luminos-ity function for bright quasars admits a universal value of
3.5 at redshiftszd3, Fan et al. (2001a) find a shallower logarithmic slope of 2.5 for their luminous quasars at
ze3:5. At first sight, this is a puzzling result because the exponential tail of the Press-Schechter (1974) mass function describing the space density of the massive host galaxies in which bright quasars are thought to reside becomes progres-sively steeper with increasing redshift.
There are several published models of varying complexity to describe the observed evolution of the quasar luminosity function within hierarchical structure formation theory (e.g., Efstathiou & Rees 1988; Small & Blandford 1992; Haehnelt & Rees 1993; Haiman & Loeb 1998; Haehnelt
Natarajan, & Rees 1998; Kauffmann & Haehnelt 2000). In these models, the luminosities and lifetimes of the quasars are governed by the black hole mass and the supply of cold accreting gas. The abundance and evolution of the super-massive black holes assumed to power the quasars are linked to the evolution of the mass-function of galactic halos. The density of bright quasars is observed to decline rapidly with redshift belowz2 (Boyle, Shanks, & Peter-son 1988; Hartwick & Schade 1990). This decline has been explained (Kauffman & Haehnelt 2000; see also Cavaliere & Vittorini 2000) in terms of decreases in the merger rate and the availability of cold gas to fuel the black holes. In addi-tion, the density of bright quasars is also observed to decline beyond a redshift ofz2 (Warren, Hewett, & Osmer 1994; Schmidt, Schneider, & Gunn 1995; Kennefick, Djorgovski, & de Carvalho 1995). Under the assumption that quasar activity is related to the formation rate of halos, model lumi-nosity functions have been constructed that successfully describe this decline and the shape of the luminosity func-tion between z2 and z3:5 (Efstathiou & Rees 1988; Haehnelt & Rees 1993; Haiman & Loeb 1998; Haehnelt, Natarajan, & Rees 1999; Haiman, Madau, & Loeb 1999). These models predict the luminosity function at still higher redshifts. With the recent influx of results on the quasar luminosity at redshifts abovez4, it is interesting to revisit the question of modeling the evolution of the quasar lumi-nosity function at high redshifts. In this paper, we demon-strate that a very simple model can explain the new results on the high-redshift quasar luminosity function.
Our model for the evolution of the quasar luminosity function is based on the Press-Schechter (1974) mass func-tion and halo merger rates computed with the excursion set formalism (Bond et al. 1991; Lacy & Cole 1993). We show that this model can reproduce all of the known properties of the luminosity function above z2. We begin in x 2 by
1Hubble Fellow.
The Astrophysical Journal, 581:886–894, 2002 December 20 #2002. The American Astronomical Society. All rights reserved. Printed in U.S.A.
describing an approximate version of our model (Haiman & Loeb 1998, hereafter HL98), followed by the full discussion based on the halo merger rates. Inx3 andx4, we discuss the data on the quasar luminosity function and its comparison with our model. Finally, we discuss the implications of our model for gravitational lensing in high-redshift samples of quasars in x 5 and present our main conclusions in x 6. Throughout the paper, we assume density parameters of
m¼0:35 in matter,¼0:65 in a cosmological constant,
and a Hubble constant ofH0¼65 km s1 Mpc1. For
cal-culations of the Press-Schechter (1974) mass function, we assume a primordial power-spectrum withn¼1 and the fit-ting formula to the exact transfer function of Bardeen et al. (1986). Unless otherwise noted, we take8 ¼0:87.
2. THEORETICAL LUMINOSITY FUNCTIONS
We discuss two models for the high-redshift quasar lumi-nosity function that are based on the Press-Schechter (1974) mass function of dark matter halos (including the modifica-tion of Sheth & Tormen 1999) and the halo merger rates from the excursion set formalism of Bond et al. (1991) and Lacy & Cole (1993). We begin with the approximate model of HL98, which is based on the halo formation rate. We then describe a more complete model based on halo merger rates. We will demonstrate in x 4.1 that only this latter model reproduces all the known features of the quasar lumi-nosity function abovez2 as well as the local black hole– host halo mass relation and new estimates of the quasar duty cycle.
2.1. An Approximate Model for the Quasar Luminosity Function Based on the Halo Formation Rate
HL98 discussed an approximate model for the high-redshift quasar luminosity function by supposing that qua-sars are associated with newly formed halos. Their model assumes that each galactic halo hosts a black hole with a mass (Mbh) that is a constant fraction () of the host halo
mass (Mhalo) and that the black hole shines at its Eddington
rate with a universal light curve,fðtÞ. HL98 used the deriva-tive of the Press-Schechter mass function to approximate the formation rate of halos, arguing that mergers are rare at high redshift so that the negative contribution to the deriva-tive is negligible. In this model, the quasar luminosity as a function of time is
LBðtÞ ¼MbhfðtÞ ¼MhalofðtÞ forMhalo>Mmin; ð1Þ
whereMmin108 M½ð1þzÞ=10
3=2
is the minimum halo mass inside which a black hole can form. This lower mass limit corresponds to the virial temperature below which atomic cooling is not effective in allowing the gas to sink to the center (Barkana & Loeb 2001). Following HL98, we write the resulting quasar luminosity function, defined as the comoving number density of quasars having rest-frame
B-band luminosities between LB and LBþDLB and
red-shifts betweenzandzþDz, as
HLðLB;zÞ ¼
Z 1 z dz0 Z 1 Mmin dMbh
d2n bh
dMbhdz0
½LBMbhfðtzt0Þ; ð2Þ
where tz and t0 are the time at redshifts z and z0, and d2n =dM dz0 is the change in the comoving number
density of black holes betweenz0and z0þdz0. Integrating
overMbh, we get HLðLB;zÞ ¼
Z a¼1=ð1þzÞ
0
dadz da
1
fðtztÞ
d
2n bh
dMbhdz M
bh¼LB=½f tðztÞ
; ð3Þ
wherea¼ ð1þzÞ1is the scale factor at a redshiftz. HL98 used an exponential with ane-folding timetdc;0for the
uni-versal light curvef. We find that the equivalent result for
HLðLB;zÞ is obtained more simply by assuming a step
function forf, namely
fðtÞ ¼LEdd;B
Mbh
ðttdc;0Þ; ð4Þ
whereLEdd;B¼5:7103ðMbh=MÞis the Eddington
lumi-nosity inB-band solar luminosity units for the median qua-sar spectrum (Elvis et al. 1994) andðtÞis the Heaviside step function. We then find
HLðLB;zÞ ¼
Z a¼1=ð1þzÞ
amin¼1=ð1þzformÞ dadz
da Mbh
LEdd;B
d
2n bh
dMbhdz
Mbh¼LB=½f tðztÞ
; ð5Þ
given the formation redshift for the halo,zform. Assuming
that tdc;05H1ðzÞ, ðaaminÞ ðda=dtÞtdc;0, and relating
the space density of black holes to the Press-Schechter (1974) mass function through
d2n bh
dMbhdz
¼1
d2n ps
dMhalodz
; ð6Þ
we obtain the following simple expression for the quasar luminosity function:
HLðLB;zÞ tdc;0
H1 0
ffiffiffiffiffiffiffiffiffiffiffiffiffiffiffiffiffiffiffi m
a5 þ
a2 r
1 5:7103
1
d2n ps
dMhalodz
Mhalo¼LB=ð5:7103Þ
: ð7Þ
We will compare this model to observations inx4.2. 2.2. A Model for the Quasar Luminosity Function Based on
the Halo Merger Rate
The HL98 model associates quasar activity with halo for-mation. The assumption is that the halo merger rate is much lower than the halo formation rate at high redshift. How-ever, at low redshifts, the formation rate becomes smaller than the merger rate, and the derivative of the Press-Schechter mass function on which the model is based no longer approximates the halo formation rate. Quasar activ-ity at low redshift can be explained in relation to halo merger activity (Carlberg 1990; Kauffmann & Haehnelt 2000). In this section, we discuss a simple model that associ-ates quasar activity at high redshift with the merger rate of halos.
The merger rate of halos was computed by Lacy & Cole (1993) based on the excursion set formalism of Bond et al. (1991). We compute the number of halos having masses betweenDM andDM þdDM that accrete onto a
halo of mass MhaloDMhalo per unit time d2Nmerge
=
dDMhalodt
ð ÞjMhaloDMhalo. Thus, the number of merger events
involving the accretion of a halo of massDMhaloby a halo
of massMhaloDMhaloper unit time per comoving volume
at a redshiftzis given by the product
dnps dM
M¼MhaloDMhalo
d
2N merge
dDMhalodt
MhaloDMhalo
: ð8Þ
We assume that the mass of the central black hole scales as a power law with the circular velocity (vc) of the halo,
Mbh/vc : ð9Þ
The circular velocity of a halo of massMhaloat redshift (z)
can be written as (Barkana & Loeb 2001)
vc¼159:4
Mhalo
1012 h1 M
1=3 m zm Dc 182 1=6
ð1þzÞ1=2 km s1; ð10Þ
where h¼ ðH0=100 km s1 Mpc1Þ, Dc¼182þ82d
39d2 is the final overdensity relative to the critical
density at redshift z, and d 1z
m with zm¼
mð1þzÞ
3
=mð1þzÞ
3
þ
. We can therefore write
Mbh
Mhalo
¼¼0
Mhalo
1012 M
ð=3Þ1 m z m Dc 182 =6
h=3ð1þzÞ=2; ð11Þ
and fit for two free parameters,0 and, that describe the
evolution and slope of the black hole–halo mass relation. We assume that the black holes coalesce upon halo merger (Kauffmann & Haehnelt 2000) and find the number of black holes of mass between DMbh and DMbhþdDMbh that
merge with black holes of massMbhDMbhper unit time:
d2N merge
dDMbhdt
MbhDMbh
¼ 3
d2N merge
dDMhalodt
MhaloDMhalo
: ð12Þ
A linear relation (¼3) between black hole mass and halo mass is a natural consequence of black hole growth that is dominated by coalescence with no gas accretion (Haehnelt et al. 1998). Values of >3 result from significant gas accretion during the active quasar phase as deduced by Yu & Tremaine (2002). We assume that after a merger, a frac-tion of the cold gas from the accreted halo is driven onto the central black hole of mass Mbh (Mihos & Hernquist 1994;
Hernquist & Mihos 1995). If the quasar shines at the Eddington rate of the black hole in the merger product (see, e.g., Yu & Tremaine 2002), then the cold gas from the small accreted halo (which makes up the new fuel reservoir) will run out in a time approximately proportional to
DMbaryon
Mhalo
¼DMhalo
Mhalo
DMbaryon
DMhalo
; ð13Þ
whereDMbaryonis the mass in baryons within the accreted
halo.2 Thus, we postulate that after a merger, the quasar
shines at the Eddington rate corresponding to the merger
product for a time proportional to both the ratio between the masses of the accreted and initial halo and the baryon fraction of the accreted halo.
In order to examine whether the baryon mass fraction in the accreted halo would be affected by the photo-ionization heating of the intergalactic medium (IGM) after reionization, we have solved the linear growth fac-tors Ddm and Db for the dark matter and baryons on a
spatial comoving scale R¼ð3DMhalo=4mÞ1=3, where m
is the average matter density of the universe today. These growth factors obey the following set of coupled differen-tial equations for the dark matter and baryon over-densities dm andb in the linear regime (e.g., Barkana &
Loeb 2001):
€
dmþ2H_dm¼
3 2H
2
bðzÞbþdmðzÞdm
½ ;
€
b
bþ2H_bb¼
3 2H
2
½bðzÞbþdmðzÞdm
f g kBTi
lmp k a 2 ai a 1þ bþ 2
3ðbb;iÞ
: ð14Þ
Here T is the gas temperature, l the mean molecular weight (0.69 for ionized IGM), kB is Boltzmann’s
con-stant, and k is the comoving wave number for the mode of interest. The subscripts i refer to quantities at an ini-tial reference time and ¼0 or 1 for adiabatic or iso-thermal evolution. We assume reionization at zreion¼7.
Before reionization, we assume Ti¼0: the baryon and
dark matter overdensities undergo the same evolution during this period. Following reionization, the IGM is assumed to be heated to 104 K and to evolve
isother-mally (¼1). The evolution of Db is described by the
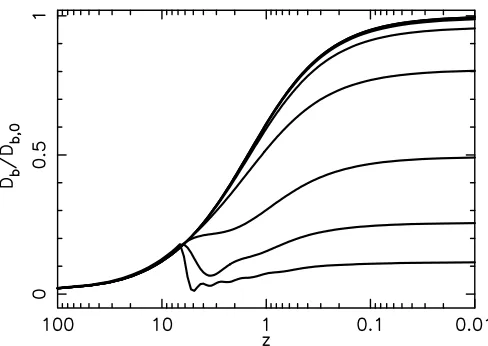
[image:4.612.316.566.213.291.2]superposition of solutions to equation (14) weighted by the Fourier transform of the spatial top hat window function of width R (Medvigy & Loeb 2001). Figure 1 shows the evolution of Db with redshift. The
curves shown correspond (from bottom to top) to halo masses ofMhalo¼106, 107, 108, 109, 1010, 1011, 1012, 1013,
2Eq. (13) can be derived as a Taylor expansion for minor mergers. For
simplicity, we apply it to all mergers.
Fig.1.—Growth factorDb (normalized to the present-day Db;0Þfor
baryons associated with dark matter halos of massMhalo¼106, 107, 108,
109, 1010, 1011, 1012, 1013, and 1014M
(bottom to top). The downturn of the growth factor for small halos corresponds to the reionization epoch at zreion7:0.
[image:4.612.320.564.524.697.2]and 1014 M
. The dark matter growth factor corresponds
to the upper envelope in this figure. Prior to reionization
Db follows Ddm for all halo masses. Reinonizaton heats
the IGM and eliminates gas accretion onto small halos. The baryon overdensity in halos larger than 1010 M
is
unaffected by reionization. Thus, we find that the effect of reionization on the luminosity function is apparent only for quasars fainter than 1011 L
, which is well
below the detection threshold of existing quasar surveys at z41, such as SDSS. We therefore assume a fixed
baryon mass fraction in objects relevant for the luminos-ity function of bright quasars at high redshifts.
The quasar light curve and luminosity function may therefore be written as
fðtÞ ¼LEdd;B
Mbh
tDMhalo
Mhalo
tdc;0
; ð15Þ
and
ðLB;zÞ ¼
Z 1
Mmin dMbh
Z 0:5Mbh
0
dDMbh Z 1
z
dz0dnbh
dM
M¼MbhDMbh
d2Nmerge
dDMbhdt0
MbhDMbh
dt
0
dz0LBMbhfðtzt 0Þ
½ ; ð16Þ
in analogy with equations (4) and (5), respectively. Integrat-ing overMbh, we find
ðLB;zÞ ¼
Z 0:5Mhalo
0
dDMhalo
Z a¼1=ð1þzÞ
amin¼1=ð1þzformÞ
dadz da dnps dM
M¼MhaloDMhalo
d
2N merge
dDMhalodt
MhaloDMhalo
3
dt dz
Mbh
LEdd;B
: ð17Þ
Assuming tdc;05H1ðzÞ, we then obtain
aamin¼ðda=dtÞtdc;0ðDMhalo=MhaloÞ, yielding the
lumi-nosity function
ðLB;zÞ ¼
Z 0:5Mhalo
0
dDMhalo
3
tdc;0
5:7103
DMhalo
Mhalo
ð18Þ
dnps dM
M¼MhaloDMhalo d2N
merge
dDMhalodt
MhaloDMhalo
;
ð18Þ
where Mhalo¼LB=5:7103. The value of tdc;0 can be
related to the duty cycle of quasars tdc through
considera-tion of the number of mergers during a Hubble timeH1ðzÞ,
tdcðLB;zÞ ¼tdc;0
Z Mhalo¼ð0:5LBÞ=ð5:7103Þ
0
dDMhalo
DMhalo
Mhalo
H1ðzÞ d
2N merge
dDMhalodt
MhaloDMhalo
; ð19Þ
We will compare the luminosity function predicted by this model with observations inx4.1.
3. OBSERVED LUMINOSITY FUNCTION
The standard double power-law luminosity function (Boyle, Shanks, & Peterson 1988; Pei 1995)
ðLB;zÞ ¼
=LðzÞ
½LB=LðzÞlþ ½LB=LðzÞh
ð20Þ
provides a good representation of the observed quasar lumi-nosity function at redshifts zd3. At the faint end of the luminosity function, the slope is l¼1:58, while at the
bright end h¼3:43 (Boyle et al. 2000). Moreover, all
dependence on redshift (atzd2) is in the break luminosity
L, indicating pure luminosity evolution. At low redshift, the break luminosity evolves approximately as a power law in redshift, and the space density of bright quasars increases with redshift. However, surveys at higher redshift show a decline in the space density of bright quasars beyondz3 (Warren, Hewett, & Osmer 1994; Schmidt, Schneider, & Gunn 1995; Kennefick, Djorgovski, & de Carvalho 1995).
While quasar evolution below z2 3 is described by pure luminosity evolution, Fan et al. (2001a) found from their sample of SDSS quasars atz4:3 that the slope at the bright end of the luminosity function has evolved from the
zd3 value of h 3:5 to h 2:5. This result is
sup-ported by the analysis of Schmidt, Schneider, & Gunn (1995). Fan et al. (2001a) also find an evolution of space density with redshift for bright quasars of /100:5z
betweenz3:5 andz5. The space density of bright qua-sars measured by Fan et al. (2001b) atz6 agrees with the extrapolation of this evolution.
We seek to model the observed features of the luminosity function at redshifts higher than the peak in quasar evolu-tion atz2. In the following section, we will discuss both our model (x2.2) and the HL98 model in light of the recently acquired data on quasars at high redshifts.
4. COMPARISON OF OBSERVED AND MODEL LUMINOSITY FUNCTIONS
In this section, we compute model luminosity functions at different redshifts and compare them with the observed quasar luminosity function. Figure 2 shows the observed luminosity function atz¼0:1, 1.0, 2.3, 3.0, 4.0,z4:3, and
z6:0. Belowz4:3, the data points shown are from the summary by Pei (1995; based on the compilations of Hartwick & Schade 1990). The gray lines at redshifts below 2 are fits to the empirical 2dF luminosity function of Boyle et al. (2000; we plot their q0¼0:5 polynomial evolution
model corrected for cosmology). We also show the best-fit empirical luminosity function at z4:3 from Fan et al. (2001a) with a vertical bar to denote the quoted error in the normalization. Atz6, the space density was inferred from Fan et al. (2001b), and the error bar includes uncertainty in the spectral index. Comparisons of this data with the halo merger rate model (x4.1) and the HL98 model (x4.2) are presented below.
4.1. The Merger Rate Model
[image:5.612.45.294.216.354.2]Luminosity functions calculated from the halo merger rate model described inx2.2 are plotted as the solid lines in Figure 2 at redshiftsz¼0:1, 1.0, 2.3, 3.0, 4.0,z4:3 and
z6:0. In addition, the lower right panel shows predicted luminosity functions at z¼8:0 and z¼10:0. Values of
0¼105:4,¼5, andtdc;0¼106:3yr yield a good fit to the
data at allze2. The parameters in the black hole–halo mass relation bear a striking resemblance to those in the relation found by Ferrarese (2002) for the local universe, which, in our notation, correspond to0¼105:1and¼4:71.
The value oftdc;0 is related to the duty cycle for different
quasar luminosities and redshifts through equation (19). The duty cycle is plotted in Figure 3. For a given halo mass,
tdc is longer at higher redshift. Steidel et al. (2002) inferred
the lifetime of bright quasar activity in a large statistical sample of Lyman break galaxies at z3 to be 107 yr,
which is surprisingly close to our expected value of
tdc ¼106:9yr. Abovez3, we findtdc107yr, comparable
to the value inferred by comparing the local black hole den-sity with the quasar luminoden-sity function (e.g., Yu & Trem-aine 2002) or by comparing the clustering properties of the 2dF quasars with a model combining the formation and evolution of quasars withN-body simulations (Kauffmann & Haehnelt 2002). Note that whiletdcbecomes a substantial
fraction of the age of the universe at the highest redshifts considered, individual episodes of quasar activity are shorter thantdc;0, which is an order of magnitude smaller.
Two results from the comparison between model and data stand out. First, the halo merger model reproduces the shallow slope for thez4:3 quasars observed by Fan et al. (2001a) and the space density of quasars at z6:0 mea-sured by Fan et al. (2001b). A detailed comparison between the data and the model atz4:3 is shown in Figure 4. The left-hand panel shows the luminosity function in the region measured by Fan et al. (2001a). The straight line with the
error bar represents the empirical luminosity function (best-fit slope of¼ 2:58) and the uncertainty in its normaliza-tion. The upper solid line is the luminosity function of the merger rate model. The theoretical luminosity function slope is consistent with that of the observed quasars over the measured luminosity range. This is shown more clearly on the right hand panel of Figure 4, where the derivative of
Fig.2.—Comparison of the observed and model rest-frameB-band luminosity functions. The data points atzd4 are summarized in Pei (1995). The gray lines in the lowest redshift panel are fits to the empirical 2dF luminosity function (Boyle et al. 2000). Atz4:3 andz6:0, the data are from Fan et al. (2001a, 2001b). Panelz4:3: Best-fit slope of2.58 measured by Fan et al. (2001a;diagonal line) and the quoted uncertainty in the normalization (vertical bar). In the lowest-redshift panel, the dashed line represents the merger model luminosity function atz0:1.Dotted lines: HL98 model (¼103:1,
tdc;0¼105:0yr).Solid lines: Merger model described in this paper (0¼105:4,¼5,tdc;0¼106:3yr).
Fig.3.—Duty cycle time (tdc) of quasars with luminosityLBcalculated
from eq. (19) at redshiftsz¼0:1, 1.0, 2.3, 3.0, 4.0, 4.3, 6.0, 8.0, and 10.0 (bottom to top).Thick line: Value atz¼3:0, which should be compared with107yr estimated by Steidel et al. (2002). The duty cycle was
calcul-ated using our best-fit value oftdc;0¼106:3yr per merger.
the model luminosity function is shown in comparison with the empirical best-fit slope (solid line) and the slope 1
away (dashed lines). The model is consistent within the quoted uncertainty over the whole measured luminosity range. Our model luminosity function is consistent with the observed lower limit on the slope atz¼6:0, which Fan et al. (2000b) quote ash<3:9 (95%). However, the
gravita-tional lensing rate may be very high in this sample (Wyithe & Loeb 2002a, 2002b). While the average slope of the lumi-nosity function cannot be changed significantly by lensing, we might easily be misled by the magnification of one or two quasars in the limited current sample of four. Furthermore, lensing might increase the apparent space density of quasars by a factor of up to 2 (Wyithe & Loeb 2002b). The predicted luminosity functions show that the slope of the bright end becomes significantly steeper at redshifts higher thanz6, as expected from the shape of the Press-Schechter (1974) mass function.
The fit to the luminosity function discussed above has ¼5. However, we find some degeneracy betweenand0.
An equally good fit to the luminosity function can be obtained for¼4 and0¼104:5. However, this value of
o is nearly an order of magnitude larger than observed
(Ferrarese 2002), and the implied duty cycle is nearly an order of magnitude too small (Yu & Tremaine 2002; Steidel et al. 2002). On the other hand, the observed values of ¼4:71 and ¼105:1 (Ferrarese 2002) also provide an
excellent fit and a duty cycle consistent with 107yr. Hence,
the complete set of observational constraints favors a larger value of. The degeneracy between the ratio of black hole to dark matter halo mass and the quasar lifetime was previ-ously pointed out by Haenhelt, Natarayan, & Rees (1998). Using a model similar to that employed by HL98, they found that a quasar duty cycle of 107 yr implies 5.
Their conclusion was based on the quasar luminosity func-tion atz3. In this paper, we have found that the require-ment of 5 extends to the explanation of the space density of the highest redshift quasars known. Haenhelt, Natarayan, & Rees (1998) suggested that the mass of central black holes may be regulated by feedback, which also implies ¼5. We return to discussion of this point inx6.
Ferrarese & Merritt (2000) find a relation betweenMbhand
bulge velocity dispersion b of Mbh/4:72B 0:36, while
Tremaine et al. (2002, and references therein) find
Mbh/4:02b 0:32. Tremaine et al. (2002) attribute this
dis-agreement primarily to the differences in the velocity disper-sion measurements used by the two groups. Unfortunately, the highly uncertain nonlinear scaling of vc/0:88b 0:17
(Ferrarese 2002) allows the results of both groups to be con-sistent with our favored value of5 (which in turn trans-lates to a mean slope ofMbh/4:4b , in between the slopes of
the two groups).
Due to its dependence on the exponential tail of the Press-Schechter mass function, the model luminosity function is very sensitive to the value of8. We have experimented by
varying8after fixing¼105:1and¼4:71 (local values
from Ferrarese 2002). Values of8<0:7 result in
logarith-mic slopes at z4:3 that are significantly steeper than observed, space densities at z6 that are smaller than observed, and duty cycles larger than 107.5yr. Similarly,
val-ues of8>1:0 result in logarithmic slopes atz4:3 that
are significantly shallower than observed, quasar space den-sities atz6 that are larger than observed, and duty cycles smaller than 106.2yr. Similar results are obtained if values of
¼105:4 and ¼5 are assumed. Thus, the high-redshift
quasar luminosity function suggests 0:7d8d1:0:
The upper left hand panel of Figure 2 indicates that the model luminosity function provides a poorer fit to the data at redshifts zd2. The density of relatively faint (LBd1013 Latz1:0 andLBd1012 Latz0:1 [dashed lines]) quasars is reasonably reproduced, particularly at the lowest redshift considered. The model also predicts a decline in the number of bright quasars at low redshifts. On the other hand, the slope of the model luminosity function is too shallow at the higher luminosities to explain the data. A simple observational explanation for this phenomenon might be the large drop in the average cosmic density of cold galactic gas from z2–3 to the present day (Storrie-Lombardi, McMahon, & Irwin 1996). Furthermore, the inability of the gas to cool following the epoch of group and X-ray cluster formation would also contribute to the rapid decline in the luminosity function at low redshifts (Cavaliere
Fig.4.—Detailed comparison of the observed rest-frameB-band quasar luminosity function with the models atz4:3.Left panel: Luminosity function in
the region measured by Fan et al. (2001a).Straight line with the error bar: Empirical luminosity function (best-fit slope of¼ 2:58) and the quoted uncertainty in the normalization.Upper solid and dotted lines: Luminosity functions for the halo merger model (0¼105:4,¼5,tdc;0¼106:3yr) and for the
HL98 model (¼103:1,t
dc;0¼105:0yr), respectively.Right panel: Logarithmic derivatives of the model luminosity functions.Solid and dotted lines: Our
model and the HL98 model, respectively. The empirical best-fit slope (solid line) and the slopes 1¼ 0:23 away (dashed line) are shown for comparison.
& Vittorini 2000). Thus, while the merger rate predicts a decrease in the space density of quasars at low redshifts, the more complicated low-redshift environments require addi-tional modeling (e.g., Kauffmann & Haehnelt 2000) to reproduce the observed luminosity function shape.
4.2. The Halo Formation Model
We find that the HL98 model (x 2.1) requires3 best-fit
values of¼103:1andt
dc;0¼105:0yr. The resulting
lumi-nosity function is shown as the dotted lines in Figures 2 and 4. The HL98 model and the halo merger model produce sim-ilar luminosity functions at ze2. However, the predicted duty cycle is too low by 2 orders of magnitude and the value ofproduced by this fit is too high by 2 orders of magnitude to be consistent with observations.
Figures 4 and 5 indicate that the HL98 model produces a somewhat less consistent normalization at z4:3 and a steeper slope at z6:0 when compared with the halo merger model. At low redshifts, the merger rate is higher than the collapse rate for halos in the mass range of interest. In fact, the derivative of the Press-Schechter (1974) mass function becomes negative and thus no longer approximates the halo formation rate. At low redshifts, the model predicts a luminosity function with a sharp lower cutoff in luminos-ity [in the implementation of HL98 the smooth function,
fðtÞ, results in a softer cutoff]. This is seen in the upper left panel of Figure 2.
5. RATES OF MULTIPLE-IMAGE LENSING
The fraction of quasars that are gravitationally lensed by foreground galaxies is very sensitive to the underlying lumi-nosity function due to the potentially large magnification bias (Turner 1980; Turner, Ostriker, & Gott 1984). At low redshifts (zd3), the bright end of the luminosity function has a universal slope of3.43. However, atz4:3, Fan et
al. (2001a) observed a slope of 2.58. Wyithe & Loeb (2002a, 2002b) showed that empirical extrapolations of the low-redshift quasar luminosity function to high redshifts yielded very different results for the gravitational lensing rate if one were to adopt a bright end slope that is3.43 at all redshifts or a slope that is2.58 abovez3. Since the halo merger model described in x2.2 reproduces all mea-sured properties of the quasar luminosity function at high redshifts, we use it to compute the magnification bias for multiple-image gravitational lenses. The magnification bias can then be used to find the fraction of all quasars (at differ-ent redshifts) that are multiply imaged. The lensing fraction for the SDSS high-redshift samples was discussed at length in Wyithe & Loeb (2002a, 2002b). We therefore give only a short summary here and present results for the lens fraction obtained with the new luminosity function.
The probability distribution of point-source magnifica-tion by a singular, spherical isothermal lens in terms of the sum of the magnifications of multiple images, l, is
ðdP=dlÞ ¼8=l3 for l>2. The bias factor for multiple
imaging in a flux-limited sample brighter than (absolute luminosity)LB;limis therefore
BðzÞ ¼
R1
2 dl½8=ð Þl3 R1
LB;lim=ldL
0ðL0;zÞ
R1
LB;limdL
0ðL0;zÞ : ð21Þ
This magnification bias is plotted as a function of the limit-ing (absolute) luminosity in Figure 6. Biases at redshifts of
z¼2:3,z¼4:3, and z¼6:0 are shown as well as predic-tions for z8:0 and z10:0 (bottom to top). The bias becomes very large at high redshifts and for bright limiting magnitudes.
The resulting fraction of multiple images expected in the flux-limited sample is
FðLB;lim;zÞ
Bmult
Bmultþ ð1multÞ
: ð22Þ
In this expression,multis the multiple image optical depth,
i.e., the source plane probability that a source will be multi-ply imaged for the observer. From Wyithe & Loeb (2002b), we findmult¼0:0040 for the SDSS quasars atz4:3 and
Fig.5.—Detailed comparison of the observed rest-frameB-band quasar luminosity function with the models atz6:0.Left panel: Space density of quasars measured by Fan et al. (2001b).Solid and dotted lines: Luminosity functions for the halo merger model (0¼105:4,¼5,tdc;0¼106:3yr) and for the HL98
model (¼103:1,t
dc;0¼105:0yr), respectively.Right panel: Logarithmic derivatives of the model luminosity functions. The empirical lower limit (95%) is
shown for comparison.
3HL98 quote t
dc;0¼105:8 yr, larger than our value of t0¼105.
Haehnelt, Natarajan, & Rees (1998) also found a lower valuetdc;0in their
model with constant.
mult¼0:0059 for the SDSS quasars atz6. In addition,
we find mult¼0:0020, mult¼0:0076, and mult¼0:0091
(considering all galaxies as potential lenses) at z¼2:3,
z¼8:0, and z¼10:0, respectively. The lens fraction
FðLB;lim;zÞis plotted in the right-hand panel of Figure 6 for
z¼2:3, 4.3, 6.0, 8.0, and 10.0 (bottom to top). While at low redshifts the lensing fraction is less than 1%, at higher red-shifts, the fraction could be much higher. The vertical dashed lines correspond to the limiting absolute luminosi-ties of the SDSS quasar samples atz4:3 (left) andz6 (right). These limits suggest lens fractions of 2% in the SDSS sample at z4:3 and 8% in the SDSS sample at
ze5:7. Note that the fractions at z4:3 and z6:0 are consistent with the value obtained for the flat luminosity function assumed in Wyithe & Loeb (2002b). At even higher redshifts, the lens fraction approaches unity. The luminosity function atz10 predicts that quasars having luminosities brighter than a limit that corresponds to the same comoving space density as the SDSS quasars at z6:0 have a lens fraction ofF 0:5.
6. SUMMARY AND DISCUSSION
We predict the quasar luminosity function under the hypothesis that quasar activity is associated with galaxy mergers. Galactic halos are assumed to each host a black hole having a mass determined from a power-law relation with halo circular velocity, Mbh/vc. Upon merger, we
assume that the gas from the accreted halo is driven to the center and that the quasar then shines at its Eddington rate for a short period of time, proportional to the (smaller than one-half) mass ratio between the small and final halos in the merger. Our model has three free parameters but at least the following five constraints: the luminosity function slope and normalization at z2:5, the evolutions of the luminosity function slope and normalization, and the curvature of the luminosity function. Our model is simplified by the fact that the effect of reionization on the luminosity function is limited to luminosities much fainter than those detectable in current quasar surveys.
This very simple model reproduces all known properties of the luminosity function above z2, including the recently measured luminosity function slope atz4:3 (Fan et al. 2001a) and the space density of quasars at z6:0 (Fan et al. 2001b). The model suggests a black hole-halo mass relationMbh/v5c, consistent with that found by
Fer-rarese (2002) atz¼0, and a duty cycle of107yr,
consis-tent with previous determinations (Yu & Tremaine 2002; Steidel et al. 2002). An acceptable fit to all of these con-straints requires 0:7d8d1:0. Using the derived luminosity
function, we predict the resulting lensing rates for the high-est redshift samples. The recently published flux-limited samples of SDSS quasars atz4:3 andze5:7 are predicted to have multiple image fractions of 2% and 8%, respectively.
The model luminosity function computed using the halo merger rates is consistent with the density of faint quasars at low redshifts and predicts a decline in the density of bright quasars toward low redshifts but predicts a luminosity func-tion slope that is shallower than observed. As has been noted previously, a more careful analysis (e.g., Kauffmann & Haehnelt 2000) is required to understand the evolution of the quasar luminosity function at low redshifts.
TheMbh-vcrelation that provides the best fit to the data
may also have a simple physical origin. First, consider dimensional analysis. If we make the minimal assumption that the limiting luminosity of a quasar is only a function of the halo circular velocity vc, then the only dimensional
parameters in the problem are vc and G (Newton’s
con-stant). The only combination of these parameters that has dimensions of luminosity isv5c=G, and so we conclude
LEdd/
v5
c
G : ð23Þ
What is the physics behind this relation?The value ofv5
c=G
amounts to depositing the entire binding energy of a self-gravitating system during its dynamical time (so that it does not have time to adjust). The binding energy of a self-gravi-tating massMisMv2
c, and the dynamical time isr=vc.
The ratio between these quantities is Mv3c=r. Using the
virial relationGM=rv2, we get the energy deposition rate
Fig.6.—Left:Magnification bias as a function of absolute luminosity limit for flux limited samples of quasars atz¼2:3, 4.3, 6.0, 8.0, and 10.0 (bottom to
top).Right:Multiple-image lensing rate for flux limited samples of quasars atz¼2:3, 4.3, 6.0, 8.0, and 10.0 (bottom to top).Left and right vertical dashed lines: Absolute flux limit of the SDSS samples atz4:3 andz6:0, respectively.
that would unbind a self-gravitating system on its dynami-cal time,v5
c=G. A quasar may therefore unbind the gas in
the galaxy around it4if its power output is too large5(Silk &
Rees 1998; Ciotti & Ostriker 2001). As the mass of the black hole increases and the quasar’s Eddington luminosity approaches this limit, the feedback will generate a powerful galactic wind and terminate the accretion that feeds the qua-sar. Hence, the quasar phenomenon may be self-terminating (similarly to the formation of a protostar). Of course, if some of the quasar energy escapes (due to incomplete absorption, partial covering factor, or efficient cooling by the surrounding gas), then the feedback-limited quasar luminosity would be higher thanv5
c=G. As long as the
feed-back from all quasars encounters self-similar conditions in different halos, we may write
LEdd¼
v5c
G ; ð24Þ
where is a constant that is related to the inferred value
of 0. Equations (10), (11), and (24) and the best-fit
value of 0105:4, together with the relation
LEdd¼1:41038ðMbh=MÞergs s1, yield 30. We
have shown that the assumption of a constantin equation
(24) leads to a luminosity function that describes the data over a wide range of redshifts. The constancy of(which is
also expected from dimensional analysis) implies that feed-back may indeed be the mechanism that regulates the growth of supermassive black holes in galactic potential wells. The similarity between our deduced values of¼5 and0¼105:4at high redshifts and the values inferred for
remnant black holes in the local universe (Ferrarese 2002; Tremaine et al. 2002) provides a strong testimony to this effect.
We thank the anonymous referee for several suggestions that improved the results of the paper. This work was sup-ported in part by NSF grants 9900877 and AST-0071019 (for A. L). J. S. B. W. is supported by a Hubble Fel-lowship grant from the Space Telescope Science Institute, which is operated by the Association of Universities for Research in Astronomy, Inc., under NASA contract NAS 5-26555.
REFERENCES Bardeen, J. M., Bond, J. R., Kaiser, N., & Szalay, A. S. 1986, ApJ, 304, 15
Barkana, R., & Loeb, A. 2001, Phys. Rep., 349, 125
Bond, J. R., Cole, S., Efstathiou, G., & Kaiser, N. 1991, ApJ, 379, 440 Boyle, B. J., Shanks, T., Croom, S. M., Smith, R. J., Miller, L., Loaring,
N., & Heymans, C. 2000, MNRAS, 317, 1014
Boyle, B. J., Shanks, T., & Peterson, B. A. 1988, MNRAS, 235, 935 Carlberg, R. G. 1990, ApJ, 350, 505
Cavaliere, A., & Vittorini, V. 2000, ApJ, 543, 599 Ciotti, L., & Ostriker, J. P. 2001, ApJ, 551, 131 Efstathiou, G., & Rees, M. J. 1988, MNRAS, 230, 5 Elvis, M., et al. 1994, ApJS, 95, 1
Fan, X., et al. 2001a, AJ, 121, 54 ———. 2001b, AJ, 122, 2833 Ferrarese, L. 2002, ApJ, 578, 90
Ferrarese, L., & Merritt, D. 2000, ApJ, 539, L9
Fukugita, M., Ichikawa, T., Gunn, J. E., Doi, M., Shimasaku, K., & Schneider, D. P.. 1996, AJ, 111, 1748
Furlanetto, S. R., & Loeb, A. 2001, ApJ, 556, 619 Gunn, J. E., et al. 1998, AJ, 116, 3040
Haehnelt, M. G., Natarajan, P., & Rees, M. J. 1998, MNRAS, 300, 817 Haehnelt, M. G., & Rees, M. J. 1993, MNRAS, 263, 168
Haiman, Z., & Loeb, A. 1998, ApJ, 503, 505 (HL98) Haiman, Z., Madau, P., & Loeb, A. 1998, ApJ, 514, 535 Hartwick, F. D. A., & Schade, D. 1990, ARA&A, 28, 437 Hernquist, L., & Mihos, J. C. 1995, ApJ, 448, 41 Kauffmann, G., & Haehnelt, M. 2000, MNRAS, 311, 576
Kauffmann, G., & Haehnelt, M. 2002, MNRAS, 332, 529
Kennefick, J. D., Djorgovski, S. G., & de Carvalho, R. R. 1995, AJ, 110, 2553
Lacey, C., & Cole, S. 1993, MNRAS, 262, 627
Medvigy, D., & Loeb, A. 2002, ApJ, submitted (astro-ph/0110014) Mihos, J. C., & Hernquist, L. 1994, ApJ, 431, L9
Pei, Y. C. 1995, ApJ, 438, 623
Press, W. H., & Schechter, P. 1974, ApJ, 187, 425
Schmidt, M., Schneider, D. P., & Gunn, J. E. 1995, AJ, 110, 68 Schneider, D. P., et al. 2001, AJ, 121, 1232
Sheth, R. K., & Tormen, G. 1999, MNRAS, 308, 119 Silk, J., & Rees, M. J. 1998, A&A, 331, L1
Small, T. A., & Blandford, R. D. 1992, MNRAS, 259, 725
Steidel, C. C., Hunt, M. P., Shapley, A. E., Adelberger, K. L., Pettini, M., Dickinson, M., & Giavalisco, M. 2002, ApJ, 576, 653
Storrie-Lombardi, L. J., MacMahon, R. G., & Irwin, M. J. 1996, MNRAS, 283, 79
Tremaine, S., et al. 2002, preprint (astro-ph/0203468) Turner, E. L. 1980, ApJ, 242, L135
Turner, E. L., Ostriker, J. P., & Gott, J. R., III. 1984, ApJ, 284, 1 Warren, S. J., Hewett, P. C., & Osmer, P. S. 1994, ApJ, 421, 412 Wyithe, J. S. B., & Loeb, A. 2002a, Nature, 417, 923
———. 2002b, ApJ, 577, 57
York, D. G., et al. 2000, AJ, 120, 1579 Yu, Q., & Tremaine, S. 2002, MNRAS, 335, 965
5Note that the power output from the quasar may include both
radia-tion and mechanical energy. Substantial outflows are inferred to exist in broad absorption line quasars and radio galaxies (see recent summary in Furlanetto & Loeb 2001 and references therein).
4We implicitly assume that the central region of the galaxy (such as the
protobulge) is characterized by a circular velocity similar to that of the galactic halo, even though it is dominated by baryons. This assumption follows naturally from the nearly flat rotation curves of nearby galaxies.