This is a repository copy of
Solution composition and particle size effects on the
dissolution and solubility of a ThO2 microstructural analogue for UO2 matrix of nuclear
fuel
.
White Rose Research Online URL for this paper:
http://eprints.whiterose.ac.uk/98057/
Version: Accepted Version
Article:
Myllykyla, E., Lavonen, T., Stennett, M. et al. (3 more authors) (2015) Solution composition
and particle size effects on the dissolution and solubility of a ThO2 microstructural
analogue for UO2 matrix of nuclear fuel. Radiochimica Acta, 103 (8). pp. 565-576. ISSN
0033-8230
https://doi.org/10.1515/ract-2014-2271
[email protected] Reuse
Unless indicated otherwise, fulltext items are protected by copyright with all rights reserved. The copyright exception in section 29 of the Copyright, Designs and Patents Act 1988 allows the making of a single copy solely for the purpose of non-commercial research or private study within the limits of fair dealing. The publisher or other rights-holder may allow further reproduction and re-use of this version - refer to the White Rose Research Online record for this item. Where records identify the publisher as the copyright holder, users can verify any specific terms of use on the publisher’s website.
Takedown
If you consider content in White Rose Research Online to be in breach of UK law, please notify us by
1
Solution composition and particle size effects on the dissolution
2
and solubility of a ThO2 microstructural analogue for UO2 matrix
3
of nuclear fuel
4
Solution composition and particle size effects on the dissolution and
5
solubility of a ThO
2
microstructural analogue for UO
2
matrix of
6
nuclear fuel
7
E.Myllykylä1, T.Lavonen1 , M. Stennett2 , C.Corkhill2, K.Ollila1 , N. Hyatt2 8
1
VTT Technical Research Centre of Finland, Espoo, Finland
9
2
Immobilisation Science Laboratory, Department of Materials Science and Engineering, The Unversity of Sheffield, Mappin Street, 10
Sheffield, S1 3JD,UK
11
Abstract
12 13
The objective of this study was to investigate the disso-14
lution rate of ThO2 which was synthesised to approximate,
15
as closely as possible, the microstructure of UO2 in a
nucle-16
ar fuel matrix. The optimal sintering temperature for ThO2
17
pellets was found to be 1750°C, which produced pellets 18
with a microstructure similar to UO2 nuclear fuel pellets,
19
with randomly oriented grains ranging in size from 10 to 30 20
µm. Dissolution was conducted using ThO2 particles of
21
different size fractions (80 to 160 µm and 2 to 4 mm) in the 22
presence and absence of carbonate in solutions with pH 23
from 2 to 8. Dissolution rates were calculated from Th 24
released from the solid phase to solution. Particles of ThO2
25
were also leached with 1 M HNO3 at 80 °C in order to
in-26
vestigate the morphological changes at the particle surfaces. 27
The concentration of Th was found to be ≥ 10-9 mol/L at pH 28
≤ 4, lower than the theoretical solubility of crystalline ThO2.
29
At higher pH values, from 4 to 8, the measured concentra-30
tions (10-10 to 10-12 mol/L) were between the theoretical 31
solubility of ThO2 and Th(OH)4. Grain boundaries were
32
shown to exert an influence on the dissolution of ThO2
33
particles. Using high resolution aqueous solution analysis, 34
these data presented here extend the current understanding 35
of Th solubility in solution. 36
37
1. Introduction
38
Thorium dioxide (ThO2) is isostructural to UO2, sharing the
39
same fluorite-type structure (space group Fm3m), making it 40
a useful structural analogue for spent nuclear fuel, which is 41
predominantly composed of UO2 (>95%). However, unlike
42
U(IV)O2, Th(IV)O2 is not redox active since Th has only one
43
prevailing oxidation state, +4 [1]. The next generation ap-44
thorium [2]. As a fuel, thorium has many beneficial proper-46
ties, such as high fusion temperature, good sintering capa-47
bility, resistance against radiation damage, greater abun-48
dance in the Earth’s crust compared to U, and the possibi l-49
ity for transmutation [2]. 50
The preferred option worldwide for the long-term dis-51
posal of spent nuclear fuel, and potentially future Th-based 52
nuclear fuels, is disposal in a deep geological disposal facil-53
ity, several hundreds of metres below ground [3-4]. In this 54
environment, the release of Th and other radionuclides to 55
the geo- and bio-spheres will be controlled by the dissolu-56
tion of the fuel by groundwater. Hence it is necessary to 57
understand the dissolution behaviour of the fuel and the 58
solubility of radionuclides in groundwater. 59
60
In the literature, the solubility values for ThO2, and also the
61
hydrolysis constants of thorium, show great discrepancies 62
e.g. Vandenborre et al. 2008, 2010 Neck and Kim, 2001 [5-63
7]. The main reasons for these differences include: the 64
tendency of Th to undergo polynucleation and colloid for-65
mation, its strong absorption to surfaces, and the low solu-66
bility of Th4+ hydroxide and hydrous oxide. The presence of 67
complexing ligands like CO32- [8] has also been shown to
68
increase the solubility of ThO2. These characteristics of
69
thorium together with the relatively low solubility of 70
ThO2(cr) make solubility studies of ThO2 challenging.
71 72
The solubility product values have been observed to vary 73
between ThO2 (microcryst.) (log K°sp = -53 ± 0.5) and
74
Th(OH)4 (am) (log K°sp = - 46.7 ± 0.9) [9-11] depending
75
on the crystallinity and crystallite size of the Th(IV) oxide 76
and hydroxide or oxyhydroxide phase. The predicted value, 77
according to the Equation of Schindler [12] and experi-78
mental data, for ThO2 (cr) is log K°sp = -54.2 ± 1.1 [9]. In
79
addition to crystallinity, surface phenomena have been 80
mentioned as a possible factor affecting the solubility prop-81
erties. Vanderborre et al. 2010 [6] combined investigation 82
of solid surfaces with leaching experiments, and isotopic 83
exchange methods to understand the discrepancy in solubil-84
ity values and to describe the reversibility in the exchange 85
mechanism. They observed that the dissolution mainly 86
occurred at grain boundaries and showed variation between 87
different sites, indicating “local solubility” effects. In add i-88
tion, the usage of 229Th spiking revealed dynamic dissolu-89
tion/precipitation reactions on the solid/solution interface. 90
91
Many solubility studies have been conducted with amor-92
phous phases of ThO2 [13-17]. The higher solubility of
93
amorphous-phase ThO2, compared to well-crystalline ThO2,
94
simplifies the analysis of Th in liquid phase, because the 95
amorphous phases have higher solubility. Crystalline phas-96
es of ThO2 have also been studied [18-19]. Hubert et al.
97
[18] observed the effect of surface properties on the leachi-98
bility of solid ThO2. Factors including specific surface area,
99
surface state and size of aggregates were found to have 100
influence on the apparent solubility. However, when the 101
leaching rate was normalized to surface area, it seemed to 102
be independent of the surface charazteristics. 103
The aims of this study were to prepare crystalline ThO2
105
pellets having a microstucture similar to that of spent UO2
106
nuclear fuel pellets and to conduct dissolution experiments, 107
in order to further evalauate the relative solubility of ThO2
108
phases. We report the initial release rate of Th during the 109
first 20 to 40 days of dissolution. Solubility studies were 110
extended to 100 to 120 days to gain a thorough understand-111
ing of the solubility limit of different ThO2 phases.
112
The first experiment series in the solubility and dissolution 113
rate studies was conducted with 2 to 4 mm particles in 114
0.1 M NaCl and 0.01 M NaCl (with 2 mM NaHCO3)
solu-115
tions under atmospheric conditions. The second experiment 116
series was conducted with two particle sizes, 60 to 180 m 117
and 2 to 4 mm, in 0.1 M NaCl and 0.01 M HNO3 solutions
118
in an Ar glove box to exclude atmospheric carbon. In addi-119
tion, several leaching experiments were run in 1 M HNO3
120
solution and at 80 °C in order to observe surface changes 121
during dissolution in a relatively short time scale. 122
2. Experimental
123
2.1 Preparation of ThO
2pellets
124
Thorium dioxide pellets were prepared to approximate the 125
microstructure of UO2 fuel and CeO2 analogues for UO2
126
[19-21], with grain sizes in the range of 5 – 30 m, with 127
randomgrystallographic orientation. The precursor material 128
was ThO2 powder (BDH (British Drug House) Laboratory
129
Reagents Ltd., Lot No: G83757/541012), which was con-130
firmed as pure ThO2 by powder X-ray Diffraction using
131
STOE Cu-IP diffractometer, with a Cu k source (d iffrac-132
tion patterns were collected at 5 < 2 < 60° at 2° min-1, 133
using a step size of 0.02°). 1g of ThO2 powder was placed 134
within a 10 mm diameter hardened stainless steel die and 135
uniaxially pressed with a load of 100 MPa. The green den-136
sity (i.e. compacted density) of the pressed compacts was 137
calculated prior to sintering by measuring the pellet mass 138
and geometry. Green ThO2 pellets, placed on stabilised
139
zirconia setter plates, were sintered in triplicate for 4 hours 140
at temperatures between 1300 and 1750 °C in a standard air 141
atmosphere muffle furnace. Pellets were heated and cooled 142
with a ramp rate of 5 °C min-1 and held at the sintering 143
temperature for 4 hours. 144
145
The sintered density of the pellets was measured using 146
geometric and water immersion (Archimedes) methods. All 147
density measurements were performed in triplicate. 148
149
For surface analysis only (i.e. not dissolution experiments) 150
ThO2 pellet samples were polished to a 1µm finish using
151
SiC paper and diamond paste. A final mechanico-chemical 152
etch was performed using a 0.06 m colloidal silica sol u-153
tion. In order to develop a grain boundary texture at the 154
surface of the pellets, annealing was performed at 90 % of 155
the sintering temperature, at a ramp rate of 5°C min-1 and 156
held at the annealing temperature for 1 hour. Pellets were 157
tallographic orientation and grain size distribution of pellets 159
was performed using Electron Backscatter Diffraction 160
Analysis (EBSD) (Oxford Instruments) in conjunction with 161
a Sirion Field Emission SEM. EBSD maps of 100 m2 were
162
obtained at an accelerating voltage of 20 kV and a 0.5 m 163
step size. Grain orientation analysis was performed on > 164
10000 grains, using HK Channel 5 software (Oxford In-165
struments). 166
2.2 Fragmentation of the pellets
167
For the experiments, the ThO2 pellets were crushed using a
168
percussion mortar. Particles between 2 and 4 mm were 169
selected with tweezers and washed four times in isopropa-170
nol followed by gravitational settling in an attempt to re-171
move adhering fine fragments. This was not successful, so 172
the particles were soaked one at a time on isopropanol fol-173
lowed by ethanol and then dried in a desiccators. 174
175
The intact pellets of ThO2 (~ 20 g) were fragmented to
176
smaller particle sizes. In order to avoid contamination by 177
the milling media, the electrodynamic fragmentation 178
method [22-23] was selected to comminute the pellets into 179
the required particle sizes. The principles of the method 180
can be briefly described, as follows: Electrical energy in 181
the form of repeated high voltage pulses is applied to the 182
samples immersed in a dielectric process liquid. Dielectric 183
liquids, like water, have a high dielectric strength, when 184
the voltage rise time is kept below 500 ns. As such, the 185
discharges are forced to occur through the immersed ma-186
terial. Plasma channels and explosions were generated 187
inside the pellets and the resulting shockwaves produced 188
fracturing and physical breakdown. 189
190
Fragmentation was conducted using a batch scale selFrag 191
instrument available at the Research Laboratory of the 192
Geological Survey of Finland. 193
194
The commercialized 1.7 tons instrument designed for the 195
c.a. 1 kg sample was used. Approximately 20 grams of 196
ThO2 pellets were subjected to a two stage treatment. The
197
process liquid used was regular tap water. After the first 198
fragmentation the sample was classified using 0.2 mm net 199
sieve, and the remaining oversized fraction (ca. 14 g) was 200
re-fragmented. The process parameters used for both the 201
first and second fragmentation procedure were: number of 202
pulses 400, e-gap 10mm, freq. 3 and voltage 120-140 kV. 203
204
The fragmented material was washed using tap water and 205
any iron contamination from the electrode was removed 206
using hand magnets. The final product for use in dissolution 207
experiments was sieved to a particle size fraction of 80 to 208
160 µm. 209
2.3 Dissolution experiments
210
The first experiment series of solubility and dissolution rate 211
studies were conducted with 2 to 4 mm particles in 0.1 M 212
NaCl and 0.01 M NaCl (with 2 mM NaHCO3) solutions
213
from suprapure (99.99%, Merck) NaCl and NaHCO3
215
(ACS,Reag.Ph Eur, Merck KGaA) in MilliQ-water). Exper-216
iments were conducted in triplicate at room temperature 217
(23 ± 1 °C) for up to 115 days. Approximately 300 mg of 218
crushed ThO2 particles were placed in a 60 ml high density
219
polypropylene vessel with 50 ml of leaching solution. The 220
second experiment series was conducted with two particle 221
sizes (60 to 180 m and 2 to 4 mm), both in 0.1 M NaCl 222
and 0.01 M HNO3 (prepared from concentrated HNO3,
223
ULTREX II by J.T Baker) within an Ar glove box at 224
25 ± 1 °C. The duration of these experiments, conducted in 225
duplicate, was 93 days. Approximately 150 mg of particles 226
were placed in a 60 ml vessel with 50 ml of leaching solu-227
tion. Polypropylene vessels were used for experiments with 228
0.01M HNO3, and high density perfluoroalkoxy Teflon
229
vessels were used for 0.01M NaCl solutions, in order to 230
decrease the potential sorption of Th to the reaction vessel 231
under near neutral conditions. 232
233
In the first experiment series, conducted under atmospheric 234
conditions, sampling was performed at 0, 1, 3, 6, 15, 24, 31 235
41, 48, 79, 100 and 115 days by withdrawing a 2.5 ml sam-236
ple. Each sample was ultrafiltered with a Pall Mall filtration 237
device with 10 kD (~1 nm) molecular cut off, using centrif-238
ugation (6000 rpm, 1 h). In addition, some samples were 239
taken and not filtered. The pH was measured directly from 240
the test solution with ROSS combination electrode at the 241
beginning of the experiment and after 35 days of reaction 242
time. 243
244
Sampling of the experiment series under an Ar atmosphere 245
was conducted at 0, 1, 2, 5, 7, 9, 14, 21, 30, 43, 57, 70 and 246
89 days. Both non-filtered and ultrafiltered samples (as 247
above) of 2.5 ml were taken. The pH was measured in solu-248
tions under Ar glovebox conditions using a ROSS combina-249
tion electrode, directly from the reaction vessel within eve-250
ry second sampling. 251
252
The concentration of 232Th in non-filtered and ultrafiltered 253
samples was analysed with a High Resolution sector Field 254
Inductively Coupled Plasma-Mass Spectrometer (HR-ICP-255
MS, Element2 by ThermoScientific). Standard solutions 256
with known concentrations were diluted from AccuTraceTM 257
Reference Standard SQS-01. A control sample for analysis 258
was prepared from standard CLMS-1 solution by SPEX. 259
All the blank, standard and control samples contained a 260
known amount of an internal standard, indium. Analyses of 261
232Th were performed with HR-ICP-MS in low resolution
262
mode (R≈ 300). The detection limit for thorium was calc u-263
lated as six times the standard deviation of the ion counts 264
obtained for the sample blanks (ten replicates) , divided by 265
the sensitivity of the 1 µg/L standard solution of Th. The 266
detection limit for thorium was therefore found to be be-267
tween 1·10-12 mol/L and 4·10-12 mol/L depending on the 268
solution matrix and daily efficiency of the instrument. The 269
uncertainty of the Th analyses increased up to 10 % when 270
the measured concentration was close to the detection limit. 271
With higher concentration the uncertainty of the analysis 272
was a few percent. 273
The dissolution rate (r232Th [molg-1s-1]) for ThO2 was
275
calculated by using equation (1) 276
277
(1) 278
where V is the volume of the solution [L], m is the mass [g] 279
of ThO2 and dc/dt is the slope (linear fit) determined from
280
the evolution of 232Th release as function of time [molL-1s1]. 281
This analysis is similar to that applied to consideration of 282
mineral dissolution elsewhere e.g. in Rozalen et al, 2008, 283
Malmström M., 1996, Brady and Walther 1990 [24-26]. 284
285
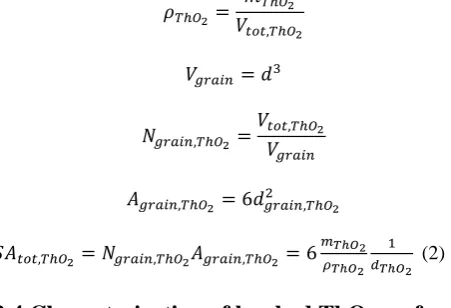
The surface area was calculated by assuming that the ThO2
286
particles are cubes (which is not true as is commonly 287
known see e.g. [27]) and using the measured density of 288
ThO2 approximately 9 g/cm 3
(~93 % of the theoretical 9.86 289
g/cm3) [28]. 290
291
292 293
294 295
(2) 296
2.4 Characterization of leached ThO
2surfaces
297
with SEM
298
The ThO2 particles were subjected to leaching experiments
299
in acidic conditions and at elevated temperatures in order to 300
monitor the evolution of surface morphology during disso-301
lution. For detailed characterisation of the pellet morpholo-302
gy during dissolution, see Corkhill et al. [29]. Surface char-303
acterisation was performed on particles in the 80 to 160 µm 304
size fraction, following particles were used for surface 305
characterization after immersion in a 1 M HNO3 (~ pH 1)
306
solution at 80 °C for 2 and 4 weeks under Ar atmosphere. 307
Prior to heating the reaction vessels were placed in a sealed 308
steel container under Ar atmosphere of the glove box to 309
maintain argon atmosphere. . Surfaces of ThO2 subject to
310
this treatment were studied with SEM (JEOL JSM-900LV 311
with Oxford Instruments) using an accelerating voltage of 312
20 kV and beam size of 10 µm. 313
3. Results and Discussion
314
3.1 The properties of sintered ThO
2pellets
[image:7.595.60.286.265.419.2]315
Figure 1 shows the X-ray diffraction analysis of ThO2
pow-316
er, confirming the purity of the starting material. The char-317
acteristics for a suitable UO2 fuel analogue include a grain
size on the order of 8 – 15 m, a sintered density of 319
> 95.5 % theoretical density, and randomly orientated 320
grains. The sintering temperature was varied in order to 321
determine the optimal sintering conditions to create such 322
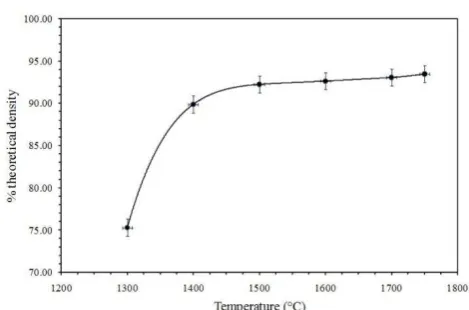
characteristics. Figure 2 shows the densities of the sintered 323
pellets as a function of sintering temperature. 324
[image:8.595.63.288.115.268.2]325
Fig. 1. XRD pattern for thorium dioxide powder used to
synthe-326
sise UO2-fuel analogue pellets for dissolution experiments.
327 328
The density of the pellets increased with increasing sinter-329
ing temperature up to 1750 °C (Fig. 2); this temperature 330
gave a density of 93 % of the theoretical density, which is 331
slightly below optimal for a UO2 analogue. Heating at
332
higher temperatures caused a loss of pellet integrity, there-333
fore 1750°C was the highest sintering temperature evaluat-334
ed. The increase in density with increasing sintering tem-335
perature is consistent with decreasing porosity and increas-336
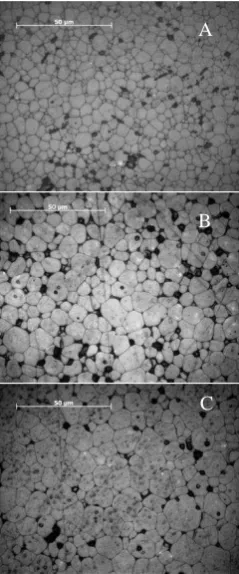
ing grain size, as shown by optical microscope images in 337
Figure 3. The grain size was found to increase from 2 – 10 338
m at 1650 °C to 10 –30 m at 1750°C (Table 1). Sintering 339
at 1750 °C was, therefore, found to give the optimum grain 340
size and density achievable. EBSD analysis was performed 341
to determine grain size and crystallographic orientation. 342
The average grain size was found to be 13 m (based upon 343
analysis of >10000 grains). Figure 4 shows that synthesis at 344
1750°C produced grains that were randomly orientated in 345
the {111}, {100} and {101} crystal planes 346
. 347
348
Fig. 2. Density of the sintered ThO2 as function of sintering
349
temperature.
[image:8.595.59.294.531.686.2]351
352
[image:9.595.57.177.42.330.2]353
Fig. 3. Optical microscopy images of the ThO2 pellet surface
354
sintered at 1600 (A), 1700 (B), and 1750 °C (C).
355
Table 1. The grain size of ThO2 pellets as a function of sintering
356
temperature.
357
Sintering temperature (°C)
Grain size (µm)
1600
2-10
1700
5-20
1750
10-30
358
[image:9.595.55.460.387.592.2]359
Fig. 4. Representative crystal orientations of a pressed pellet of
360
ThO2 sintered at 1750 °C and annealed at 1500 °C to develop
361
grain structure. Pole figures show the random orientation of the
362
grains in the {111}, {100} and {101} crystal planes.
363 364
3.2 Particle characteristics after selFrag HV
365
pulsing
366
Fragmentation of the ThO2 pellets produced randomly
367
shaped ThO2 particles, as confirmed by optical and electron
368
microscopy (Figs. 5 and 6). Similar randomly broken grains 369
A
B
typically result from applying conventional comminution 370
techniques e.g. grinding. However, adhered fines, normally 371
seen in SEM images showing products from conventional 372
comminution, were not observed, due to the pulse fragmen-373
tation procedure. Adheparticle free surfaces can be re-374
garded as ideal samples for the dissolution experiments 375
undertaken in this study. 376
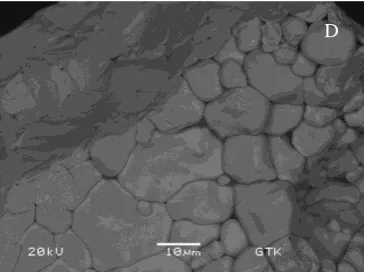
The particles exhibited two main textures: those with a 377
grain boundary texture and those without, as shown in Fig-378
ure 6. Grain boundaries were formed in these particles 379
through two processes. Firstly, prior to fragmentation, sur-380
faces of the original pellets developed a grain boundary 381
texture through high temperature annealing. It may also be 382
possible that such surfaces originate from the pulse frag-383
mentation process, which forces liquid through grain 384
boundaries to break the particles apart, leaving behind sev-385
eral surfaces with a grain boundary texture. 386
387
[image:10.595.57.298.250.432.2]388
Fig. 5. An image of 80 to160 µm ThO2 particles taken with a
389
biocular stereomicroscope.
390 391
392
Fig. 6. SEM image of 80 to160 µm ThO2 particle crushed using
393
the SelFag pulse fragmentation technique (330 x magnification).
[image:10.595.55.297.479.661.2]395
3.3 Dissolution experiments
396
3.3.1 ThO2 dissolution under atmospheric conditions 397
398
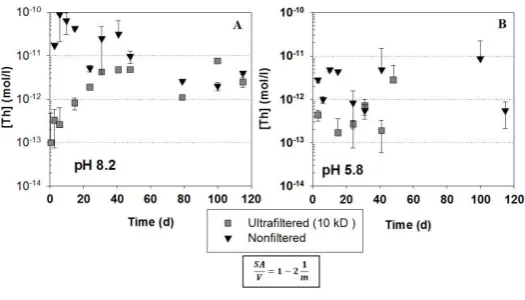
Figure 7 shows the dissolution data for ThO2 particles (2 - 4
399
mm) leached in air in 0.1 M NaCl or in 0.01M NaCl with 2 400
mM NaHCO3. In the solution containing carbonate
401
(Fig. 7a), a maximum concentration of Th of ~10-10 mol/L 402
was measured in non-filtered samples after 6 days of disso-403
lution. After 40 days the concentration plateaued at approx-404
imately 10-12 mol/L. The ultrafiltered samples reached a 405
concentration of between 10-11 and 10-12 mol/L at 40 days, 406
preceded by a steady increase in concentration from 10-13 407
mol/L. The initial pH value of 8.4 decreased slightly to pH 408
8.2 during the first 35 days of the experiment. In the 0.1 M 409
NaCl solution, shown in Figure 7b, the increase of the 410
measured concentration was not obvious; the concentra-411
tions in both non-filtered and ultrafiltered samples are scat-412
tered (Fig 7b) most probably due the concentrations occur-413
ring close to the analytical detection limit (1·10-13 mol/L). 414
The concentration of Th in the ultrafiltered samples de-415
creased below this detection limit of after 48 days sam-416
pling. The initial pH of the 0.1 M NaCl increased from 5.4 417
to pH 5.8 during the first 35 days of the experiment. 418
419
When comparing the results of the two experiments, the 420
solubility and the dissolution rates were greater in the solu-421
tion containing carbonate, (1·10-13 mol dm-3 d-1), likely due 422
to,the formation of Th-containing carbonate/hydroxide 423
complexes. In the absence of carbonate (0.1 M NaCl solu-424
tion) there was no clear trend, however, if the dissolution 425
rate is estimated from ultrafiltrated samples, the obtained 426
value was found to be 2·10-14 mol dm-3 d-1, an order of 427
magnitude less than that in the carbonate-containing solu-428
tion. In the oxic conditions utilised in these experiments 429
(which were conducted in air), dissolved carbon dioxide 430
from the atmosphere may have had a slight solubility in-431
creasing effect in the bi-carbonate-free solution. The in-432
creasing effect of carbonate complexation on the solubility 433
of thorium in each of the applied experimental conditions 434
was previously evaluated by geochemical modelling 435
(PHREEQC) [30]. A second set of experiments was there-436
fore conducted under inert Ar atmosphere, to exclude such 437
439
440
Fig. 7. Evolution of Th concentrations in ultrafiltered and
non-441
filtered experiments of 2 – 4mm ThO2 particle dissolution in (A)
442
0.01 M NaCl with 2 mM NaHCO3 and (B) in 0.1 M NaCl, both
443
under atmospheric conditions, at a temperature of 23°C.
444 445
3.3.2 ThO2 dissolution in anaerobic conditions 446
447
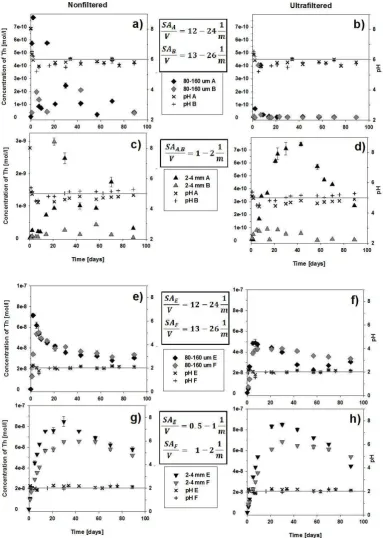
The dissolution data resulting from the leaching of 80 to 448
160 µm and 2 – 4 mm particles of ThO2 in 0.1 M NaCl
449
under an Ar atmosphere are shown in Figure 8. Unfiltered 450
samples arising from the smaller size fraction (80 to 160 451
µm) demonstrated a relatively rapid initial increase in Th 452
concentration to ~8·10-10 mol/L after 2 days of dissolution, 453
followed by a progressive decrease to 4·10-11 mol/L by 89 454
days (Fig 8a). Under the same conditions, ultrafiltered sam-455
ples (Fig. 8b) gave a maximum Th concentration of ~ 4·10 -456
10
mol/L after 7 days of leaching. After 9 days of dissolu-457
tion, the concentration of Th decreased below 1·10-11 mol/L 458
and remained at ~ 2·10-12 mol/L after 57 days. 459
[image:12.595.68.331.47.197.2]461
Fig. 8. The evolution of Th concentration and pH in 0.1 M NaCl
462
(a, b, c, d) and in 0.01 M HNO3 (e, f, g, h) with particle sizes 80 to
463
160 µm (a, b, e, f) and 2 to 4 mm (c, d, g, h) at 25 °C. The results
464
of the Non-filtered samples are given on the left and the
ULTRA-465
filtered ones on the right. The solid lines were sketched to guide
466
the eye to follow the pH values. Filtrations, solutions and particle
467
sizes presented here are also shown with references to this Fig. in
468
Table 2. (symbols A and B (E and F) in legend boxes refer to the
469
parallel experiments).
470 471
The maximum concentrations of Th were reached after 23 472
non-filtered and ultrafiltered samples, respectively). This 474
suggests that dissolution and precipitation / sorption kinet-475
ics are also slower in these samples, which is likely related 476
to the lower surface area resulting from the larger particle 477
size; the saturation limit is reached more slowly because 478
there is less surface area available for sorption and precipi-479
tation of secondary Th compounds. 480
The initial pH of the 2- 4 mm ThO2 dissolution experiments
481
was found to decrease rapidly from pH 8 to between pH 5 482
and pH 6, where it remained for the duration of the experi-483
ment. This unexpected result is likely due to the leaching of 484
H+ from incompletely rinsed reaction vessels. 485
Parallel, ultrafiltered experiments conducted for the 2 – 4 486
mm particle size (designated A and B, Fig. 8d)showed 487
considerable variation in concentration, by almost one order 488
of magnitude. This may be due to the influence of pH in the 489
test solutions; experiment A had a pH value of 4.8, while 490
experiment B gave a pH value of 5.3. At the conclusion of 491
the experiment, the Th concentrations were 7·10-12 mol/L 492
(experiment A, pH 4.8) and 3·10-10 mol/L (experiment B, 493
pH 5.3). While the difference in pH was only small, these 494
observations confirm the fact that the solubility of ThO2 is
495
highly dependent on the H+ activity in the solution [9-11]. 496
497
3.3.3 ThO2 dissolution as a function of particle size 498
499
To investigate further the influence of particle size on the 500
dissolution of ThO2, experiments were conducted in 0.01 M
501
HNO3, where dissolved Th concentrations far exceeded the
502
analytical detection limit of Th, allowing for an accurate 503
determination of the effects of particle size on dissolution 504
rate.. For 80 to 160 µm particles of ThO2 (Figs. 8e and f),
505
the concentration in the non-filtered samples increased 506
rapidly to 5·10-8 mol/L after 5 days of dissolution. Similar-507
ly, in the ultrafiltered samples, the Th concentration in-508
creased to 4·10-8 mol/L over the same time period. After 509
this initial rapid dissolution, the concentration of Th de-510
creased to levels between 3·10-8 and 4·10-8 mol/L for the 511
duration of the 90 days experiment, in both non-filtered and 512
ultrafiltered samples. 513
514
For the 2 to 4 mm ThO2 particles, the initial dissolution rate
515
was slower than that of the smaller particlesize. The maxi-516
mum concentration of Th was reached after 30 days of 517
dissolution, giving values of 6.5·10-8 mol/L and 8.5 ·10-8 518
mol/L for duplicate samples (Fig. 8g -h). The final concen-519
tration of Th was ~5 x 10⁻⁸ mol/L after 90 days, which was 520
slightly higher than the final concentration arising from the 521
smaller particle size (~3 x 10⁻⁸ mol/L) (Figs. 8e-f).This 522
suggests that particles with a greater surface area (e.g. 80 – 523
160 m size fraction) reach lower maximum concentrations 524
than particles with lower surface area (e.g. 2 – 4 mm parti-525
cles) a result of more surface sites available for sorption of 526
secondary precipitates. Such precipitates attenuate further 527
dissolution of the surface. A similar effect was observed for 528
particles subject to dissolution in 0.1 M NaCl (described 529
above). However, unlike the dissolution experiments con-530
ducted in 0.1M NaCl, where dissolution rates were clearly 531
species, the evolution of Th concentration in 0.01M HNO3
533
was independent of the sampling method; the concentra-534
tions of the ultrafiltered samples were very similar to the 535
non-filtered ones. This indicates that secondary phases or 536
colloids did not play a significant role in these experiments. 537
One possible explanation may be effects arising from high 538
energy sites on the surface, for example grain boundaries 539
(shown in Fig. 6). The larger particles comprise surfaces 540
with more grains than the smaller particles, therefore they 541
have a greater number of grain boundaries. In a recent study 542
[29] it was found that grain boundaries of ThO2 and CeO2
543
analogues for UO2 fuel dissolved very rapidly in 0.01M
544
HNO3. Therefore, the higher maximum concentrations
545
found for the large particles may be due to dissolution of 546
grain boundaries 547
548
3.3.4 Dissolution rates of ThO2 549
The initial dissolution rates of ThO2 under the experimental
550
conditions investigated were calculated from the evolution 551
of Th concentration during the period of release of Th into 552
solution, which took between 5 to 30 days, depending on 553
the liquid phase in question. 554
Calculated rates were obtained from linear regression of 555
these data, and are given in Table 2. The results clearly 556
show the pH dependence of the dissolution rate and the 557
increasing effects of carbonate concentration and particle 558
size . The dissolution rates were found to be greatest at low 559
pH and in the presence of carbonate. Small differences 560
were also observed between parallel experiments and in the 561
comparison between results calculated from non-filtered 562
and ultrafiltered samplings. 563
564
The presence of carbonates is known to increase the solu-565
bility of ThO2, which can have a significant effect on the
566
behaviour of Th(IV) in natural groundwaters. One order of 567
magnitude increase in [CO32-]has been shown to increase
568
the solubility of hydrous ThO2(am) by up to five orders of
569
magnitude [31]. Two mononuclear carbonate complexes of 570
Th(IV), Th(OH)3CO3
and Th(CO3)5
6-, have been reported 571
[31, 32]. Considerably higher Th(IV) solubility in the 572
Th(IV)-H2O-CO32- system, indicated the presence of highly
573
charged pentacarbonate species [31]. Using thermodynamic 574
modelling, Kim et al. [8] reported ternary complexes such 575
as Th(OH)3CO3-, Th(OH)2(CO3)34-, Th(OH)(CO3)55-,
576
Th(OH)2CO3(aq), Th(OH)2(CO3)22-, Th(OH)4(CO3)2-, which
577
are the most probable predominant aqueous Th(IV) species 578
under many natural conditions [8]. 579
580
At high pH close to pH 11.2, the higher concentration of 581
OH- ions has been found to enhance the formation of 582
Th(OH)4, and thus decrease the proportion of carbonate
583
complexes in solution. Therefore, the measured solubility 584
of Th(IV) in alkaline solutions is very close to the solubility 585
in carbonate-free solutions [8]. 586
Table 2. The initial dissolution rates [mol/g-1s-1] calculated for
590
samples A and E and their parallel samples B and F, according to
591
Equation (1).
592
Atmosphere and
Solution pH Particle
size
Test A (E) Test A (E) Test B (F) Test B (F) Data
in Figure
filtration slope, dc/dt rate slope, dc/dt rate
[molL-1day-1] [mol g-1s-1] [molL-1day-1] [mol g-1s-1]
Air (filtered) 0.01M NaCl
(2mM NaHCO3) 8 2-4mm 1.00E-13 2.00E-19
Fig 7B
Air (filtered) 0.1M NaCl 6 2-4mm 2.00E-14 4.10E-20
Fig 7A
Air 0.01M NaCl (2mM NaHCO3) 8 2-4mm 5.00E-12 1.10E-17
Fig 7B
Air 0.1M NaCl 6 2-4mm 3.00E-13 6.10E-19
Fig 7A
Argon (filtered) 0.1M NaCl 6 80-160um 5.40E-11 2.10E-16 2.90E-11 1.10E-16 Fig 8b
Argon (filtered) 0.1M NaCl 5 2-4mm 2.90E-11 1.00E-16 8.40E-12 2.10E-17 Fig 8d
Argon (filtered) 0.01M HNO3 2 80-160um 6.70E-09 2.70E-14 5.80E-09 2.20E-14 Fig 8f
Argon (filtered) 0.01M HNO3 2 2-4mm 6.30E-09 2.30E-14 4.40E-09 1.70E-14 Fig 8h
Argon 0.1M NaCl 5 80-160um 4.20E-10 1.70E-15 1.50E-10 5.60E-16 Fig 8a Argon 0.1M NaCl 4 2-4mm 4.40E-11 1.50E-16 9.20E-12 2.30E-17 Fig 8c
Argon 0.01M HNO3 2 80-160um 3.10E-08 1.30E-13 9.30E-09 3.50E-14 Fig 8e
Argon 0.01M HNO3 2 2-4mm 6.50E-09 2.40E-14 4.40E-09 1.70E-14 Fig 8g 593
Atmosphere and
filtration Solution pH
Particle size
Test A (E) slope, dc/dt [molL-1day-1]
Test A (E) rate [mol g-1s-1]
Test B (F) slope, dc/dt [molL-1day-1]
Test B (F) rate [mol g-1s-1]
Air (filtered)
0.01M NaCl
(2mM NaHCO3) 8 2-4mm 1.0E-13 2.0E-19
Air (filtered) 0.1M NaCl 6 2-4mm 2.0E-14 4.1E-20
Air
0.01M NaCl
(2mM NaHCO3) 8 2-4mm 5.0E-12 1.1E-17
Air 0.1M NaCl 6 2-4mm 3.0E-13 6.1E-19
Argon (filtered) 0.1M NaCl 6 80-160µm 5.4E-11 2.1E-16 2.9E-11 1.1E-16
Argon (filtered) 0.1M NaCl 5 2-4mm 2.9E-11 1.0E-16 8.4E-12 2.1E-17
Argon (filtered) 0.01M HNO3 2 80-160µm 6.7E-09 2.7E-14 5.8E-09 2.2E-14
Argon (filtered) 0.01M HNO3 2 2-4mm 6.3E-09 2.3E-14 4.4E-09 1.7E-14
Argon 0.1M NaCl 5 80-160µm 4.2E-10 1.7E-15 1.5E-10 5.6E-16
Argon 0.1M NaCl 4 2-4mm 4.4E-11 1.5E-16 9.2E-12 2.3E-17
Argon 0.01M HNO3 2 80-160µm 3.1E-08 1.3E-13 9.3E-09 3.5E-14
Argon 0.01M HNO3 2 2-4mm 6.5E-09 2.4E-14 4.4E-09 1.7E-14
If reader is interested in calculating the dissolution rate to units
594
[mol m-2s-2], one can e.g divide the values by 3.3cm2/g in cases of
595
2mm particle size and 80cm2/g in cases of 80 m.
596
3.3.4 Solubility of ThO2 597
598
The solubility levels at the end of the experiments were 599
compared with the equilibrium data of ThO2 and Th(OH)4,
600
which were taken from the Thermochimie database 601
[NEA/TDB] (Fig. 9). It should be noted that, for example, 602
in the experiment with 2 to 4 mm particles in 0.1 M NaCl 603
under Ar, there was still some decrease in Th concentration 604
at the end of the 90 days experiment. Thus, the solubility 605
level had probably not been stabilized to a steady state 606
during the experiments. The solubilities measured at pH 2 607
were at a lower level than would be expected from the 608
Neck et al. [11]. In their undersaturation dissolution exper-610
iments, conducted also with crystalline ThO2 in acidic
con-611
ditions, the solubilities stayed below the theoretical solu-612
bility of ThO2. In their experiments they also showed that
613
the value of the solubility product was dependent on the 614
crystallite size. In this study, the solubility values at a pH 615
range of 4 to 8 can be plotted between the theoretical solu-616
bilities of crystalline ThO2 and amorphous Th(OH)4 (Fig.
617
9). Compared to the studies discussed by Neck et al. 2003 618
and Vandenborre et al. 2010 [11, 6], the values presented 619
here are at an even lower level. This could be an effect of 620
the crystallinity and relatively high sintering temperature of 621
the ThO2 utilized in these studies, however the usage of a
622
sector field ICP-MS enabled an extremely accurate analyses 623
of dissolved Th concentrations (down to a concentration of 624
10-12 mol/L), which is lower than achievable with conven-625
tional quadrupole ICP-MS MS, used in most other studies 626
of Th solubility. 627
628
[image:17.595.74.468.277.560.2]629 630
Fig. 9. The solubility levels of Th after ~100 days of dissolution in
631
a suite of media investigated in the current work, compared to the
632
Thermochimie equilibrium data for ThO2 and Th(OH)4
633
[NEA/TDB].
634
3.4 SEM imaging of leached ThO
2surfaces
635
The SEM images of the HNO3 leached ThO2 particles
re-636
vealed that the nature of the dissolution/precipitation phe-637
nomenon varied among the particles present in same solu-638
tion. Some particles did not appear different from the fresh 639
and unreacted particles (see Figures 10a and Figure 6, re-640
showed textures indicative of grain boundary dissolution 642
(Figs. 10b –d), while others appeared to host a “blanket” of 643
secondary phases precipitated from solution. In the former, 644
grain rounding and widening of the grain boundaries was 645
observed (Fig. 10b). 646
647
These results are in agreement with Corkhill et al. [29] who 648
found that during dissolution in 0.01M HNO3, grain
bound-649
aries of ThO2 and CeO2 analogues for UO2 fuel dissolved
650
rapidly, giving rise to enhanced initial dissolution rates. 651
Furthermore, they found that surfaces with a grain bounda-652
ry texture (like those shown in Fig. 10a) dissolved at much 653
less rapid rate than surfaces with no grain boundaries, such 654
as those that would be found on the surface of a sintered 655
pellet. This may be the cause of the different particle mor-656
phologies described in the current investigation. 657
658
A
B
Fig. 10. BSE images of 80 to 160 µm ThO2 particle after 4 weeks
659
of leaching with 1 M HNO3 at 80°C. A) a leached particle
resem-660
bling a fresh one, B) a particle showing deeper dissolution, which
661
has deformed the grain boundaries and formed some cavities into
662
the ThO2 particle. C and D are taken from this particle, which
663
showed both areas of dissolution and no reaction.
664
4. Conclusions
665
ThO2 pellets were synthesised to resemble the
666
microstructure of the UO2 matrix of nuclear fuel pellets.
667
The pellets sintered at 1750 ° C had randomly oriented 668
crystals and a grain size ranging from 10 to 30 m. 669
Dissolution experiments were performed to study the effect 670
of carbonate complexation on these ThO2 samples. It was
671
observed that the solubility and dissolution of ThO2
672
increased in the presence of carbonate. The solubilities and 673
dissolution rates of ThO2 were also dependent on the H+
674
activity of the solution. The acidic conditions were found to 675
increase the solubility compared to near-neutral and basic 676
conditions, in which sparingly soluble hydrolysed species 677
of Th were the dissolution-controlling factor. In these 678
experiments the concentration of Th (≥ 10-9 mol/L) at pH
679
≤ 4 was slighly lower than the theoretical solubility of 680
crystalline ThO2. HR-ICP-MS, with magnetic sector field
681
capability, allowed the analyses of dissolved Th 682
concentrations of sparingly soluble ThO2 phases down to
683
10-12 mol/L. At higher pH values, from pH 4 to pH 8, the 684
measured concentrations (10-10 to 10-12 mol/L) were 685
between the theoretical solubility of ThO2 and Th(OH)4.
686
Particle size was also found to have an effect on the 687
solubility. The smaller particles with greater surface area 688
seem to have enhancing effect on initial dissolution, and 689
sorption/precipitation reactions. In agreement with recent 690
results [29], it is hypothesized that high energy surface sites 691
may play a role in the relatively rapid initial release of Th 692
observed here. The results of the surface analyses indicated 693
that the initial surface condition may also have some effect 694
on the dissolution processes, with grain boundaries likely 695
playing an important role. 696
Acknowledgements. This study has been a part of REDUPP
pro-697
ject. The research leading to these results has received funding
698
from the European Atomic Energy Community's Seventh
Frame-699
work Programme (FP7) under grant agreement No. 269903. The
700
high voltage pulse power fragmentation method, Selfrag
fragmen-701
tation, of the ThO2 pellets and SEM imaging of the leached
parti-702
[image:19.595.69.252.42.178.2]cles were carried out at the Finnish Geological Survey (GTK). We
703
thank Jukka Marmo and Marja Lehtonen from GTK for their work
704
and expertise. We thank also Jaana Rantanen and Merja
Tanhua-705
Tyrkkö from VTT. They took part to the Th analyses and data
706
treatment, respectively. We are grateful to Dr.Virginia Oversby
707
and Dr. Lena Z. Evins for invaluable discussion and support
708
throughout the project. We thank Posiva, SKB, VTT for their
709
financial support. CLC acknowledges The University of Sheffield
710
for the award of a Vice Chancellor's fellowship NCH is grateful to
711
the Royal Academy of Engineering and Nuclear
Decommission-712
ing Authority for financial support.
713
References
714 715
1. Morss, L.R., Edelstein, N.M., Fuger, J. & Katz, J.J.,The
chemis-716
try of the actinide and transactinide elements. Springer 2006.
717 718
2. Dekoussar, V., Dyck, G.R., Galperin, A., Ganguly, C.,
719
Todosow, M. & Yamawaki, M. Thorium fuel cycle – Potential
720
benefits and challenges. IAEA, IAEA-TECDOC-1450, Vienna,
721
2005
722 723
3. Alexander, W.R., and McKinley L.E. (ed.) Deep geological
724
Disposal of Radioactive Waste, Elsevier Series Radioactivity in
725
the Environment, Vol 9. 2008
726 727
4. Combie, C., Pescatore, C., Smith, P. and van Luik, A.,
Geologi-728
cal Disposal of Radioactive Waste; Review of Developments in
729
the Last Decade, OECD Publications, 2, rue Andr´e-Pascal, 75775
730
PARIS CEDEX 16, France
731
(66 1999 17 1 P) ISBN 92-64-17194-0 – No. 51101 1999
732 733
5. Vandenborre, J., Abdelouas A., Grambow, B., Discrepancies in
734
Thorium Oxide Solubility Values: a new experimental approach to
735
improve understanding of oxide surface solid/solution. RadioChim
736
Acta 96, 515-520.(2008)
737 738
6. Vandenborre, J., Grambow, B. & Abdelouas, A., Discrepancies
739
in Thorium Oxide Solubility Values: Study of
Attach-740
ment/Detachment Processes at the Solid/Solution Interface.
Inor-741
ganic chemistry. 49, No. 19, 8736-8748 (2010)
742 743
7. Neck, V. & Kim, J., Solubility and hydrolysis of tetravalent
744
actinides. Radiochim. Acta, 89, No. 1/2001, 1, (2001)
745 746
8. Kim, S., Baik, M., Choi, J., Shin, H. & Yun, J., The dissolution
747
of ThO 2 (cr) in carbonate solutions and a granitic groundwater.
748
Journal of Radioanalytical and Nuclear Chemistry, 286, No. 1, pp.
749
91-97 (2010)
750 751
9. Fuger, J., Rand, M., Grenthe, I, Neck, V., & Rai, D. Chemical
752
Thermodynamics of Thorium, OECD Nuclear Energy Agency.
753
(2007)
754 755
10. Neck, V., Müller, R., Bouby, M., Altmaier, M., Rothe, J.,
756
Denecke M.A. & Kim, J.I., Solubility of amorphous Th(IV)
hy-757
droxide – application of LIBD to determine the solubility product
758
and EXAFS for aqueous speciation. Radiochim. Acta, 90, pp. 485.
759
(2002)
760 761
11. Neck, V., Altmaier, M., Müller, R, Bauer, A, Fanghänel, Th,
762
and KIM J.I. Solubility if crystalline thorium dioxide, Radiochim.
763
Acta 91, 253-262, (2003)
764 765
12. Schindler, P.W., Heterogenous equilibria involving oxides,
766
hydroxides,carbonates and hydroxide carbonates. Adv. Chem. Ser.
767
67,196 (1967)
13. Bundschuh, T., Knopp, R., Müller, R., Kim, J., Neck, V. &
769
Fanghänel, T., Application of LIBD to the determination of the
770
solubility product of thorium (IV)-colloids. Radiochim. Acta, 88,
771
No. 9-11/2000, pp. 625. (2000)
772 773
14. Rothe, J., Denecke, M., Neck, V., Müller, R. & Kim, J., XAFS
774
investigation of the structure of aqueous thorium (IV) species,
775
colloids, and solid thorium (IV) oxide/hydroxide. Inorganic
chem-776
istry, 41, No. 2, pp. 249-258 (2002)
777 778
15. Bitea, C., Müller, R., Neck, V., Walther, C. & Kim, J., Study
779
of the generation and stability of thorium (IV) colloids by LIBD
780
combined with ultrafiltration. Colloids and Surfaces A:
Physico-781
chemical and Engineering Aspects, 217, No. 1, pp. 63-70. (2003)
782 783
16. Altmaier, M., Neck, V. & Fanghänel, T., Solubility and colloid
784
formation of Th (IV) in concentrated NaCl and MgCl2 solution.
785
Radiochimica Acta/International journal for chemical aspects of
786
nuclear science and technology, 92, No. 9-11/2004, pp. 537-543.
787
(2004)
788 789
17. Walther, C., Fuss, M. & Buchner, S., Formation and
hydroly-790
sis of polynuclear Th (IV) complexes-a nano-electrospray
mass-791
spectrometry study. Radiochim. Acta, 96, No. 7, pp. 411-426,
792
(2008)
793 794
18. Hubert, S., Barthelet, K., Fourest, B., Lagarde, G., Dacheux,
795
N. & Baglan, N.. Influence of the precursor and the calcination
796
temperature on the dissolution of thorium dioxide. Journal of
797
Nuclear Materials, 297, No. 2, pp. 206-213, (2001)
798 799 800
19. Forsyth R., Fuel rod D07/B15 from Ringhals 2 PWR: Source
801
material for corrosion / leach tests in groundwater. Fuel rod /
802
pellet characterisation program part 1. SKB technical report 87-02.
803
(1987)
804
805
20. Forsyth R., Spent nuclear fuel. A review of properties of
pos-806
sible relevance to corrosion processes. SKB technical report
95-807
23. (1995)
808 809
21. Stennett, M. C. Corkhill, C.L, Marshall, L. A. Hyatt, N.C., J.
810
Nucl.Mater., 432, 182 (2013)
811 812
22. Andres, U., Timoshkin, I. and Jirestig, J., Liberation of
miner-813
als by high-voltage electrical pulses. Powder Technology, 104,
814
37-49. (1999)
815 816
23. Bluhm H., Frey W., Giese H., Hoppe P., Schulthei C.,
817
Stra ner R., Application of Pulsed HV Discharges to Material
818
Fragmentation and Recycling, IEEE Trans. On Dielectrics and
819
Electrical Insulation, 7, No.5, (2000)
820 821
24. Rozalén M. L., Huertas F. J., Brady P. V, Cama J.,
García-822
Palma S., Linares J., Experimental study of the effect of pH on the
823
kinetics of montmorillonite dissolution at 25˚C, Geochimica et
824
Cosmochimica Acta, 72(17), 4224-4253, (2008)
825 826
25. Malmström M., Banwart S., Lewenhagen J., Duro L., Bruno
827
J., The dissolution of biotite and chlorite at 25˚C in the near
-828
neutral pH region, Journal of Contaminant Hydrology, 21(1-4),
829
201-213, (1996)
830 831
26. Brady P., Walther J.V., Kinetics of quartz dissolution at low
832
temperatures, Chemical Geology, 82, 253-264, (1990)
833 834
27. Brantley, S.L., Kinetics of mineral dissolution
Brantley, S.L., Kubicki, J.D., White, A.F., (Eds.), Kinetics of
836
Water–Rock Interaction, Springer-Kluwer, New York (2008)
837 838
28. Weast R.C. (ed), CRC Handbook of Chemistry and Physics,
839
53rd Edition, The Chemical Rubber Co. Cleveland, Ohio, USA,
840
(1972)
841 842
29. Corkhill, C.; Myllykylä, E.; Bailey, D.; Thornber, S.; Qi, J.;
843
Maldonado, P.; Stennett, M.; Hamilton, A.; Hyatt, N. The
contri-844
bution of energetically reactive surface features to the dissolution
845
of CeO2 and ThO2 analogues for spent nuclear fuel, submitted to
846
ACS Applied Materials & Interfaces. Manuscript ID:
am-2014-847
018978.
848 849
30. Zetterström Evins, L. & Vähänen, M.(eds.), REDUPP First
850
Annual Report, Posiva Oy, Olkiluoto, Finland, Posiva Working
851
Report 2012-28, 44 p (2012)
852 853
31. Rai, D., Felmy, A.R., Moore. D.A., & Mason, M.J., 1995. The
854
solubility of Th(IV) and U(IV) hydrous oxides in concentrated
855
NaHCO3 and Na2CO3 solutions. (1995)” In Scientific Basis for
856
Nuclear Waste Management XVIII, Part 2, T. Murakami and R. C.
857
Ewing (eds.), pp. 1143-1150, Materials Research Society
Sympo-858
sium Proceedings, Volume 353, Materials Research Society,
859
Pittsburgh, Pennsylvania.
860 861
32. Ötshols, E., Bruno, J. & Grenthe, I., 1994. The solubility of
862
microcrystalline ThO2 in CO-H2O media, Geochim. et
Cosmo-863
chim, Acta. 58, No. 2, pp. 613-623 (1994)
864 865 866 867 868 869
* Correspondence author (e-mail:[email protected])

![Fig. 9. The solubility levels of Th after ~100 days of dissolution in Thermochimie equilibrium data for a suite of media investigated in the current work, compared to the ThO2 and Th(OH)4[NEA/TDB]](https://thumb-us.123doks.com/thumbv2/123dok_us/7899266.187672/17.595.74.468.277.560/solubility-levels-dissolution-thermochimie-equilibrium-investigated-current-compared.webp)