Published By:
Abstract: Automation plays an important role towards maintaining a standard with proper deal of money for Horti-Agricultural products. The automatic technique is very useful in large farm with various fruits for sorting and packaging purposes. Again, it is essential to categorize the fruits with evaluating its quality as per consumer demand. This paper proposes a methodology for fruits identification and disease analysis using machine-learning techniques. The identification and quality evaluation of fruits is based on different features i.e. color, texture, shape and appearance of defects/ Diseases. Image pre-processing is used for increasing the details of image. Image segmentation separate an image in to different parts and from the segmented image, Gray-Level Co-Occurrence Matrix (GLCM) is used to access needful features. The Multi class Support Vector Machine (MSVM) classifier is used to identify the type of fruits, detect the defects/disease appear on the fruit and classify the type of disease. The automated system successfully classifies five types of fruits i.e. Apple, Mango, Orange, Tomato and Pomegranate with accuracy of 94.02%. The second phase of methodology identified two most appeared common diseases i.e. Anthracnose and Fruit Rot with overall accuracy of 92.17%. Finally, to measure the severity of diseases Fuzzy Logic technique has been used and graded into three categories as per percentage of infection.
Keywords: fruit identification, fruit grading, GLCM, K-Mean, Multi Class SVM, Fuzzy Logic.
I. INTRODUCTION
Fruit industry is one of the major drivers to grow economy of country. There is possibility of erroneous sorting and packaging of fruits due to manual inspection and lack of knowledge of quality evaluation.
The farmers are on pressure for demand of rapid supply due to shortage of skilled workers and rising of labour costs. In such a scenario, automation can reduce the costs by promoting production efficiency [1]. There are various kinds of fruits are cultivated in our country, but the major fruits are apple, mango, orange, tomato and pomegranate. Fruits qualities reduce due to change of climatic condition, low maintenance, improper harvesting and manual disease detection. In India mainly anthracnose and fruit rot are the two major and common disease found in most of the fruits. These varieties of fruits are cultivated in Andhra Pradesh, Maharashtra, Gujarat,
Revised Manuscript Received on December 22, 2018.
Santi Kumari Behera is working as Assistant Professor in the Dept. of
Computer Science and Engineering, VSSUT, Burla.
(email:[email protected]).
Prof. Amiya Kumar Rath is working as Professor in the Dept. of Computer
Science and Engineering, VSSUT, Birla.
(email:[email protected])
Prabira Kumar Sethy is working, as Assistant Professor is the Dept. of Electronics, Sambalpur University. (email:[email protected]).
Tamil Nadu, Karnataka, Jammu & Kashmir, Madhya Pradesh, Uttar Pradesh, Kerala, and West Bengal etc. The sorting and Grading can be done by manual observation in naked eye, but it is irregular, instinctive, unpleasant, expensive and easily biased by surrounding. Hence an automatic machine learning based perceptive system is required to identify the fruits and classifying according to severity & type of disease appeared [2]. In Agricultural image processing significant research have done for identification of fruits and detection & quantification of diseases. Most of the previous works are based on C-Mean, K-Mean and KNN for identification and quality analysis of fruits [3] [4] [5]. In this paper an automatic system is proposed, which is less time consuming and cost effective for farmer to identify the type of fruit and grade according to appearance of defects / disease. This research considers five type of fruits i.e. apple, mango, orange, pomegranate and tomato with two common appeared disease i.e. fruit rot & anthracnose. The Symptoms of anthracnose seem first as little, roundabout, marginally depressed sores on the outside of aging organic products. The spots rapidly expand, turn out to be profoundly discouraged, and build up a water-splashed appearance straightforwardly underneath the skin of the foods grown from the ground rings framing in the focal point of the injuries. The organic product spoil malady advances with slow increment of sore, causing a vile decay, and microscopic organisms may overflow the epidermis and splits the influenced region. Side effects can go from shallow flecking to depressed sores, dark coloured dark, dry which may Fig. 2 respectively.
(a) (b) (c) (d) (e) Fig.1 Anthraconose diseased fruits (a)Apple (b)Mango
(c) Orange (d) Tomato (e)Pomegranate
(a) (b) (c) (d) (e) Fig.2 Fruit Rot diseased fruits (a)Apple (b)Mango
(c) Orange (d) Tomato (e)Pomegranate
The objective of this paper is to suggest an automatic system based on image processing and machine learning techniques i.e. Segmentation by K-means clustering, feature extraction by GLCM and MSVM classifier for identification of fruits. The proposed automatic
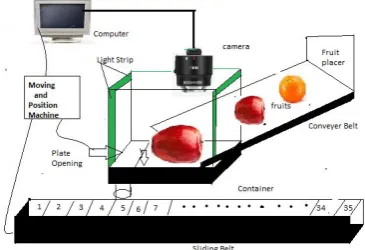
system consists of conveyer belt, Camera, Computer, Light Strip, Moving & Positioning Machine and 35
Automatic Fruits Identification and Disease
Analysis using Machine Learning Techniques
Published By: number of Container. The conveyer belt width is
[image:2.595.62.245.354.479.2]approximately 10cm to 15 cm, so that the fruits are approach to the image capturing chamber one by one (as the width of fruits are approximately 10-15cm). The conveyer belt will not move continuous manner, but it move & stop for a fraction of time and within that fraction of time the process & decision is made by the system. The operation of system involves acquisition of image, identify the type of fruits, classify the disease and measure the severity. Here three grades are assumed according to severity of disease i.e. (i) below 30% affected, (ii) below 80% affected (iii) above 80% affected. For each fruit 7 container are required to accumulate (1) Healthy fruit, (2) below 30% Anthracnose affected, (3) below 80% Anthracnose affected, (4) above 80% anthracnose affected, (5) below 30% fruit rot disease affected, (6) below 80% rot disease affected, (7) above 80% rot disease affected. Similarly, for five variety of fruits, 35 numbers of container are required. All the container is placed in a sliding belt. The system makes the decision according to fruit category and it send the command to move and positioning prompts cavities on the natural products [6]. The anthracnose and fruit rot affected diseased fruit are shown in Fig. 1 and machine to open the plate and slide & positioned the proper container to collect the appropriate fruits. The proposed fruit sorting system is in Fig. 3.
Fig. 3 Proposed Automatic Fruit Sorting System.
II. RELATEDWORK
B Monica Jhuria [7], acquainted a strategy with discover the natural product illness utilizing picture preparing. The primary point of the proposed technique was to identify sicknesses on apple, mangoes and grapes. In the directed investigation, surface, shading, and morphology are utilized as the highlights for highlight extraction. Morphology was turned out to be superior to anything different highlights as it gave 90% precise outcome. Back proliferation was utilized for weight change and a database was utilized to store the learning information. Dubey et. al. (Dubey, and Jalal, 2012a; Dubey, and Jalal, 2012b; Dubey, 2013) [3] [4] [5] [8] proposed a technique for distinguishing some normal ailment like smear and spoil in apple. The procedures utilized are K-implies bunching for grouping and Histogram, complete nearby parallel examples, Color lucidness vector and Local Binary example for highlight extraction process. Multiclass bolster vector machine was utilized for arrangement of maladies. Ranjit K N [9] presented a framework that distinguished the spoil ailment in apple and Anthracnose in the mango natural products. C-Mean and K-Mean are utilized for picture division to discover the district of intrigue for example the influenced area. The Gray Level Co-Event
Matrix highlights were extricated and KNN classifier was utilized for preparing and grouping. Li et.al. (Li, Wang, & Gu, 2002) [10] Did the segmentation by using simple threshold technique. The threshold technique (advancement over Otsu‘s method) was used to segment the apple fecal infectivity defect are obtainable by Kim et al. (2005). Partition of pixel is used to create the segment and used in other classification method. Fernando et al. [11] presented a methodology dependent on a Multivariate Image Analysis system to make an unsupervised technique utilizing principal components Analysis (PCA) through shading information and spatial unfurling from the strip. For the accelerate they utilized the multi goals idea. There are distinctive kinds of ailment present in natural product, plant, and leave because of assault of (bug). In [12] [13] [14] the creators talked about some of such infections. They isolated the sound part and absconded part with the assistance of various bunching forms. John Hartman described about different types of diseases appearing in apple at the time of harvest. He described nine type of diseases in his paper, specifying their characteristics [15]. Dervim Unay and his co-authors described about the apple fruit grading in [16]. In this paper they used machine vision for grading. Here they graded the bi-coloured apple fruit also. Many times, the defected part gets confused, due to bi-color of fruit. The technique overcomes this confusion. The authors used different types of classifier and feature extraction methods for grading of apple fruit. Statistical and syntactical classifiers are trained for two or multi-category grading of fruits. Ilaria Pertot and his co-authors describe about the disease identification of strawberry in the paper [17]. They used web-based tools for visual identification of plant disease. The system identifies the symptoms from the picture and then gave the most probable disease name. The system could be used in both desktop and smart phone. Fernado and his co-authors described about the citrus fruit defect in paper [18]. Many times, due to color and texture of citrus fruit, people get confused to identify the proper defect. The author used the approach for defect detection in any colour or texture. This approach was specially based on Multivariate Image Analysis Strategy and for extraction it used Principal Component Analysis. The approaches, that are studied here, some of them are completed and some are in developing process, some are useful, and some are not useful, still these approaches are motivated to work for a better fruit defect identification technique. Here we have considered five different types of fruit with two common diseases. We have tried to make this work friendly for people, which would help them to identify the defect properly.All these above discussed method is for only one or two fruits with one or two disease and may not give accurate result on low quality images so it motives us for working on five various fruits with the most common disease anthracnose and fruit rot for the all fruits (ripe and unripe) in a single system which is found approximately in every major state which is at the fruit harvest time.
III. MATERIALSANDMETHOD In this proposed work,
Published By: classification. Fig. 4 shows the framework of proposed
methodology. The user needs to upload the fruit image to the MATLAB designed user interface and after following the processing steps the user gets four output in serial manner i.e. (i) Type of fruit, (ii) Healthy/ Infected one (iii) Anthracnose or, Fruit Rot disease affected (iv) Severity of disease. In this work we considered, two image sets one is used for training purpose and another for testing purpose. The images are first uploaded to the system and then preprocessing is done. The feature extraction is based on the color component and texture of the images. In the primary database, the training data is present where as in the query database the extracted features are stored for classification of the images.
Fig.4 Frame work for Fruits identification
The fruit identification and disease analysis involve following steps:
Step1: Collection of the images.
Step2: Image preprocessing. (Removing noise by increasing contrast and brightness)
Step3: Image segmentation to three clusters using the K-Mean algorithm.
Step4: Choosing the region of interest (ROI) cluster.
Step5: feature extraction using the GLCM (Grey-Level Co-occurrence Matrix) technique
Step6: Classification of image using MSVM machine learning technique to detect the fruit name.
Step7: Image segmentation to three clusters using the K-Mean algorithm.
Step8: Choose the region of interest (ROI) cluster.
Sterp9: Feature extraction using the GLCM (Grey-Level Co-occurrence Matrix) technique
Step10: Classification of disease using MSVM machine learning technique
Step11: Identification of the disease severity through Fuzzy Logic.
Step12: Finding accuracy by the kernel trick with 500 iterations.
A.
Image preprocessing and segmentationIn this section the image is resized to 300*300px because as the photo taken with digital camera that is always high-quality large image which can takes more time for processing. Image preprocessing should be done for removing noise increase of contrast and brightness for a better segmentation of the images. This progression incorporates the division of a picture utilizing K-Means calculation. It is very useful technique for a substance acknowledgment utilizing a gathering of K-classes. The ability of considering the provocative part of the source picture should be possible by shortening the square summation remove between the identical group and a substance. In K-Means bunching methods, the bunches are controlled by the groupings of pixels having a similar esteem present in a picture. For all intents and purposes, the computational speed of this new picture preparing strategy is exceptionally quick just as gives increasingly precise yield. The info dataset is divided into K number of groups and each bunch is considered by a bunch focus which is versatile ordinarily. At first considered qualities are known as seed focuses and inputs are otherwise called information focuses. Estimation of the separations between the focuses, inputs, and apportion contributions to the closest focus is just conceivable by utilizing K-Means grouping strategy. This process has already been implemented in leaf image segmentation of rice crop onto more than one groups having the respective diseases. After the successful implementation K-Means cluster-based segmentation, the percentage of the infected area calculated, and features are extracted.
B.
Features extraction and Classification of FruitsHighlight extraction assumes an imperative job during the time spent copy listing. Thus, Gray Level Co-occurrences Matrix (GLCM) could be an efficacious and right creative system for measurable parameter extraction based on surface mining. The picture highlights incorporate Correlation, Entropy, Variance, Homogeneity, Contrast, Energy and Mean are processed. For the training purpose we consider 10 images from three category i.e. healthy, anthracnose & fruit rot of five type fruits i.e. total of 150 images. By the feature extraction with GLCM we take the above discussed color space features of different fruits which contains both ripe and unripe fruits. With that data, dataset is prepared which helps in classification. Multi-support vector machine is used for classification. MSVM classifier can classify when more than 2 classes are available. In MSVM looks at the extreme out to the dataset and draw decision boundary know as hyper plane which separate the classes and detect the affected and non-affected images of fruits. These hyper planes should be optimized. For the hyper plane two support vectors are needed, one vector in positive side and another is in the negative side. The distance of the two support vector from hyper plane is Maximum and focuses on extreme data points in each side. The MSVM is a quite popular alternate of ANN. It is quite effective in high dimensional space data. It also works well in less dataset as compare to other classifiers. It is memory efficient. It uses
Published By: IV. MEASUREMENT OF DISEASE SEVERITY
The disease severity is measure with the help of Fuzzy logic. The output of third phase of classification which shows the type of disease affected fed to the fuzzy system as input. The disease severity is predicted as per the affected area. Again, the severity is differentiated with level of risk i.e. low risk, moderate risk & high risk as per the percentage of infection, illustrated in below Table 1.
Table 1 Disease Severity with level of risk of fruits Sl No. Percentage of infection Class Risk
1 1-30 Low Risk
2 30-70 Medium Risk
3 70-100 High Risk
V. RESULTANDDISCUSSION
[image:4.595.302.546.82.576.2]The experimentation includes arrangement of informational index for preparing reason, gathering of picture for testing and aftereffects of proposed strategy. The preparation pictures are gathered from the web and distributing zone. The pictures are caught by 8 megapixels mobile phone and a few pictures from the 2 mega pixel mobile phone. For the preparation propose we have taken complete 150 no. of fruits picture for example 30 number of fruits from every 5 type. Again, each type of fruits consists 10 number healthy, 10 Anthracnose affected & 10 fruit rot affected fruits. The training image contain Anthracnose affected fruit, fruit rot affected fruits and healthy fruits. Variance of the color, surface and various part of the fruit images are taken in account for make the proposed methodology more practical. The proposed system consists three phase output i.e. the first phase identifies the type of fruits, second phase detect the defect one, third phase identify the disease. The performance of each phase of methodology is illustrated in Table. 2 –Table.8. After the image acquisition, image preprocessing, K-mean clustering and feature extraction using the GLCM technique is done. Preparing and characterization is finished utilizing multi support vector machine (SVM) which is the most famous system for grouping. First the pictures are processed to remove noise and increase the brightness and contrast for easy segmentation. At that point pick the sound piece of the picture to group the organic product type among five natural products. Of course, portioned and pick surrendered part as ROI to recognize whether natural product is sound or, influenced by anthracnose/organic product spoil. At that point, infection seriousness is determined utilizing the fluffy rationale and separated in three class.
Table 2 Fruit Classification
Apple Tomato Pomegranate Orange Mango Accuracy
Apple 52 2 X 2 X 92.3%
Tomato 1 56 X 1 X 96.4%
Pomegranate X 4 44 X X 90.9%
Orange X X X 36 2 94.4%
Mango X X X 2 52 96.1%
Overall Accuracy 94.02%
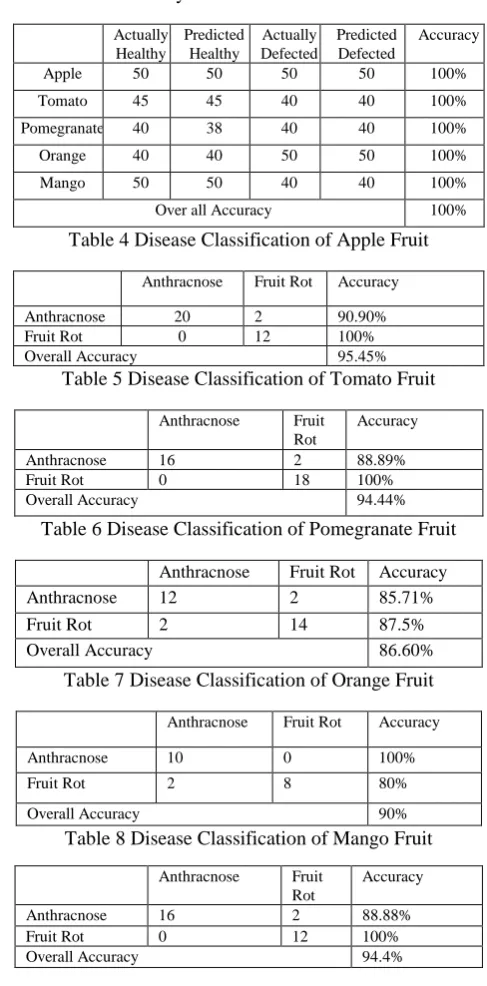
Table 3 Healthy & Defected Fruit Classification
Actually Healthy
Predicted Healthy
Actually Defected
Predicted Defected
Accuracy
Apple 50 50 50 50 100%
Tomato 45 45 40 40 100%
Pomegranate 40 38 40 40 100%
Orange 40 40 50 50 100%
Mango 50 50 40 40 100%
Over all Accuracy 100%
Table 4 Disease Classification of Apple Fruit
Anthracnose Fruit Rot Accuracy
Anthracnose 20 2 90.90%
Fruit Rot 0 12 100%
Overall Accuracy 95.45%
Table 5 Disease Classification of Tomato Fruit
Anthracnose Fruit
Rot
Accuracy
Anthracnose 16 2 88.89%
Fruit Rot 0 18 100%
Overall Accuracy 94.44%
Table 6 Disease Classification of Pomegranate Fruit
Anthracnose Fruit Rot Accuracy
Anthracnose 12 2 85.71%
Fruit Rot 2 14 87.5%
Overall Accuracy 86.60%
Table 7 Disease Classification of Orange Fruit
Anthracnose Fruit Rot Accuracy
Anthracnose 10 0 100%
Fruit Rot 2 8 80%
Overall Accuracy 90%
Table 8 Disease Classification of Mango Fruit
Anthracnose Fruit
Rot
Accuracy
Anthracnose 16 2 88.88%
Fruit Rot 0 12 100%
Overall Accuracy 94.4%
The experimentation of proposed system comprises of three stage. In first stage it distinguishes the sort of natural products among the five kind of fruits for example Apple, Mango, Orange, Tomato and Pomegranate. For experimentation we have taken 56 number of Apple, 58 number of Tomato, 45 number of Pomegranate, 38 number of Orange and 54 number of Mango. What's more, the procedure effectively distinguished the right fruit with exactness of 94.02%, as few numbers of fruits are anticipated mistakenly as different fruits, which is represented in Table. 2. The second phase of methodology classified between healthy & defected fruit and achieved 100% accuracy, illustrated inTable.3. The third phase of methodology detected the type of disease affected in
fruits. Here, we
[image:4.595.45.294.698.775.2]Published By: illustrated in Table.4, Table.5, Table.6, Table .7 & Table.8
and achieved accuracy of 95.45%, 94.44%, 86.66%, 90% & 94.45 respectively. The overall accuracy for detection of disease is 92.17%. Again, fuzzy logic was applied to measure the severity of disease & graded in to three classes i.e. Low Risk, Moderate Risk & High Risk according to percentage of infection. The challenges of this research is to avoid the impact of specular reflection of, blurring and low quality of imaging.
VI. CONCLUSION
In this article, we introduced to an automated system where the farmer or any user can upload an image and easily identify the type of fruits among five fruit i.e. Apple, Pomegranate, Mango, Orange and Tomato and detect the commonly appeared disease i.e. Anthracnose & Fruit Rot. The identification of type of fruits is with accuracy of 94.02%. The methodology successfully detected healthy & defected fruits with 100% accuracy. The most common appeared disease i,e, Anthracnose & Fruit Rot is detected with accuracy of 92.17%. Again, it measures the severity of disease and graded in to three categories. The examined result gives different accuracy according to the image quality and affected stage. The accuracy can be increased when number of datasets increased with good quality images. It helps the farmer for modern agricultural view which gives farmer profit and save time, cost and efforts towards the agriculture. This increase interest towards the agriculture, take participation in the process of development of the nation and increases the economic growth.
REFERENCES
1. Horticultural Statistics at a Glance 2017, Ministry of Agriculture and Farmer welfare, Government of India.
2. Bhangea, M., H.A.Hingoliwalab Smart Farming: Pomegranate Disease
Detection Using Image Processing Second International Symposium on Computer Vision and the Internet (VisionNet’15).
3. Shiv Ram Dubey, Anand Singh Jalal, Detection and Classification of
Apple Fruit Diseases using Complete Local Binary Patterns IEEE, Third international conference on Computer and communication Technology, 2012, p.247-251.
4. Dubey, S. R. (2012). Automatic Recognition of Fruits and Vegetables
and Detection of Fruit Diseases. Master’s theses, GLA University Mathura, India.
5. Dubey, S. R., & Jalal, A. S. (2012a). Robust Approach for Fruit and Vegetable Classification. Procedia Engineering, 38, 3449 – 3453.
6. www.garden.com
7. B Monika Jhuria, Ashwani Kumar, Rushikes Borse,”Image Processing
for Smart Farming: Detection of Disease and Fruit Grading”2013 IEEE Second International Conference On Image Processing, 9-11 Dec. 2013, Pp. 521 - 526, 2013.
8. Dubey, S. R., & Jalal, A. S. (2012b). Adapted Approach for Fruit Disease Identification using Images. International Journal of Computer Vision and Image Processing, 2(3), 51 – 65.
9. Ranjit, Chethan, Naveena Identification and Classification of Fruit
Diseases Ranjit K N.et al. Int. Journal of Engineering Research and ISSN: 2248-9622, Vol. 6, Issue 7, (Part -3) July 2016, pp.11-14.
10. Li, Q., Wang, M., & Gu, W. (2002, November). Computer Vision Based
System for Apple Surface Defect Detection. Computers and Electronics in Agriculture, 36, 215-223.
11. V. Arvis et al., “Generalization of the co-occurrence matrix for colour
images: application to colour texture classification,” Image Analysis & Stereology, vol. 23, no. 1, pp. 63–72, 2011.
12. Jagadeesh Devdas Pujari, Rajesh Yakkundimath and Abdulmunaf
Syedhusain Byadgi ," Grading and Classification of Anthracnose Fungal Disease of Fruits based on Statistical Texture Features"International Journal of Advanced Science
13. CROPSAP (Horticulture) team of ’E’ pest surveillance: 2013: Pests of
Fruits (Banana, Mango and Pomegranate) ’E’ Pest Surveillance and Pest Management Advisory (ed. D.B. Ahuja), jointly published by National Centre for Integrated Pest Management, New Delhi and State Department of Horticulture, Commissionerate of Agriculture, Pune, MS. pp 67
14. Moshou, D., Bravo, C., Wahlen, S., West, J., McCartney, A., De, J., Baerdemaeker, J. D., & Ramon, H. (2006). Simultaneous Identification of Plant Stresses and Diseases in Arable Crops using Proximal Optical Sensing and Self-Organizing Maps. Precision Agriculture, 7(3), 149-164.
15. Hartman, J. (2010, April). Apple Fruit Diseases Appearing at Harvest.
Plant Pathology Fact Sheet, College of Agriculture, University of Kentucky.
16. Bernard Gosselin,Olivier Kleynen, Vincent Leemans, Marie-France
Destain and Olivier Debeir Devrim Unay, "Automatic grading of Bi-coloured apples by multispectral machine vision," Computers and Electronics in Agriculture, November 2010.
17. Ilaria Pertot, Tsvi Kuflik, Igor Gordon, Stanley Freeman, Yigal Elad, Identificator: A web-based tool for visual plant disease identification, a proof of concept with a case study on strawberry, Computers and Electronics in Agriculture, Elsevier, 2012, Vol.88.
18. Fernando, L. -G., Gabriela, A. –G., Blasco, J., Aleixos, N., & Valiente, J. –M. (2010). Automatic Detection of Skin Defects in Citrus Fruits Using a Multivariate Image Analysis Approach. Computers and Electronics in Agriculture. 71(2), 189-197.
AUTHORSPROFILE
Santi Kumari Behera has received her Master of Technology degree in Computer Science & Engineering from NIT Rourkela. She is working as Assistant Professor in Veer Surendra Sai University of Technology, Odisha, India. Her research of interest in Computer Graphics and Image Processing.
Amiya Kumar Rath has already received Ph.D. in Computer Science from the Utkal University, Odisha, India. He is working as Professor at Veer Surendra Sai University of Technology, Odisha. He has published over 70 number of research articles in various areas of Computer Science, concentrating on Artificial Intelligence, Image Processing, and Embedded System.