Materials Science and Engineering Publications
Materials Science and Engineering
11-2001
Analysis of interdiffusion of Dy, Nd, and Pr in Mg
Y. Xu
Iowa State University
L. Scott Chumbley
Iowa State University, [email protected]
G. A. Weigelt
Iowa State UniversityF. C. Laabs
Iowa State UniversityFollow this and additional works at:
http://lib.dr.iastate.edu/mse_pubs
Part of the
Metallurgy Commons
The complete bibliographic information for this item can be found at
http://lib.dr.iastate.edu/
mse_pubs/132
. For information on how to cite this item, please visit
http://lib.dr.iastate.edu/
howtocite.html
.
Analysis of interdiffusion of Dy, Nd, and Pr in Mg
Abstract
The diffusion characteristics of Mg–rare-earth diffusion couples were studied. Cylinders of pure Mg and rare earth (Dy, Nd, and Pr) were abutted and annealed at 500 °C for 100 h or 300 h. Point-by-point composition profiles were collected starting in pure Mg, across the diffusion zone, and ending in the pure rare earth, using energy dispersive x-ray spectroscopy with a scanning electron microscope. The intermetallic phases that resulted due to diffusion were identified and compared to existing phase diagrams, for which the data is limited. For each diffusion couple, a plot of concentration versus distance perpendicular to the original plane of contact was obtained and analyzed using the Boltzman–Matano method. The interdiffusion coefficients for each set of phases were then calculated. The results show that diffusion through the intermetallic phases is much slower than is expected in a solid solution.
Keywords
Ames Laboratory
Disciplines
Metallurgy
Comments
This article is fromJournal of Materials Research16 (2001): 3287-3292,doi: 10.1557/JMR.2001.0452. Posted with permission.
Analysis of interdiffusion of Dy, Nd, and Pr in Mg
Y. Xu, L.S. Chumbley, G.A. Weigelt, and F.C. Laabs
Ames Laboratory and the Materials Science & Engineering Department, Iowa State University, Ames, Iowa 50011
(Received 12 February 2001; accepted 4 September 2001)
The diffusion characteristics of Mg–rare-earth diffusion couples were studied. Cylinders of pure Mg and rare earth (Dy, Nd, and Pr) were abutted and annealed at 500 °C for 100 h or 300 h. Point-by-point composition profiles were collected starting in pure Mg, across the diffusion zone, and ending in the pure rare earth, using energy dispersive x-ray spectroscopy with a scanning electron microscope. The intermetallic phases that resulted due to diffusion were identified and compared to existing phase diagrams, for which the data is limited. For each diffusion couple, a plot of
concentration versus distance perpendicular to the original plane of contact was obtained and analyzed using the Boltzman–Matano method. The interdiffusion
coefficients for each set of phases were then calculated. The results show that diffusion through the intermetallic phases is much slower than is expected in a solid solution.
I. INTRODUCTION
Rare earths are routinely added by industry to improve mechanical properties in cast Mg alloys. The first Mg– rare-earth alloys developed used mischmetal (50% Ce, 30% La, 15% Nd, and 5% Pr) to reduce microporosity in wrought alloys such as Mg–1.25Zn–0.17MM.1 Rare earth (RE) additions are especially effective in improving the creep resistance of magnesium-based alloys.2 The rare earths also refine the grain size and improve the strength, ductility, toughness, weldability, ma-chinability, and corrosion resistance.3 Recently devel-oped alloys containing one or two rare earths have been found to possess improved properties over the early mischmetal alloys. Didymium (80% Nd–20% Pr mix-ture) is the most effective, followed by cerium-free misch-metal, mischmetal cerium, and lanthanum, in the order of decreasing effectiveness. Mg–Al–Zn–Nd alloys have good corrosion resistance in an aqueous saline solution. A Mg–Y–Nd–Zr alloy was shown to have good corro-sion resistance, good castability, and stability to 300 °C.4 Despite the widespread use of rare earths in Mg alloys, little is known about the diffusion rates of rare earth in Mg or vice versa. The only known diffusion study thus far that the authors could find is that of Lal and Levy, who determined the diffusion coefficients of Ce and La in Mg.5In their study, pure Mg and Mg–rare-earth alloys were abutted to form diffusion couples. Their results are summarized in Table I.
In a somewhat related study, liquid Mg was used to extract Nd from solid FeNdB magnet scrap. In this in-vestigation it was shown that the diffusion rate of the Nd through the scrap was extremely rapid.6 Calculations
based on the composition profiles obtained gave a value of 4.61 ×10⁻⁸cm2/s at 700 °C for the diffusion coeffi-cient of Nd in liquid Mg.
This study focused on the interdiffusion between Mg and the rare earths Dy, Nd, and Pr. The concentration profiles that developed in diffusion couples during iso-thermal anneals were examined and the phase layers identified. The Boltzman–Matano method was used to evaluate the nature of the diffusion in these couples. This analysis provides the first attempt to study the diffusion coefficients in these Mg-RE systems.
II. EXPERIMENTAL PROCEDURE
[image:3.612.314.556.637.740.2]Cylinders of pure Mg and pure rare earth (Dy, Nd, and Pr) with radius approximately 5.5 mm and length ap-proximately 10.0 mm were manually pressed together to form a diffusion couple. The purity of magnesium used was 99.8% (metal basis) and the purities of the various rare earths are listed in Table II. The cylinders were
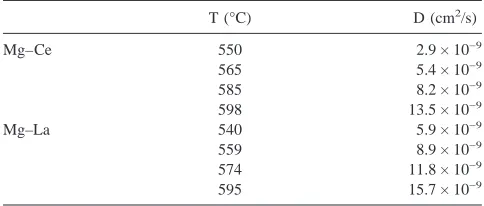
TABLE I. Diffusion coefficients of cerium and lanthinum in magne-sium (Ref. 5).
T (°C) D (cm2/s)
Mg–Ce 550 2.9 × 10⁻⁹
565 5.4 × 10⁻⁹
585 8.2 × 10⁻⁹
598 13.5 × 10⁻⁹
Mg–La 540 5.9 × 10⁻⁹
559 8.9 × 10⁻⁹
574 11.8 × 10⁻⁹
595 15.7 × 10⁻⁹
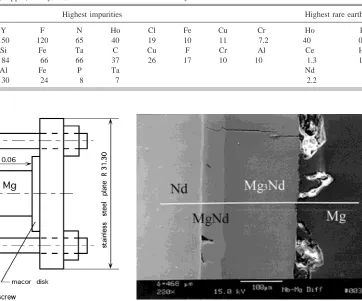
placed in a simple press as shown in Fig. 1. A slight compression force was placed on the cylinders by tight-ening the stainless steel screws. There are three screw holes in the stainless steel plates in order to give even pressure on the diffusion couple. Two macor disks were used to insulate the rare earth and Mg pieces from the stainless steel contact plates and to prevent Fe diffusion into the rare earth and Mg pieces. The device was placed in a furnace with an atmosphere controlled chamber and held at 500 °C for 100 h (Nd) and 300 h (Dy and Pr). Before heating, the chamber was evacuated then back-filled with Ar, with greater than 99% purity, to maintain a clean environment and minimize Mg loss.
After the time was completed the samples were re-moved, cross sectioned, and polished for anlaysis. Back-scattered scanning electron microscopy (SEM) imaging was used to reveal the intermetallic layers and point-by-point x-ray energy dispersive spectroscopy (EDS) com-position measurements were taken across the diffusion zone. Each point was acquired for 200 s and the data were analyzed by a standards analysis. The endpoints of the diffusion couple were used as the elemental internal standards. The composition profiles were analyzed using computer programs to balance the flux of Mg and rare-earth atoms to determine the initial Boltzmann–Matano interface.
III. EXPERIMENTAL RESULTS
A. Mg–Nd diffusion couple
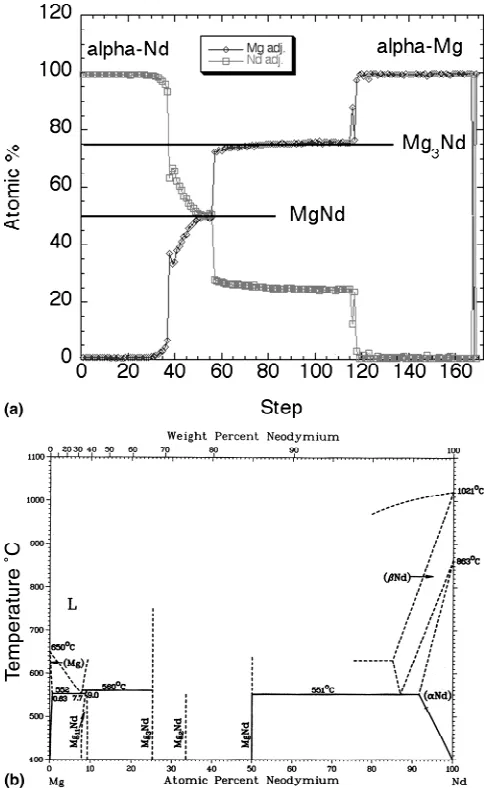
[image:4.612.179.541.420.721.2]The Mg–Nd diffusion couple was held at 500 °C for 100 h. Two intermetallic zones are clearly seen in Fig. 2. Compositions were collected by EDS line scan along the bright line across the two diffusion zones. The total length of the line scan is 468m with the number of steps being 167, giving a distance of 2.80m per step. (For simplicity in plotting all the data of this study are displayed as composition per step.) The concentration profile is shown in Fig. 3(a). The two diffusion zones are identified as Mg3Nd and MgNd, and the thicknesses of the zones are 162.5 and 50.4m, respectively. No evi-dence was seen of the Mg2Nd and Mg11Nd phases shown in the proposed phase diagram of Mg–Nd7 [Fig. 3(b)]. While the Mg11Nd phase may have appeared after longer aging times, this rationale does not explain the absence of the expected Mg2Nd layer between the two ob-served phases. Also note that a Mg9Nd phase has been reported,8but this phase also does not appear, either in this study or the proposed phase diagram. The gen-eral uncertainty associated with the phase diagram sug-gests that phase formation in the Mg–Nd system may be influenced by the presence of impurities within the sample.
TABLE II. Impurity composition (in ppm) of Dy, Pr, and Nd material used in this study.
Highest impurities Highest rare earths
Dy O C Y F N Ho Cl Fe Cu Cr Ho Pr
1100 860 150 120 65 40 19 10 11 7.2 40 0.1
Nd O N Si Fe Ta C Cu F Cr Al Ce Ho
850 550 84 66 66 37 26 17 10 10 1.3 1.1
Pr Si Cl Al Fe P Ta Nd
[image:4.612.61.343.426.722.2]120 44 30 24 8 7 2.2
FIG. 1. Manual screw-driven press used for the diffusion couple studied.
FIG. 2. SEM micrograph of the Mg–Nd diffusion couple taken across the diffusive interface. The trace of the EDS scan is shown.
Y. Xuet al.:Analysis of interdiffusion of Dy, Nd, and Pr in Mg
B. Mg–Dy diffusion couple
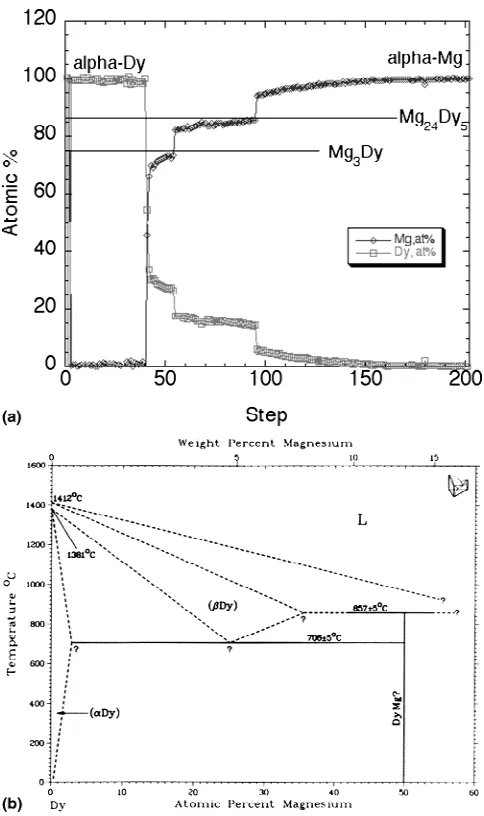
The Mg–Dy diffusion couple held at 500 °C for 300 h is shown in Fig. 4. Again, two intermetallic zones are clearly seen. The dark line shows where the compositions were collected by x-ray EDS line scan. For this sample, the total length of the line scan was 763m, and the number of steps was 200, giving a distance of 3.815m per step. The concentration profile along the line is shown in Fig. 5(a). The compositions determined by EDS are Mg3Dy and Mg24Dy5 with thicknesses of 45.8 and 152.6m, respectively. Four intermetallic com-pounds have been reported in the Mg–Dy system,7 namely MgDy, Mg2Dy, Mg3Dy, and Mg24Dy5. The phase boundaries of these compounds have not been de-termined, and the provisional phase diagram [Fig. 5(b)] only goes to 60 at.% Mg. Slight chemical variations were observed for both Mg3Dy and Mg24Dy5, indicating that
these phases may exist over a narrow compositional range rather than as line compounds, and the higher Dy content compounds were not seen.
C. Mg–Pr diffusion couple
The Mg–Pr diffusion couple held at 500 °C for 300 h is shown in Fig. 6. Three intermetallic zones are seen in this sample. The total length of the line scan indicated for this sample was 538m, and the number of steps was 200 for a distance of 2.69m per step. The concentration profile is shown in Fig. 7(a). The three diffusion zones are identified as Mg2Pr, Mg41Pr5, and Mg12Pr respec-tively. The thicknesses of the Mg3Pr, Mg41Pr5, and Mg12Pr layers were 48.4, 293.2, and 29.6m. The ob-served phases are all shown on the published phase dia-gram of Ref. 7 [Fig. 7(b)] as line compounds. The results of this study show the composition of Mg41Pr5, and Mg12Pr as being very constant while a slight range in composition was observed for Mg3Pr. Again, the higher rare-earth-content compound was missing, as was seen for the Mg–Nd and Mg–Dy systems, in this case being MgPr. The incomplete nature of the present phase diagrams and the high degree of uncertainty associated with them makes it difficult to comment on the various phase ab-sences. It is possible that simply aging for longer times would have caused several of the high-rare-earth-content phases to appear. Of the compounds seen, several exhib-ited constant compositions indicative of line compounds while other showed slight chemical variations. The high vapor pressure of Mg and the reactivity of rare-earth elements make experimental determination of complete phase diagrams difficult for these systems. Clearly, more work is needed in this area to determine the phase dia-grams of these systems.
[image:5.612.317.555.86.276.2]FIG. 3. (a) Mg–Nd concentration profile obtained using EDS analysis. (b) Phase diagram of Mg–Nd (from Ref. 7).
FIG. 4. SEM micrograph of the Mg–Dy diffusion couple taken across the diffusive interface. The trace of the EDS scan is shown.
Y. Xuet al.:Analysis of interdiffusion of Dy, Nd, and Pr in Mg
[image:5.612.56.301.325.719.2]IV. DISCUSSION
The Boltzmann–Matano method allows one to calcu-late interdiffusion fluxes at every location in a diffusion couple based on known concentration profiles for each component along a diffusion zone. This method relies on determining the position of the Boltzmann–Matano in-terface (also known as simply the Matano inin-terface) at which the accumulation of a component on one side is balanced by the depletion on the opposite side of the plane. For a constant-density system, the Boltzmann– Matano plane position x0 is defined by the following criterion,9
兰
−⬁x0
xdC=
兰
x0
⬁
xdC ,
where x is the distance from the Matano interface, C is the composition of the element considered, and x0is the Boltzmann–Matano plane position.
In the diffusion couples studied, the Boltzmann– Matano interface position was determined by the EDS composition profiles. The region near each interface was analyzed using software to determine the flux of atoms. The diffusion gradient was calculated across the interface and analyzed to obtain equal volumes by integration of the area under the concentration gradients. The point at which the areas were equal was the position of the Boltzmann–Matano interface.
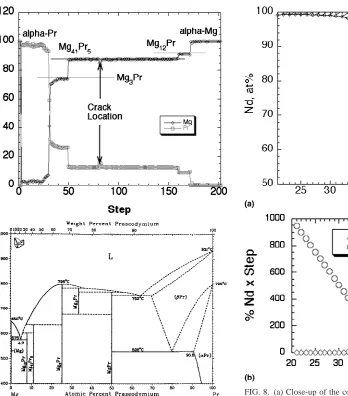
As an example of the analysis, consider the data for the Mg–Nd diffusion couple. By observation of the raw data the composition begins to deviate from pure Nd at step 21, which for this analysis is 468m/ 167 × 21⳱58.8m from where the scan began. (For this example it is less complicated if we consider distance as the number of steps rather than an actual distance in microns.) The composition of Nd falls across the inter-face until it reaches a value of 50% at step 56, the equi-librium composition of the intermetallic phase MgNd. This composition profile is shown in Fig. 8(a). Figure 8(b) shows the integrated area both over and un-der the composition gradient of Fig. 8 as a function of moving a vertical line (representative of the possible Boltzmann–Matano interface) across the graph. It should be noted that in the determination of this plot points that obviously deviated from a smooth curve were omitted. The value for “Area Above Gradient” starts near zero and then climbs dramatically as a vertical line moves from left to right across the graph while “Area Below Gradi-ent” correspondingly drops. The point at which the areas of the regions are equal reveals the correct Boltzmann– Matano interface. From Fig. 8(b), this point is located between Step 39 and Step 40. By this same method, the location of the Boltzmann–Matano interfaces were
[image:6.612.57.299.83.491.2]FIG. 5. (a) Mg–Dy concentration profile obtained using EDS analysis. (b) Phase diagram of Mg–Dy (from Ref. 7).
FIG. 6. SEM micrograph of the Mg–Pr diffusion couple taken across the diffusive interface. The trace of the EDS scan is shown.
Y. Xuet al.:Analysis of interdiffusion of Dy, Nd, and Pr in Mg
[image:6.612.316.556.531.720.2]determined at every intermetallic interface within the Mg–Nd diffusion couple as well as for all interfaces in the Mg–Pr and Mg–Dy samples.
Once the Boltzmann–Matano interface is known, the interdiffusion coefficient can be calculated for any given composition. Continuing with Mg–Nd as an example, the relationship used for calculating D˜10,11 from the meas-ured concentration profile shown in Fig. 8 is
D˜ = − 1
2t 1
冉
dC dx冊
兰
c1 cxdC , (1)
where D˜ is the interdiffusion coefficient at composition
C, t is annealing time, dC/dx is the slope at the
compo-sition C, and 兰c1 c
is the integrated area of the cross-hatched area.
In Eq. (1), the value of D˜ at a given C is calculated by measuring the area兰c1
c
xdC and the slope at that
compo-sition point (dC/dx). For all interfaces in the diffusion
couples studied, the composition used for calculating D˜ was that of the Boltzmann–Matano interface. For the Nd/MgNd interface, (dC/dx) is −32649.6 at.% Nd/cm,兰c1 c
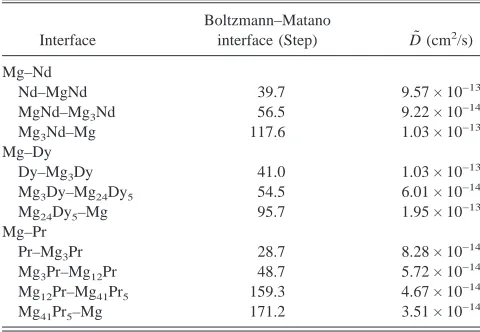
is 0.0225 at.% Nd cm, thus D˜ is 9.57 × 10⁻¹³cm2/s. Similar calculations for the remaining interfaces in the Mg–Nd, Mg–Dy, and Mg–Pr diffusion couples yield the results shown in Table III.
Observation of the calculated values shows that all the interdiffusion coefficients in the systems studied are similar—on the other of 10−13to 10−14cm2/s. The Mg– Pr system seems to be the slowest of the three while diffusion between Mg and Nd occurs the quickest of all the phases.
Note that the data of Table III presents interdiffusion coefficients between the associated phases and is not a calculation of the intrinsic diffusion coefficient DMgof Mg in the rare-earths or DREof the rare earth in magne-sium. Calculation of such values is extremely difficult in
FIG. 7. (a) The Mg–Pr concentration profile obtained using EDS analysis. (b) Phase diagram of Mg–Pr (from Ref. 7).
FIG. 8. (a) Close-up of the composition profile of Nd obtained from the SEM showing transition from pure Nd to MgNd, steps 21 to 56. (b) The determination of Boltzmann–Matano interface in Mg–Nd compo-sition profile (see text).
Y. Xuet al.:Analysis of interdiffusion of Dy, Nd, and Pr in Mg
[image:7.612.270.546.79.466.2] [image:7.612.71.419.81.477.2]a diffusion couple containing multiple phases since the formation of each intermetallic layer presents a new set of initial and boundary conditions for solution of Fick’s equations. Accurate determination of the intrinsic diffu-sion coefficients requires modification of the experimen-tal parameters by placing markers to preserve the position of the original location of the interface and shorter aging times to prevent intermetallic phase formation.
Previous measurements of diffusion of rare earths5,6 have resulted in values of the intrinsic diffusion coeffi-cients that are several orders of magnitude higher than the calculated interdiffusion coefficients of Table III. This indicates that diffusion through the intermetallic compounds acts as the rate-controlling step in diffusion couple systems similar to those studied.
V. SUMMARY AND CONCLUSIONS
Diffusion couples in the Mg–Nd, Mg–Dy, and Mg–Pr systems were studied by energy dispersive x-ray spec-troscopy with a scanning electron microscope. The inter-metallic compounds observed have been noted in previous studies; however, several phases that might have been expected to be present were absent. This was especially true of those compounds high in rare-earth content. Several phases were also seen to exist over a compositional range rather than at the single fixed com-position of a line compound indicated on present phase diagrams. The proposed phase diagrams examined are incomplete and contain a large amount of uncertainty, presumably due to the difficulty of working with Mg. The high purities of the materials used in this study may
have affected the phases observed. Longer aging times also may be necessary to obtain formation of the high-rare-earth compounds.
An x-ray EDS line scan technique was used to deter-mine the composition profile from pure Mg, through the single-phase intermetallic layers, into the pure rare earths. These measurements allowed calculation of the Boltzmann–Matano plane positions and interdiffusion coefficients independent of the diffusion behavior in the individual phases. The interdiffusion coefficients D˜ at the Boltzmann–Matano interfaces of elements and inter-metallic phases in the Mg–Nd, Mg–Dy, and Mg–Pr sys-tems were on the order of 10−13 to 10−14cm2/s, with diffusion in the Mg–Pr system being the slowest. These values are 4–5 orders of magnitude lower than diffusion rates estimated for pure rare earths in Mg.
ACKNOWLEDGMENTS
The authors acknowledge the work of N. Beymer and C. Gross of the Ames Laboratory Materials Preparation Center for preparing and analyzing the materials used in this study. The guidance of B. Gleeson and R. Trivedi is especially appreciated. This work was partially funded by a Carver Trust grant from ISU and was performed at Ames Laboratory, operated for the United States Depart-ment of Energy by Iowa State University under Contract No. W-7504-Eng82.
REFERENCES
1. R. Ferro, A. Saccone, and S. Delfino, Metall. Sci. Technol. 16, 25 (1998).
2. Y. Mukhina, V.M. Lebedev, K-H. Kim, and I-B. Kim, J. Adv. Mater. 3, 362 (1996).
3. G. Neite, K. Kubota, K. Higashi, and F. Hehmann, in Materials
Science and Technology. A Comprehensive Treatment, edited by
R.W. Cahn, P. Hassen, and E.J. Kramer, Vol. 8.
4. Structure and Properties of Nonferrous Alloys, edited by K.H. Matucha (VCH, Weinheim, Germany, 1996), pp. 113–212. 5. K. Lal and V. Levy, Comptes Rendus Acad. Sc. Paris, Vol. 262,
Jan. 1966, pp. 107–109.
6. Y. Xu, L.S. Chumbley, and F.C. Laabs, J. Mater. Res. 15, 2296 (2000).
7. Binary Alloy Diagram, edited by T.B. Massalski (ASM, Metals Park, OH, 1986), Vol. 2.
8. Pearson’s Handbook of Crystallographic Data for Intermetallic
Phases, edited by P. Villars and L.D. Calvert (ASM, Metals Park,
OH, 1986), Vol. 1–3.
9. G.H. Geiger and D.R. Poirier, Transport Phenomena in
Metal-lurgy (Addison-Wesley, 1980), p. 482.
10. P.G. Shewmon, Diffusion in Solids (TMS, Warrendale, PA, 1989), pp. 131–148.
[image:8.612.57.297.109.275.2]11. M.C. Petri and D.D. Keiser, Jr., Scripta Mater. 37, 821 (1997). TABLE III. Calculated interdiffusion coefficients D˜ at the Boltzmann–
Matano interface for the systems studied.
Interface
Boltzmann–Matano
interface (Step) D˜ (cm2/s)
Mg–Nd
Nd–MgNd 39.7 9.57 × 10⁻¹³
MgNd–Mg3Nd 56.5 9.22 × 10
−14
Mg3Nd–Mg 117.6 1.03 × 10
−13
Mg–Dy
Dy–Mg3Dy 41.0 1.03 × 10
−13
Mg3Dy–Mg24Dy5 54.5 6.01 × 10 −14
Mg24Dy5–Mg 95.7 1.95 × 10
−13
Mg–Pr
Pr–Mg3Pr 28.7 8.28 × 10
−14
Mg3Pr–Mg12Pr 48.7 5.72 × 10 −14
Mg12Pr–Mg41Pr5 159.3 4.67 × 10⁻¹⁴
Mg41Pr5–Mg 171.2 3.51 × 10⁻¹⁴
Y. Xuet al.:Analysis of interdiffusion of Dy, Nd, and Pr in Mg