City, University of London Institutional Repository
Citation:
Popov, P. T. (2017). Models of Reliability of Fault-Tolerant Software Under
Cyber-Attacks. doi: 10.1109/ISSRE.2017.23 ISSN 2332-6549
This is the accepted version of the paper.
This version of the publication may differ from the final published
version.
Permanent repository link:
http://openaccess.city.ac.uk/18570/
Link to published version:
http://dx.doi.org/10.1109/ISSRE.2017.23
Copyright and reuse: City Research Online aims to make research
outputs of City, University of London available to a wider audience.
Copyright and Moral Rights remain with the author(s) and/or copyright
holders. URLs from City Research Online may be freely distributed and
linked to.
City Research Online:
http://openaccess.city.ac.uk/
[email protected]
Models of reliability of fault-tolerant software under
cyber-attacks
Peter Popov
Centre for Software Reliability City, University of London
Northampton Square, London, EC1V 0HB, UK
Abstract — This paper offers a new approach to modelling the effect of cyber-attacks on reliability of software used in industrial control applications. The model is based on the view that successful cyber-attacks introduce failure regions, which are not present in non-compromised software. The model is then extended to cover a fault tolerant architecture, such as the 1-out-of-2 software, popu-lar for building industrial protection systems. The model is used to study the effectiveness of software maintenance policies such as patching and “cleansing” (“proactive recovery”) under different
adversary models ranging from independent attacks to sophisticated
synchronized attacks on the channels. We demonstrate that the ef-fect of attacks on reliability of diverse software significantly de-pends on the adversary model. Under synchronized attacks system reliability may be more than an order of magnitude worse than under independent attacks on the channels. These findings, alt-hough not surprising, highlight the importance of using an ade-quate adversary model in the assessment of how effective various cyber-security controls are.
Keywords— probabilistic model, software reliability, software fault-tolerance, on-demand software, adversary.
I. INTRODUCTION
Cyber-security has affected everyday lives: cyber-fraud is widely spread, serious accidents with safety-critical systems caused by cyber-attacks have been reported. Cyber-security has become a topic affecting even politics1.
Cyber-security assessment has matured in the last decade2.
Yet, recommendations to deploy specific security controls are often made with no quantification of the benefits these are likely to bring about to a particular system. The assessment results, es-pecially when qualitative assessment techniques are used, are of-ten difficult to reproduce. Decision makers have difficulties to answer rationally practical questions such as: “How much should I invest in improving cyber-security?”, “After spending the available budget on additional cyber-security controls how much better is my system? Have I done enough to secure my system?”
1 There have been reports of a foreign state attempting to
af-fect the results from the referendum for Scottish independence in 2014, the presidential elections in the US in 2016 and in France in 2017.
Software reliability engineering, on the other hand, has been a mature discipline for several decades. The concept of software reliability and the factors that affect it are well understood. In many industries, high software reliability is achieved following a well-understood process for software reliability assessment.
Software faults (e.g. buffer overflow, etc.) make software vulnerable. Technical literature offers in abundance ingenious tricks that researchers have found to work in specific cases, e.g. obfuscation [1], which can help with a class of vulnerabilities. Often these solutions are taken and applied to a different context
without proper analyses of how the new context will affect the effectiveness of the solutions that worked well elsewhere. For instance, in [2] the authors use software diversification via ob-fuscation at compilation time to produce unique replicas. This makes the same attack “unlikely to succeed on any two vari-ants”. Obfuscation is also used in intrusion tolerant solutions based on software replication, in which Byzantine agreement protocol [3] among replicas is used. This protocol is guaranteed to work correctly only if certain sufficient conditions on the number of simultaneously compromised replicas are met. Ob-fuscation is seen often as a way of meeting these sufficient con-ditions with high confidence. Such a belief, however, may be ill-founded. As pointed out in [1], variants, obfuscated differently, may crash on the same attack. This, in turn, may lead easily to a violation of the sufficient conditions for the Byzantine agree-ment protocol to work correctly.
Dealing adequately with cyber-threats requires credible as-sessment of the effectiveness of cyber-security controls de-ployed in a particular system. In this paper we develop probabil-istic models and use them to analyze the relationship between software reliability and the properties of the anticipated cyber-attacks. Our models are built deliberately to operate at a rela-tively high level of abstraction, which makes them applicable to a large class of systems, irrespective of the specific technology used in system design, and suitable to compare the benefits that different cyber-security controls can bring.
Probabilistic model for assessment of software reliability and
2 A range of standards deal with the assessment of risk from
system safety are widely used today. All major international safety standards recommend the use of probabilistic models. Probabilistic modelling has been useful not only in quantitative reliability assessment, but also in addressing some serious mis-conceptions. A well-known example is the N-version program-ming. Many believed at the time that a separation of develop-ment teams would result in independent failure of software chan-nels. Using probabilistic modelling Eckhardt and Lee [4] showed the fallacy of this belief. Independent development does not guarantee failure independence. Using a similar style of probabilistic modelling in own work [5]we studied how different testing regimes – with individual oracles or back-to back – com-pared when applied to fault-tolerant software.
These past successes motivated the work presented in this paper. We apply a similar style of conceptual probabilistic mod-elling to both accidental failures and to the effects of cyber-at-tacks on a specific software system and compare the benefits for fault-tolerant software of several popular software maintenance policies.
The modelling approach presented in this paper was devel-oped with cyber-physical systems (CPS) in mind. In such sys-tems software interacts (controls, monitors, etc.) with tangible assets in circumstances, which typically provide no scope for data theft. We hope, despite the focus, that some elements of the work might be useful for a broader class of software systems.
The contributions of the paper are as follows:
• A conceptual model of software reliability in adverse envi-ronment, which accounts for the effects of successful cyber-attacks on software reliability. The model is ex-tended and applied to a 2-channel software system.
• A study of how different maintenance policies, such as software patching and software “cleansing” [6], also known as “proactive recovery” [7], (i.e. periodically restor-ing software to a clean copy, eliminatrestor-ing the consequences of successful cyber-attacks) compare under different sce-narios of cyber-attacks.
• A SAN model (Stochastic Activity Networks), used in the studies, is released in the public domain. This can be used by others to analyse practical scenarios of interest. The paper is organized as follows. Section 2 introduces in-formally the problem that we study in the paper. Section 3 for-mulates a stochastic model of how cyber-attacks affect software reliability. Section 4 presents the main results from the compar-ison of the efficacy of software patching and cleansing under a range of attack scenarios. In section 5 we discuss the implica-tions of our findings. Section 6 summarizes the related research. Finally, section 7 concludes the paper and outlines directions for future research.
3 We ignore the complication that processing a demand may
result in a partial failure. We believe, that with a suitable defi-nition of a test for correctness, this difficulty usually can be overcome.
II. INFORMAL PROBLEM STATEMENT
Consider “on-demand” software, i.e. software, which re-ceives demands for processing from its operational environment. Typical examples of on-demand software are various protection systems, e.g. of a nuclear power plant or of any other process control plant. In such systems safety is typically achieved by de-fining a safe-state, which the system can enter should the con-trolled process deviate from the intended safe envelop of opera-tion. The sole purpose of a protection system (typically imple-mented in software) is to react to such deviations. Demands, pro-cessed correctly, will bring the plant to the predefined safe state.
Processing a demand by a protection system may involve a very complex sequence of inputs coming from the operational environment – from the initial signal (e.g. that the pressure in a nuclear reactor has exceeded the normal/acceptable level), fol-lowed by software reading multiple sensors until the anomaly is established with certainty (or high degree of confidence) and then a transition of the plant to a safe state is executed as needed. We call this entire sequence of sensor readings and transition to a safe state a demand. Typically, a complex plant may deviate from its safe operation in many different ways, hence, many dif-ferent demands on the protection system are possible. Each de-mand is processed either correctly or may result in a failure3.
Now consider the space of cyber-attacks on on-demand soft-ware. Attacks, or malicious demands, on a computer platform target various assets that have some value for the attacker, e.g. stealing personal details, such as a bank account, private infor-mation such as documents, photos, etc. Examples of malicious demands closer to the particular context of industrial applica-tions would be causing malfunction of equipment, disrupting a protection system, eliminating a safe-state, etc. Providing an ex-haustive enumeration of malicious demands is outside the scope of the paper.
Outside the scope of this paper are also malicious demands, which cause the attacked software (or the computer platform) to fail immediately. In some cases, defense mechanisms, e.g. the above mentioned obfuscation at compilation time, can block the attack by causing software to crash. Our main concern are suc-cessful attacks which do not lead to immediate failures but make the software less reliable. In other words, our interest centers upon situations, in which successful attacks cause software fail-ures in the future, which without the malicious demands would not have occurred. The advanced persistent threats (APT) which seek to compromise software, remain invisible and cause harm in the future, fall within this category.
payload that they deploy to harm the targeted assets4. Many
ma-licious demands include carefully crafted routines to erase any traces of a successful malicious demand [9]. Payloads of attacks on specialized process control software lead to lasting alterations of the operation of targeted software. Examples of such threats seen in the past have been documented for different versions of Stuxnet: i) the well documented version 1 of the worm [8] caused harm to the centrifuges used in Iranian enrichment plants by providing incorrect readings about the rotation speed of the cen-trifuges; ii) an earlier version of the worm – v0.5 [10] – would periodically force various valves in installations to close tempo-rarily, which would cause a pressure rise in pipes. This in turn would affect the production output and even cause physical dam-age.
Modelling the consequences of malicious demands on the failure behavior of targeted application software is the main fo-cus of this paper.
Corrective software maintenance (often referred to as patch-ing) fixes bugs that cause software failures irrespective of whether software has been subjected to successful malicious de-mands or not. In some cases, maintenance is focused on elimi-nating bugs which may cause failures in operation; in some other cases patching targets specifically known vulnerabilities, which could be exploited by malicious demands. A special form of maintenance is software “self - cleansing” [6] (referred to as
cleansing for short), in which application software (or the entire platform) is restored to a system state believed to be clean from the effects of malicious demands. Cleansing has been adopted in “proactive intrusion-tolerance” solutions. We model these maintenance policies and study the benefits from them when they are applied to software either in isolation or together.
III. FORMAL MODEL DEFINITION
A. Software Reliability
Let us consider the space of demands, D={x1, x2, … xn}, for
a particular on-demand software product, π, with a probabilistic measure, (∙), defined on D. (∙), known as the operational profile, captures the likelihood of demands being submitted to π. The failure process of π in operation is captured by a score function, defined on demands as follows, [11]:
( , ) = 0, 1, ℎ
Probability of failure (pfd) of π on a randomly chosen de-mand, X, is then:
( ) = ∑ ( , ) ( ) (1)
B. Model of malicious demands
Now consider the space of malicious demands, Λ = {µ1,µ2,
…, µn} that can be submitted to by adversaries at random
mo-ments in time. Each malicious demand either succeeds or fails in
4 Different attacks may use similar delivery mechanism –
Stuxnet and Flame are examples – but deploy very different
deploying its payload. We capture this outcome by defining an-other score function:
( , ) =
1, ℎ
0, ℎ (2)
The score function of compromised by a successful mali-cious demand y, denoted by ( , ), becomes:
( , ) = 1,
0, ℎ
(3)
∅( , ) could be used to denote the score function of software
before it has been affected by a malicious demand. We expect that the values of ∅( , ) on some demands will be altered by
a successful malicious demand. More specifically, we assume that some scores will change from ∅( , ) = 0 to ( , ) = 1. We do not expect, that a malicious demand will lead to a fail-ure compensation, i.e.:
( , ) ≥ ∅( , ) (4)
The reader will have noticed that this formulation of the im-pact of a malicious demand on extends naturally to any quence of malicious demands applied to . Indeed, for a se-quence, , , … , we could define a set of score functions:
∅( , ), ( , ), ∧ ( , ), … , ∧ ∧…∧ ( , ) (5)
where ∧ , …, ∧ ∧ … ∧ are labels used to signify the combined effect of a sequence of malicious demands, ( , ), …, ( , , … , ).
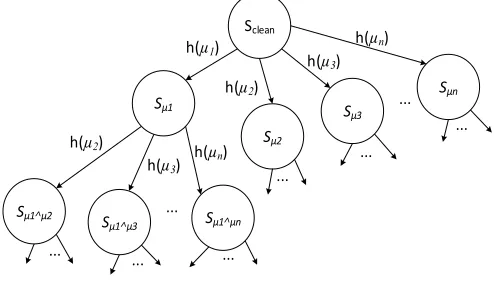
We will use ( , ) to denote the score function of at any stage, , of software operation, where can take values from the set ∅, , , … , ∧ , … , ∧ ∧ … ∧ . The evo-lution of ’s state, as a result of successful malicious demands, is illustrated in Fig. 1.
...
... h(µ1)
h(µ2)
h(µ3) h(µn)
h(µ2)
h(µ3) h(µn)
...
... ...
... ...
Sµ1˄µ2
Sµ2
Sclean
Sµ1 S
µ3
Sµn
Sµ1˄µ3 Sµ1˄µn
[image:4.612.314.561.473.618.2]...
Fig. 1. Evolution of software state as a result of successful malicious demands and in the absence of maintenance. There is a one-to-one mapping between the score function, ( , ) and the state, , shown in the diagram. The transitions between the states are labelled with h(µi) to
signify the hazard rates, [12], associated with the respective transitions.
We do not discuss whether the order of malicious demands in a sequence is important. Our chosen notation, however, does allow one to account for it, if necessary.
C. Failure regions.
The demand space of any non-trivial software is typically as-tronomical. Empirical studies, e.g. [13], have demonstrated that software faults are projected on the demand space as failure re-gions. That is, the same fault can be triggered by a number of
different demands, which together form a failure region of de-mands, on which software fails.
We are not aware of systematic studies to establish whether the concept of failure regions applies to cyber-security attacks. We see no reasons, however, why it should not apply. The anal-yses of Stuxnet [8] and of Flame [9] suggest that malware does indeed create new failure regions in the compromised software. Now we will use the concept of failure regions to model the effect of malicious demands on compromised software. We first introduce a number of additional notations. Let FR = {fr1, fr2, …
frn} be the set of all potential failure regions that might be
acti-vated in a piece of software, π, as a result of at least one mali-cious demand. Each failure region is a collection of normal de-mands, = ( ), ( ), … , ( ) , on which software fails. In our model failure regions do not overlap, i.e. ∩ = ∅, ≠ . This assumption is made for convenience – and builds upon our previous work [14]. Later, in section Fig. 7, we discuss ways of relaxing the assumption. We characterize a failure region, fri, by
its size, P(fri), which represents the probability of selecting at
random a demand ( )that belongs to this failure region, fri.
D. Malicious demands.
We define a set ( ) = ( ), ( ), … , ( ) where
( )
∈ | = 1 … and use it to model the effect of
mali-cious demand on target software should be applied suc-cessfully to software.
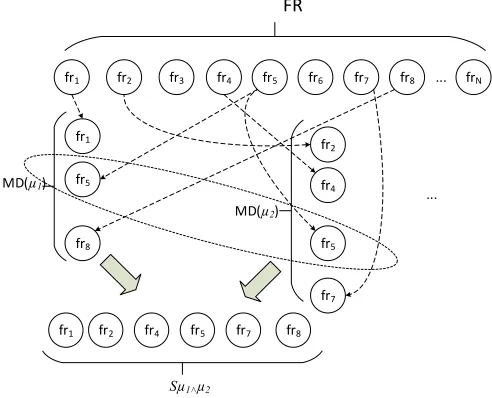
In a non-compromised software, none of the regions in FR is active. If a malicious demand µiis successfully applied to
soft-ware, then all failure regions in ( ) become active in this software (Fig. 2).
We characterize the sets FR and Λ via model parameters. The size of FR is explicitly defined as a model parameter and so is the max number of failure regions, max, per malicious de-mand: the actual size of each set, ( ), is a random number, uniformly distributed in [1, max], where max is a model param-eter. A probability distribution over FR is defined, which gov-erns the allocation of failure regions to the sets, ( ).
Each malicious demand, , is also assigned a probability of success, ( ) and a distribution ( ≤ ) of time be-tween the occurrences of instances of in operation.
Finally, with more than one malicious demand we need a model to define how the malicious demands occur: for this we use the competing risks model [12]. The joint distribution of the competing risks – the risks can be independent or non-independ-ent – at any momnon-independ-ent in time defines the adverse environmnon-independ-ent.
fr1 fr2 fr3 ... frN
fr5
fr1
fr8
fr4 fr5 fr6 fr7 fr8
FR
MD(µ1) fr4
fr2
fr5
fr7
MD(µ2)
...
fr1 fr2 fr4 fr5 fr7 fr8
[image:5.612.321.567.57.256.2]Sµ1˄µ2
Fig. 2. Relationship between failure regions, malicious demands and the state of the compromised software. Active failure regions increase the pfd of compromised software. In the particular example shown in the figure, two
malicious demand, ( ) and ( ) consist of 3 and 4 failure
regions, respectively. The failure region, fr5 is common for the two
malicious demands. Therefore, when both, ( ) and ( ), are
applied successfully to software, the total number of active failure regions will be 6. The failure region fr5, which is common for both demands, is
activated by the malicious demand which is first to succeed.
E. Software Maintenance
The effect of maintenance on the maintained channels is summarized as follows:
• Cleansing: cleansing removes all failure regions activated by successful malicious demands. The channel’s pfd is thus restored to the value it had before malicious demands. Cleansing has no impact on the probability of success of future malicious demands: these probabilities remain the same as before cleansing, since cleansing does not fix any exploitable vulnerabilities. Clearly, since cleansing does not fix the exploitable vulnerabilities, cleansing may be faced with an increasingly adverse environment: once an exploitable vulnerability has been discovered and exploited once by a malicious demand, it could be exploited again and again, possibly with an increasing rate.
• Patching: the model allows for the channel’s pfd to de-crease as a result of some faults, unrelated to exploitable vulnerabilities, being fixed. The magnitude of this decrease is a model parameter. Patching may also affect the proba-bility of success of some malicious demands in the future, possibly reducing it to 0, as a result to fixing exploitable vulnerabilities. We use another model parameter to capture the specific assumptions related to this reduction of the probability of success by malicious demands.
Patching and cleansing occur at random points in time Ξ =
, … , . The state of software, captured by the
correspond-ing ( , , ) and summarized by its pfd, changes at these
of the transitions between the states (transitions to SdownC) in the
stochastic process defined in Fig. 3.
cleansing
cl
ea
n
sin
g
pa
tc
h
ing
2
Sclean Sclean2 Sclean3
SdownC
SdownC SdownP
SdownC SdownP SdownP
Si
Sj Si
Sj ...
...
cleansing
... ...
... ...
...
... ...
...
... ...
cl
e
an
sin
[image:6.612.49.293.84.240.2]g
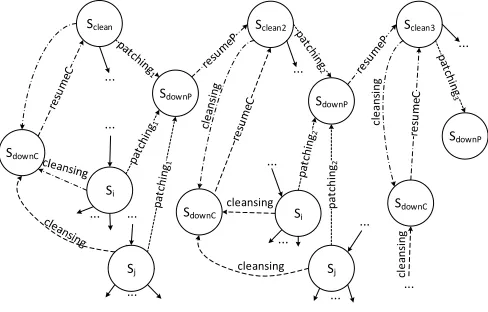
Fig. 3. Illustration of the stochastic process describing the evolution of a channel under maintenance. Software state changes as a result of successful malicious demands applied to it (shown as solid arrows in the figure) and due to maintenance (cleansing/patching). Maintenance itself is completed in a state SdownC/P, (for cleansing and patching, respectively):
in these states the software is not operational. After maintenance the channel operation is resumed from a clean state (Sclean, Sclean2, Sclean3, …).
The models of cleansing and patching are similar: they are described by respective stochastic processes, which define the distribution of the intervals between the successive applications of maintenance, ( ≤ ) and ( ≤ ), for patching and cleansing respectively.
These processes can be constrained, e.g. simultaneous maintenance of more than one channel may not be allowed to guarantee that at least one channel is always operational, as rec-ommended by some standards, e.g. [15].
Maintenance duration may vary significantly depending on the size of the software state (i.e. useful data used by software) that needs to be migrated after maintenance to a clean copy. Some authors, e.g. [16], report that this may take seconds, minutes and even hours. Examples of techniques to minimize this duration are: i) on-the-fly patching [17]; ii) adding spare channels before some channels are taken down for maintenance [18], [16], etc. In our model the duration of maintenance is de-fined as a model parameter, which we varied in different studies.
F. The 1-out-of-2 system
The model of 1-out-of-2 on-demand software adds complex-ity since the system now consists of two channels. Let us denote the channels used in the 2-channel system as (channel A) and (channel B), respectively. The probability of failure of such a system can be expressed as, [11]:
( , )
= + ( , ), ( , ) (6)
The covariance term, ( ), ( ) , is a measure of failure dependence between the two channels. The covariance is 0 if the channels fail independently.
( , ) represents the systempfd and will be
af-fected by the malicious demands and the maintenance of the channels. At any point in time, the failure behavior of the 2-channel software system is characterized completely by the tu-ple (pfdA(t), pfdB(t), pfdsystem(t)).
During a channel maintenance, the system operates as a sin-gle channel system and the system pfd is reduced to the pfd of the operational channel. As soon as the channel maintenance is complete, the system pfd is restored to the value it had prior to a successful malicious demand being applied to the channel whose maintenance has just been completed.
Malicious demands, via their respective, ( ) sets, affect the channel pfd and may also affect the system pfd. If the same failure region, fri, is activated in both channels (by respective
malicious demands applied to the channels), this region becomes a “common failure” region for both channels and its size is added to system pfd.
With 2-channel software, there is scope for variation in how malicious demands occur. We consider two important cases: the set of malicious demands on the channels may be either identi-cal, i.e. Λ1≡Λ2, or different.
• Synchronised attacks (Λ1≡Λ2). This case would be an
ap-propriate model if the adversary is aware of the underlying 2-channel architecture. This adversary will be aware that attacking a single channel will have no immediate effect: even if an attack on the channel is successful, the system may remain unaffected, if the second channel is non-com-promised. The Adversary, therefore, will seek to compro-mise both channels by attacking the system with malicious demands crafted specifically for each of the channels.
• Independent attacks. The model with different sets of ma-licious demands (Λ1≠Λ2) would be appropriate to model
the behaviour of an adversary unaware of software archi-tecture and who would attack one of the channels, e.g. se-lected at random. Common failure regions with different sets of malicious demands may still occur (e.g. if malicious demands and are applied to channel A and channel B, respectively, and a failure region exists which happens to belong to both ( ) and . The system pfd
thus will be increased by the size of the common failure region, . Such common failure regions are generally less likely with different sets of malicious demands than with the same set of demands.
With a 2-channel system a reasonable policy would be to subject to maintenance at most one channel at a time [19], which in our model of cleansing/patching is achieved by implementing a maintenance mutex.
IV. RESULTS
In this section we use the model described in Section III to answer a number of questions:
in fact reduce dependability. Indeed, the benefits, of cleans-ing are questionable: an advanced persistent threat (APT) that has successfully compromised a piece of software once is likely to persist and likely to compromise it again and again, probably taking increasingly shorter time to compro-mise a replica after cleansing.
• To patch or not to patch? Again, patching is a standard pol-icy adopted for consumer devices, data centres and “enter-prise” solutions. Patching industrial control systems, how-ever, is a very expensive operation. Problematic patches, too, are not uncommon and some standards prescribe rig-orous procedures to address this concern [15]. In practice, many operators of critical infrastructures are reluctant to patch [19]. Often operators are prepared to postpone patch-ing as long as they can. We compare the reliability of un-patched and un-patched software to illustrate the risks of not patching. We also look at the impact of different patching policies: i) patching as soon as a patch becomes available (implicitly assumed so far), and ii) deferred patching, e.g. when a channel is only patched when the channel has been detected as compromised. In our study the detection of a channel compromise is delegated to an intrusion detection system (IDS) with imperfect intrusion coverage.
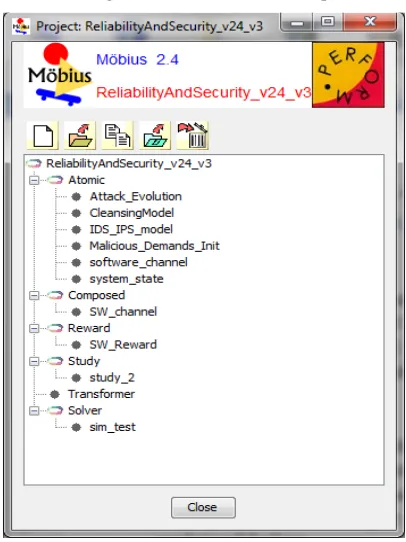
[image:7.612.69.272.388.659.2]In this section we present a number of results obtained with a probabilistic model(s) built with Mobius [20] using the sto-chastic activity networks (SAN) formalism. We solved the model(s) via Monte-Carlo simulation. The structure of the model(s) is shown in Fig. 4. It consists of a number of atomic models and a composite model, which links instances of the atomic models using the mechanism of shared places.
Fig. 4. Structure of the SAN model.
For lack of space we omit the implementation details of the model. However, the entire SAN project is available online [21]
and the interested reader can analyze the model in detail. The project includes extensive custom C code, necessary for model initialization: i) creation of the set of failure regions (100 failure regions were used in the conducted studies), ii) creation of a number of malicious demands applicable to a channels using a set of parameters explained below, etc.
The initial pfds of the channels and of the system are also defined to represent a realistically reliable on-demand software: the channel pfd is assumed 2×10⁻³ for both channels; the system
pfd is assumed 10-4. These values define a system with a high
positive correlation of channel failures, which is not uncommon.
A. Model parameterisation and studies
The essential model parameters together with the values used in the studies are provided in TABLE I.
Malicious demands on each channel are run as competing risks – the winner (i.e. the malicious demand that occurs first) is applied to the respective channel by activating the failure regions in the demand space of that channel, thus increasing the chan-nel’s pfd. System pfd may also be affected due to new common failure regions that may occur as a result of the latest successful malicious demand. The competition between the risks (i.e. mali-cious demands) is then resumed until the next winner occurs, etc.
We utilize the built-in capability of Mobius to design a “study” [20], i.e. a number of experiments with different values assigned to model parameters.
We use a set of global variables, which allow us to change the logic of the simulation as necessary so that different scenar-ios - with or without patching and/or cleansing - are enabled or disabled.
The experiments conducted can be grouped into the follow-ing 4 categories:
• A 2-channel system with no maintenance (NC NP). Both cleansing and patching of channels are disabled.
• A 2-channel system with cleansing only (C NP). Cleansing of channels is enabled, their patching - is disabled.
• A 2-channel system with patching only (NC P). Patching of channels of enable, cleansing – is disabled.
• A 2-channel system when both patching and cleansing are enabled (P C).
In all scenarios we simulated a mission of 350 days of oper-ation, almost a year of calendar time, and looked at two related “rewards”: the system pfd (as a “time averaged” mean) and the probability to survive a mission of up to 350 days – in intervals of 10 days. We show estimates of the average system pfd calcu-lated over intervals of 50 days to illustrate trends in system pfd
over time. Each study was repeated 300 times and all rewards - calculated with confidence level of 95% and a relative confi-dence interval of 10%. In a very few cases we increased the num-ber of runs to 500 to achieve the required confidence level.
TABLE I. THE ESSENTIAL SAN MODEL PARAMETERS AND THE VALUES ASSIGNED TO THEM IN THE STUDIES
Name Description Value
FR_size [day-1] Failure region sizes (uniformly distributed). Each newly activated failure region (due to a successful
malicious demand) will increase the channel’s pfd by this random number.
1.00E-04 – 2.00E-4
attackRateIncrease [day-1] Sets the rate increase of malicious demands over time.The change to attack rate is applied upon
patching (a modelling assumption). The rationale here is as follows: once a vulnerability has become a “public knowledge” (or known to the adversary), it is likely to be exploited with an increased rate.
0.001
attackSProb_reduction Coefficient of reduction of malicious demand probability of success. Captures the effect of patching
on the probability of success of malicious demands. 0.95
ch1_pfd Channel 1 initial pfd (before any malicious demand sufcceeded to compromise software). 0.002
ch2_ pfd Channel 2 initial pfd (no malicious demands) 0.002
cleansing_interval [day] Interval between cleansings of channels (if cleansing enabled). Fixed value. 1
common_pfd System pfd (before any channel has been compromised). 1.00E-04
delay_sync_attack [day] Delay between channel attacks in case of synchronised attacks. 0.05
demand_rates [day-1] Malicious demands rates (exponential distributions). 0.01-0.07
demand_types Number of different malicious demands to channel 1 and channel 2. In the studies the same number
is assumed for both channels, but the implementation allows differerent values to be assigned to channel 1 and channel 2.
10
m_demand_max_FRs Maximum number of failure regions per malicious demand. The model assumes the same value for
both channels. The actual number of failure regions per malicious demand is a random number chosen from the range [1, m_demand_max_FRs] using a uniform distribution.
10
normal_demands_rate [day] Interval between normal demands on system 1
patchingInterval [day] Interval between patches (exponential distribution) 0.15
patch_ch_pfd_reduction Channel pfd reduction coefficient after patching. This parameter captures the effect of fixing bugs, other than exploitable vulnerabilities. Fixing such bugs may improve the operational reliability of the respective software channel(s)
0.9
patch_CC_pfd_reduction System pfd reduction coefficient after patching a channel which leads to fixing bugs that are not exploitable vulnerabililities.
0.95
upgrade_duration [day] Maintenance duration (fixed interval) 0.01
B. Cleansing vs patching
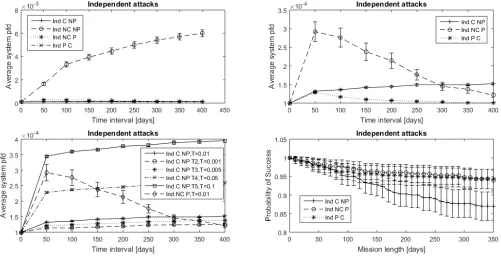
We start with a set of results conducted under the assumption of independent attacks and that maintenance takes 0.01 days (i.e. almost 15 min), a plausible number recorded by some, e.g. [18].
Patches are applied as soon as they become available. The results (Fig. 5) confirm that all forms of maintenance, including cleansing alone, improve system reliability very sig-nificantly. Without maintenance, system pfd rapidly grows.
[image:8.612.55.556.436.692.2]Interestingly, for the chosen parameterization, cleansing may outperforms patching (compare “C-NP” and “NC-P” plots), which is surprising. The trends of system pfd for the different scenarios provide further insight. We see a clear trend downwards for “NC-P”, and an increasing trend for cleansing “C-NP” (due to the simulated increase in the rate of repeated attacks). Up to 250 days of operation, the system
pfd with cleansing only is lower (i.e. the system is more re-liable) than the pfd with patching only. The two curves cross over in the interval 250 – 300 days of operation. After the 300th day of operation the system with patching only
be-comes more reliable.
When both cleansing and patching are used, not surpris-ingly, system pfd is the lowest (i.e. the system is the most reliable). The lower left plot demonstrates the effect of
cleansing duration (T) on system pfd. T was assigned values from the range [0.001, 0.1] days. Not surprisingly, long T eventually make cleansing universally inferior to patching. Shorter T makes cleansing more effective.
The last curve (bottom, right) shows the probability of surviving a mission (PS) for different maintenance policies. Cleansing only eventually becomes inferior to patching only: there is a clear stochastic ordering between PScleansing
and the PSpatching towards the end of the mission (250+ days).
The modes with patching – with and without cleansing (P-C and N(P-C-P, respectively) – are practically indistinguisha-ble.
C. Independent attacks vs. coordinated attacks
In this section we compare system pfd of a 2-channel system placed in two different environments: i) independent attacks, and ii) synchronized attacks on the channels.
We modelled the synchronized attacks by making an ad-ditional assumption: once a malicious demand is success-fully applied to one of the channels, the same demand is ap-plied to the second channel with a short delay, the value of which is defined by an additional model parameter,
de-lay_sync_attack. In the studies we set this parameter to 0.05
days (i.e. slightly over an hour) – a somewhat arbitrary value, chosen to be significantly smaller than the intervals of cleansing (a day) and the average interval of patching (once a week). Thus, a synchronized attack has a good chance of compromising both channels despite the adopted maintenance.
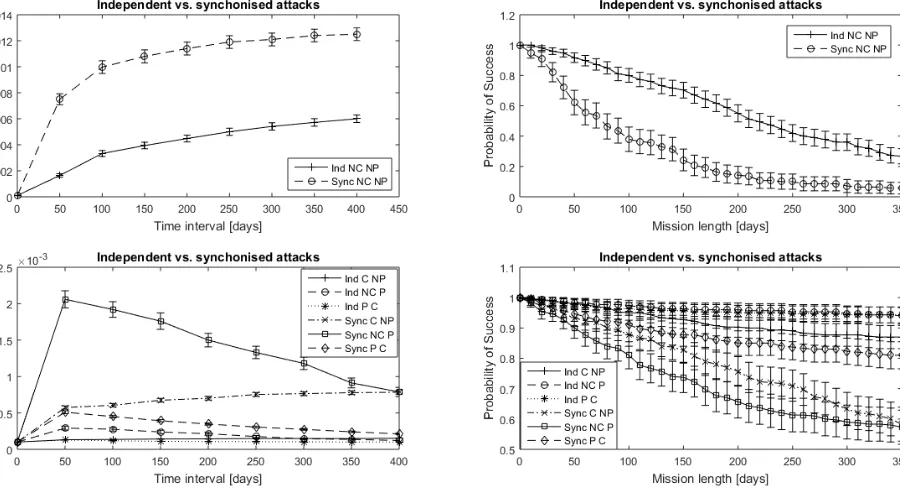
The results for synchronized and independent attacks for all 4 regimes are given in Fig. 6. The plots of system pfd
show that synchronized attacks make the system much
worse: stochastic ordering is established for both measures – system pfd and PS. Without maintenance (the plots in the upper half of the figure) under synchronized attacks system
[image:9.612.92.542.411.656.2]pfd eventually becomes more than an order of magnitude worse than under independent attacks. The plots in the lower half of Fig. 6 show how the two environments compare when maintenance is applied. Stochastic ordering is pre-served here, too: the curves representing synchronized tacks are above all curves representing the independent at-tacks. In other words, irrespective of the maintenance pol-icy, synchronized attacks make the system pfd worse than the independent attacks. Under synchronized attacks the ef-fect of maintenance policy is similar to what we observed with independent attacks: combined maintenance is best, second best is cleansing only. The worst performing policy is patching only. The crossover between the curves repre-senting cleansing and patching only occurs between 300 and 350 days.
Fig. 6. Independent vs. Synchronised attacks.
The plot with PS is also quite clear: when either
exists between the PS curves for independent and synchro-nized attacks after 200+ days. A combination of patching and cleansing is sufficient for a system under sync attacks to behave comparably to how it would behave under inde-pendent attacks: the corresponding PS confidence intervals overlap (i.e. the simulation does not show a clear ordering). This observation seems to suggest that, cleansing appears a very useful as a complementary control to patching, espe-cially under synchronized attacks!
D. Deferred patching
Finally we present results from a study, in which patch-ing a channel is deferred until the channel has been diag-nosed as compromised.
Clearly, deferring a patch will avoid some of the periods when the system operates as a 1-channel system, hence this regime may potentially improve system pfd. On the other hand, deferring a patch relies on detecting reliably that a
channel has been compromised. If detection is poor, a com-promised channel may remain unpatched even if a patch has become available, which may reduce system reliability. Our study sheds light on this interesting tradeoff.
The study of deferred patching is conducted for synchro-nized attacks only under additional assumptions: i) the checks/diagnosis if a channel has been compromised are un-dertaken at the time the particular channelis subjected to a
malicious demand; and ii) the success of the check/diagno-sis is not affected by whether the malicious demand has been successful or not. The intuition behind these modelling choices are that the intrusion detection/prevention system (IDS/IPS) will be triggered by a malicious demand, an as-sumption which may not hold true in some cases. In this study the channels were not subjected to cleansing. We model checks’ imperfection with a single parameter,
com-promise_detection_prob (CPD), applied to both channels.
[image:10.612.81.530.262.433.2]We study the effectiveness of deferred patching by assign-ing CPD different values from the range (0, 1).
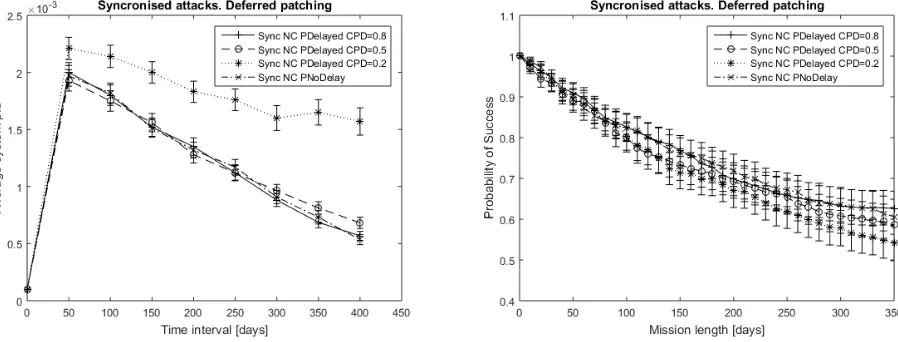
Fig. 7. Deferred vs immediate patching under synchronized attacks.
In the model implementation we also adopted the policy of cumulative patch, that is, the effects of all deferred patches, such as a possible reduction of channel and system
pfd and of the probability of success of the future malicious demands (due to removing/mitigating some vulnerabilities), are applied at once when the channel is eventually patched. This approach seems consistent with the industrial practice.
The results from the study are summarized in Fig. 7. Again, for the sake of brevity, we only show the results related to system pfd and the probability of surviving a mis-sion (PS) of a given length.
Clearly, CPD has a significant impact on system pfd. For values of CPD = 0.8 and 0.5, system pfd is practically indis-tinguishable from system pfd for the case with immediate patching – the three curves shown in the left hand plot of Fig. 7 are within the confidence intervals. Further statistical tests also provided no evidence to reject the null hypothesis that the mean values of the respective system pfd calculated over 500 simulation runs (used in this study) are different. The same similarity is observed with respect to PS for mis-sions of up to 350 days. We confirmed that the recorded dif-ferences between PS for missions of 200 and 350 days for CPD = 0.8 and 0.5 and immediate patching were statistically
insignificant. When CPD drops to 0.2, however, system pfd
increases noticeably – there is a clear stochastic ordering be-tween the curves for CPD = 0.2 and with the other 3 cases (CPD = 0.5, 0.8 and immediate patching). With respect to PS, the effect of CPD is less clearly pronounced in Fig. 7: the confidence intervals associated with the PS with differ-ent CPD clearly overlap. Using statistical tests we checked the null hypothesis “the PS with deferred patching with CPD = 0.2 and with immediate patching are equal” for mission lengths of 200 and 350. For significance level 0.05 this hy-pothesis was rejected. Thus, we confirmed that a system with deferred patching with low CPD = 0.2 has lower chance to survive a mission than a system, in which the pol-icy of immediate patching is used.
V. DISCUSSION
attacks is used in assessment, the assessment results may lead to dangerous overconfidence in system reliability; ii) undertaking assessment under the assumption of synchro-nized attacks, on the other hand, may lead to too pessimistic assessment results, in case synchronized attacks are made unlikely in the particular system, e.g. by deploying addi-tional controls which make synchronized attacks difficult. Synchronized attacks raise doubts about the benefits that one should expect from some intrusion-tolerant systems built on assumptions, which rule out multiple channels be-ing compromised simultaneously. The proposed style of modelling allows one to study the realism of an assumption that only a small number of channels can be compromised simultaneously.
Our findings support the view that cleansing may be quite effective in countering attacks, especially the synchro-nized attacks. This is particularly attractive, since the fre-quency of cleansing can be tuned to fit the needs of a partic-ular system. In contrast, the frequency of patching depends on software vendors and cannot be adapted to the needs of a particular system.
Our results suggest that deferred patching of fault-toler-ant software may be a reasonable alternative to the dominfault-toler-ant practice today – patch as soon as possible. Deferred patch-ing may deliver a comparable system reliability even when an IDS with relatively modest coverage is used. This is par-ticularly relevant given the additional delays recommended by some standards [15] to validate patches before their de-ployment. The final decision whether to deploy deferred patching or not for a particular system may require further, more detailed, analysis.
We already acknowledged that in our model malicious demands’ success is modelled as a “binary” outcome; par-tial success by a malicious demand has not been modelled. The implications of such a modelling choice are that either all failure regions associated with a particular malicious de-mand are activated or none is. The model could easily be extended to address this limitation. A partial success might imply that only a subset of failure regions is activated. The effect of such an extension is conceptually clear – partially successful malicious demand will make the situation no worse than the fully successful malicious demands. Thus, the results one obtains with the current model can be seen as
conservative bounds on channel/system pfd of software un-der attack.
The model presented in this paper belongs to the cate-gory of “conceptual” models. Similarly to [4, 5], which mo-tivated this work, and provides useful insight to support de-cision making when design choices, e.g. alternative mainte-nance policies, are analyzed and compared. This model helps improve one’s understanding, not least by applying sensitivity analysis to model parameters.
Some of the modelling choices, e.g. modelling malicious demands as sets of failure regions, were taken due to the
convenience they offer to build the model extending our pre-vious work. The underlying concepts, however, can be cap-tured making alternative modeling choices. We intend to work on models, suitable for practical assessment, which rely on parameters estimable via feasible measurements.
VI. RELATED RESEARCH
In addition to the references we used earlier in the paper to motivate the work and the modelling approach taken, we would like to outline a number of related sources.
A number of publications apply software reliability growth models to vulnerabilities, e.g. [22-24]. These authors acknowledge the fundamental difference between software reliability predicted for a “stable” operational environment and the profile defined by the adversaries for security. For the latter, the profile is unlikely to be stable. These models follow the tradition of reliability growth modelling and are focused on predicting the time to discovering the next vul-nerability. Instead, in our models we are primarily interested in the consequences of successful attacks on software relia-bility of a particular system. The predictions of time to next vulnerability are related to the time a new patch is released, which is used in our model as a set of model parameters.
There have been studies applying different modelling techniques to known attacks. A couple of examples are [25, 26]. The first reference applies a probabilistic technique to define a model of Stuxnet and demonstrates how the model parameters can be assigned plausibly. The second example, instead, uses a non-probabilistic formalism. These authors claim that documenting itself of the particular malware is an important contribution. Neither of the two models, however, is used by the respective authors for an analysis of open re-search problems. Our focus is quite different: instead of merely constructing a plausible model, we use the model as a tool to study practical problems such as the effectiveness of maintenance policies in adverse environments.
A somewhat related to this paper is our own previous work on modelling the effect on cyber-attacks on the relia-bility of an embedded device with fault-tolerant software [27]. The style of modelling there and in this paper is simi-lar, but the scope of the analysis is different. In [27]we de-veloped a detailed model of a specific device to study a spe-cific attack – on the safe-state of the device. In the current paper instead we develop a model, which operates intention-ally at a much higher level of abstraction and is used to com-pare different maintenance policies.
Synchronized attacks that we studied in detail are con-ceptually similar to common mode/cause failure, a topic which has been studied very extensively in the context of system/software safety and highly available computer sys-tem.
We would like to acknowledge the ADVISE formalism, a part of the Mobius tool used to implement our models. The ADVISE formalism captures probabilistically the motiva-tion of an Adversary, the assets of a particular system and the rewards that successful attacks will bring to an Adver-sary should an attack succeed. Although ADVISE is appli-cable to any system and assets, the level of abstraction this formalism uses is significantly higher than the level we chose in this paper – failure regions in demand space. We believe that modelling synchronized attacks on multi-chan-nel software systems with ADVISE will be more difficult than with the approach to modelling that we have adopted.
VII.CONCLUSION AND FUTURE WORK
We presented an approach to modelling the effect of cyber-attack on software reliability and applied it to a 1-out-of-2 on-demand software. We established a number of re-sults:
• We provide a new insight about the role of Adversary models in the assessment of benefits from software fault-tolerance. We recorded an order of magnitude difference in system pfd of a 2-channel software be-tween adverse environment with independent and syn-chronised attacks on the channels.
• Cleansing, despite being a relatively simple method of defence against cyber-attacks, can be quite effective, especially against synchronised attacks.
• Finally, we report on the existence of an interesting phenomenon related to a deferred patching of the chan-nels of a 2-channel software system. Deferred patching is an attractive alternative to immediate patching even with a modest probability of detecting a compromised software channel.
This work can be extended in a number of ways. First of all, most of the results that we presented are ob-tained with a complex model, which depends in a large num-ber of parameters. We did not explore systematically the space of model parameters and only scratched upon sensi-tivity analysis (Fig. 7). Ideally, we would have liked to be able to state some of our results as “theorems”, e.g. state-ments about the relationships between maintenance policies that are true irrespective of the values of the model parame-ters. Whether this is achievable or not is yet to be seen. We plan to extend the research effort in this direction.
Second, we left some aspect of the analysis incomplete. This is mainly due to the limited space a conference paper can offer. We envisage several important extensions of the work:
• We limited our work to the simplest fault-tolerant ar-chitecture – the 1-out-of-2 software – but referred sev-eral times to systems of significantly higher complex-ity such intrusion-tolerant architectures based on Byz-antine agreement protocol [1, 16, 18]. The proposed style of modelling seems applicable to such systems, too. These systems are said to be intrusion tolerant un-der a number of assumptions, which may hold true or be violated in operation. Applying the proposed method of modelling, especially with synchronised at-tacks, will provide insight about the likelihood that the conditions necessary for the intrusion-tolerant solu-tions to work correctly are satisfied in the adverse en-vironment anticipated in operation.
• Our model crucially depends on the view that mali-cious demands activate new failure regions, not present in software prior to successful malicious demands. This view is quite plausible, and consistent with the empirical evidence we have analysed. Further empiri-cal studies may provide additional insight and lead to further refinement of the modelling approach adopted in this work.
• We used the probability of system failure as one of the main measure of interest and limited our analysis to the
mean value (calculated over a number of simulation runs). It is clear that system pfd changes over time (as
Fig. 6 illustrates). We did not scrutinise the implica-tions of the recorded trends systematically, and con-sider this direction of future research worthwhile.
• As indicated in the discussion section, we plan to ex-tend this work towards models suitable from practical security assessment. A less detailed description of a 2-channel system evolving over time, e.g. using the triad (pfdA(t), pfdB(t) and pfdsys(t)), seems a promising
can-didate, more aligned with realistic measurements and with the statistical techniques we developed in the past, e.g. [29] and [30].
VIII.ACKNOWLEDGEMENT
This work was supported by the UK EPSRC CEDRICS project, part of the UK Research Institute of Trustworthy In-dustrial Control Systems (RITICS), by the UK GCHQ and by the AQUAS project funded in part by the EU ECSEL – JU Programme (project ID 737475).
REFERENCES
[1] Roeder, T. and F.B. Schneider, Proactive Obfuscation. ACM Transactions on Computer Systems, 2010. 28(2): p. 4.1 - 4.54. [2] Forrest, S., A. Somayaji, and D.H. Ackley, Building Diverse
Computer Systems, in The Sixth Workshop on Hot Topics in Operating Systems. 1997, IEEE Computer Society Press: Los Alamitos, CA. p. 67 – 72.
[3] Lamport, L., R. Shostak, and M. Pease, The Byzantine Generals Problem. ACM Transactions on Programming Languages and Systems, 1982. 4(3): p. 382-401.
[4] Eckhardt, D.E. and L.D. Lee, A theoretical basis for the analysis of multiversion software subject to coincident errors. IEEE Transactions on Software Engineering, 1985. SE-11(12): p. 1511-1517.
[5] Popov, P. and B. Littlewood. The Effect of Testing on Reliability of Fault-Tolerant Software. in Dependable Systems and Networks (DSN'04). 2004. Florence, Italy: IEEE Computer Society Press. [6] Arsenault, D., A. Sood, and Y. Huang. Secure, resilient computing
clusters: Self-cleansing intrusion tolerance with hardware enforced security (SCIT/HES). in 2nd International Conference on Availability, Reliability and Security. 2007. Los Alamitos, CA: IEEE Computer Society Press.
[7] Sousa, P., et al., Proactive Resilience Revisited: The Delicate Balance Between Resisting Intrusions and Remaining Available, in
The 25th IEEE Symposium on Reliable Distributed Systems (SRDS). 2006, IEEE: Leeds, UK. p. 71-82.
[8] Falliere, N., L. O Murchu, and E. Chien W32.Stuxnet Dossier. 2011.
69. Available from: http://www.symantec.com/content/en/us/enterprise/media/security_
response/whitepapers/w32_stuxnet_dossier.pdf.
[9] Labs, A. Analysis Report on Flame Worm Samples. 2012. 96. Available from: www.antiy.net/media/reports/flame-analysis.pdf. [10] Zetter, K., Countdown to Zero Day: Stuxnet and the Launch of the
World's First Digital Weapon. 2016: Broadway Books.
[11] Littlewood, B. and D.R. Miller, Conceptual Modelling of Coincident Failures in Multi-Version Software. IEEE Transactions on Software Engineering, 1989. SE-15(12): p. 1596-1614.
[12] David, H.A. and M.L. Moeschberger, Theory of Competing Risks. Griffin's Statistical Monographs & Courses, ed. A. Stuart. Vol. 39. 1976: Hodder Arnold. 112.
[13] Bishop, P.G. and F.D. Pullen. Error Masking: A Source of Failure Dependency in Multi-Version Programs. in 1st IFIP International Working Conference on Dependable Computing in Critical Applications (DCCA-1). 1989. Santa Barbara, California: Vienna, Springer Verlag.
[15] IEC-TR-62443-2-3, Security for industrial automation and control systems Part 2-3: Patch management in the IACS environment. 2015, Published by BSI Standards Limited 2015. p. 66.
[16] Platania, M., et al., Towards a Practical Survivable Intrusion Tolerant Replication System, in IEEE 33rd International Symposium on Reliable Distributed Systems (SRDS). 2014, IEEE: Nara, Japan. p. 242-252.
[17] Hicks, M. and S. Nettles, Dynamic software updating. ACM Transactions on Programming Languages and Systems (TOPLAS), 2005. 27(6): p. 1049-1096.
[18] Sousa, P., et al., Highly Available Intrusion-Tolerant Services with Proactive-Reactive Recovery. IEEE Transactions on Parallel and Distributed Systems, 2010. 21(4): p. 452-465.
[19] Macaulay, T. and B.L. Singer, Cybersecurity for Industrial Control Systems: SCADA, DCS, PLC, HMI, and SIS. 2016: CRC Press. [20] Performability Group, Möbius 2.4, 2016, University of Illinois:
Urbana-Champaign. Available from: http://www.mobius.uiuc.edu/. [21] Popov, P., Safety and Security SAN Model, 2017, City University
open access. Available from: http://openaccess.city.ac.uk/16700/. [22] Anbalagan, P. and M. Vouk, Towards a Bayesian Approach in
Modeling the Disclosure of Unique Security Faults in Open Source Projects, in The 21st IEEE International Symposium on Software Reliability Engineering (ISSRE '10). 2010, IEEE Computer Society: San Jose. CA, USA. p. 101-110.
[23] Schneidewind, N.F., Reliability - security model, in The 11th IEEE International Conference on Engineering of Complex Computer Systems (ICECCS’06). 2006, IEEE Computer Society: Washington, DC, USA. p. 279-288.
[24] Ozment, A., Software security growth modeling: Examining vulnerabilities with reliability growth models, in Quality Of Protection: Security Measurements and Metrics, D. Gollmann, F. Massacci, and A. Yautsiukhin, Editors. 2006.
[25] Kriaa, S., M. Bouissou, and L. Pietre-Cambacedes, Modeling the Stuxnet attack with BDMP: Towards more formal risk assessments, in 7th International Conference on Risks and Security of Internet and Systems (CRiSIS) F. Martinelli, et al., Editors. 2012, IEEE: Cork, Ireland. p. 8.
[26] Maynard, P., K. McLaughlin, and S. Sezer. Modelling Duqu 2.0 Malware using Attack Trees with Sequential Conjunction. in 2nd International Conference on Information Systems Security and Privacy. 2016. Rome, Italy: SciTePress.
[27] Popov, P.T., Stochastic Modeling of Safety and Security of the e-Motor, an ASIL-D Device., in 34th International Conference on Computer Safety, Reliability, and Security (SAFECOMP 2015), Koornneef F. and v.G. C., Editors. 2015, Springer: Delft University of Technology, Netherlands. p. 385-399.
[28] Teixeira d’Aguiar Norton Brandão, L. and A. Neves Bessani, On the reliability and availability of replicated and rejuvenating systems under stealth attacks and intrusions. Journal of the Brazilian Computer Society, 2012. 18(1): p. 61-80.
[29] Littlewood, B., P. Popov, and L. Strigini. Assessment of the Reliability of Fault-Tolerant Software: a Bayesian Approach. in
19th International Conference on Computer Safety, Reliability and Security, SAFECOMP'2000. 2000. Rotterdam, the Netherlands: Springer.
[30] Popov, P., Bayesian reliability assessment of legacy safety-critical systems upgraded with fault-tolerant off-the-shelf software.