City, University of London Institutional Repository
Citation
:
Montesano, G., Rossetti, L. M., Allegrini, D., Romano, M. R. and Crabb, D. P. ORCID: 0000-0001-8754-3902 (2018). Improving Visual Field Examination of the Macula Using Structural Information. Translational Vision Science & Technology, 7(6), 36.. doi: 10.1167/tvst.7.6.36This is the accepted version of the paper.
This version of the publication may differ from the final published
version.
Permanent repository link:
http://openaccess.city.ac.uk/21307/Link to published version
:
http://dx.doi.org/10.1167/tvst.7.6.36Copyright and reuse:
City Research Online aims to make research
outputs of City, University of London available to a wider audience.
Copyright and Moral Rights remain with the author(s) and/or copyright
holders. URLs from City Research Online may be freely distributed and
linked to.
Article
Improving Visual Field Examination of the Macula Using
Structural Information
Giovanni Montesano
1–3, Luca M. Rossetti
2, Davide Allegrini
4, Mario R. Romano
4, and
David P. Crabb
11
City, University of London–Optometry and Visual Sciences, London, UK
2University of Milan–ASST Santi Paolo e Carlo, Milan, Italy 3
NIHR Biomedical Research Centre, Moorfields Eye Hospital NHS Foundation Trust, UCL Institute of Ophthalmology, London, UK
4
Humanitas University, Eye Unit, Humanitas–Gavazzeni Hospital, Bergamo, Italy
Correspondence:Giovanni Monte-sano, City, University of London– Optometry and Visual Sciences, Northampton Square, London, EC1V 0HB UK. e-mail: giovmontesano@ gmail.com
Received:15 August 2018
Accepted:23 October 2018
Published:28 December 2018
Keywords:glaucoma; optical co-herence tomography; visual field; ganglion cells; perimetry
Citation:Montesano G, Rossetti LM, Allegrini D, Romano MR, Crabb DP. Improving visual field examination of the macula using structural in-formation. Trans Vis Sci Tech. 2018; 7(6):36, https://doi.org/10.1167/ tvst.7.6.36
Copyright 2018 The Authors
Purpose: To investigate a novel approach for structure-function modeling in glaucoma to improve visual field testing in the macula.
Methods:We acquired data from the macular region in 20 healthy eyes and 31 with central glaucomatous damage. Optical coherence tomography (OCT) scans were used to estimate the local macular ganglion cell density. Perimetry was performed with a fundus-tracking device using a 10-2 grid. OCT scans were matched to the retinal image from the fundus perimeter to accurately map the tested locations onto the structural damage. Binary responses from the subjects to all presented stimuli were used to calculate the structure-function model used to generate prior distributions for a ZEST (Zippy Estimation by Sequential Testing) Bayesian strategy. We used simulations based on structural and functional data acquired from an independent dataset of 20 glaucoma patients to compare the performance of this new strategy, structural macular ZEST (MacS-ZEST), with a standard ZEST.
Results: Compared to the standard ZEST, MacS-ZEST reduced the number of presentations by 13% in reliable simulated subjects and 14% with higher rates (20%) of false positive or false negative errors. Reduction in mean absolute error was not present for reliable subjects but was gradually more important with unreliable responses (10% at 30% error rate).
Conclusions: Binary responses can be modeled to incorporate detailed structural information from macular OCT into visual field testing, improving overall speed and accuracy in poor responders.
Translational Relevance:Structural information can improve speed and reliability for macular testing in glaucoma practice.
Introduction
Visual field examination is key to the diagnosis of glaucoma and monitoring glaucoma progression. However, perimetric examinations require strong cooperation from the person being tested,1 and measurement variability abounds. Better examination procedures designed to reduce this measurement variability would have a clinical impact.2
Staircase algorithms determine seeing thresholds by presenting stimuli in sequences of decreasing and increasing intensity. This process takes a long time
information as prior knowledge in the testing proce-dure, for example by modifying the starting threshold distribution.
With the development of novel imaging tech-niques, such as spectral domain optical coherence tomography (SD-OCT), structural prior information can also be gathered on the presence, extent, and localization of glaucoma damage. Dennis et al.8 described a method to include such information in the ZEST strategy and showed, through simulations, the effect of the accuracy of the structural predictions on the final results of the strategy. Later, Ganeshrao et al.9 used a decision tree approach to inform the testing strategy with structural measurements from circumpapillary retinal nerve fiber layer (CP-RNFL) OCT scans and tested the improvements via simula-tions on a 24-2 grid. Despite this, the proposed model was mostly limited by the fact that CP-RNFL scans provide circular measurements of the RNFL thick-ness around the optic nerve head and do not quantify the loss of tissue at each tested location; thus, the damage could be mapped only to whole sectors of the visual field. This is especially limiting when it comes to testing the macular region, where much more detailed structural features can be measured.10,11Yet, structural guidance for perimetric testing could be greatly beneficial for patients who undergo macular assessment, especially when they suffer from ad-vanced damage and poor fixation and are tested with denser grids. For example, in the Humphrey Visual Field Analyzer (Zeiss Meditec, Dublin, CA), a typical 10-2 grid tests 68 locations, as opposed to the 54 in the 24-2 grid.11–13 Although the actual improvement in diagnostic ability of dense macular grids still needs to be clarified,14 the importance of precise macular testing is being increasingly recognized, especially considering that a typical 24-2 grid does not allow for accurate detection of macular damage.12,15
Comprehensive work from Hood and colleagues11 showed how the combination of detailed structural and functional information in the macular region can help identify features of glaucoma damage, such as specific areas more vulnerable to damage, and interindividual variations in the anatomy that could affect the clinical evaluation. In this work, we aimed at using the detailed two-dimensional structural information provided by macular SD-OCT scans to build a structure-function model for the macula that could be easily employed to inform perimetric testing. To improve the accuracy of our model, we used a fundus perimeter employing an implementation of the ZEST as the standard testing strategy and equipped
with scanning laser ophthalmoscopy (SLO) tracking to acquire measurements from healthy subjects and patients with glaucoma.16–18 This allowed precise localization of the stimuli on the structural maps. Furthermore, instead of using the final thresholds from the tests, we built our model based on subjects’ binary responses (seen or not seen) to each stimulus projected during the test. This allowed the estimation of probability of seeing (POS) curves based on the structural damage. Such curves were then used to calculate structurally based prior distributions for a modified structural ZEST (MacS-ZEST). We also took advantage of a standard method developed by Raza and Hood10 to quantify the structural damage in terms of estimated loss of ganglion cells. Finally, we tested the improvements in accuracy and speed via simulations, comparing our novel strategy with a standard implementation of the ZEST.19
Methods
Subject Enrollment
Data from 52 glaucoma patients with macular damage and 20 healthy subjects were collected at the Eye Clinic of San Paolo Hospital (Milan, Italy) and Humanitas–Gavazzeni Hospital (Bergamo, Italy). The protocol received approval from the local ethical committee (Humanitas–Gavazzeni Hospital Ethical Committee, reference number 161/18gav) and ad-hered to the tenets of the Declaration of Helsinki. Informed consent was acquired from all participants prior to testing. All subjects had to be older than 18 years of age, have a spherical refractive error between
10 andþ6 diopters (D) and astigmatism within62 D, and be absent of any systemic disease or drug treatment that could affect the execution of the visual field test.
Healthy subjects had to have no ocular conditions or previous ocular surgery other than uncomplicated cataract surgery, have normal appearance of the optic nerve head, and have no retinal conditions or significant media opacities that could affect the visual field. Subjects were sequentially enrolled among the staff of the clinics, patients’ partners, and spouses or people attending the clinics for routine eye examina-tions. All subjects underwent a complete ophthalmo-logic evaluation to exclude any eye pathology.
assessed by screening the 24-2 visual fields in the clinical charts and identified as a significant reduction in sensitivity within 108 from fixation on the total deviation maps (P , 0.05). For all patients, the presence of conditions other than glaucoma that could have caused central visual field defects (includ-ing retinal or neurologic disease, cataract, or signif-icant media opacities) were evaluated and excluded.
SD-OCT Scans
For all subjects, CP-RNFL scans and macular raster scans using SD-OCT (Spectralis; Heidelberg Engineering, Heidelberg, Germany) were acquired. Macular raster scans were composed of 121 vertical sections with 60-lm spacing, centered on the fovea. All data, including segmentations of the ganglion cell layer (GCL), were exported in RAW format and imported into MATLAB (The MathWorks, Natick, USA) for further analysis.
We transformed GCL thickness maps into esti-mated ganglion cell count (GCC) maps using the method proposed by Raza and Hood.10 This method employs the histologic ganglion cell density (GCD) map provided by Curcio and Allen20 from normal subjects and a normative thickness map of the GCL. These two maps are combined to obtain a volumetric GCD map that can later be used to convert any given GCL thickness into an estimated GCC. The norma-tive thickness profile was obtained by averaging both eyes of 35 normal subjects for an independent study published previously.21 The transformation of thick-ness into GCD was meant to account for the normal decrease of GC with eccentricity, helping to reduce the floor effect. In fact, the same structural thickness at different eccentricities would correspond to differ-ent densities. Moreover, this was meant to make our structure-function model comparable with other approaches that have related the sensitivity to the GCD.22
Perimetric Testing
To improve the precision of structure-function mapping (see next section), perimetric testing was performed with a fundus perimeter equipped with SLO tracking (Compass; CenterVue, Padua, Italy). Healthy subjects naive to perimetry underwent a training phase with a four-location example grid.
All 20 healthy subjects were tested with a 10-2 grid centered on the preferred retinal locus (PRL) of fixation, as determined by the device at the beginning of the test.16,23The determination of the PRL consists
of a 10-second fixation trial, during which time the device maps the part of the retina used by the subject for fixation. These subjects were tested with the standard ZEST strategy implemented in the device.
The 50 glaucoma patients were randomly divided into two groups. Group 1 had 30 patients who underwent the same examination routine described for healthy subjects. Group 2 had 20 patients who were examined three times using a full-threshold strategy (4-2 staircase) with a custom-designed small grid composed of eight testing locations at 1.48 and 4.28 from fixation (coordinates, degrees: 1, 1; 1, 1;
1,1; 1, 1; 3, 3; 3, 3; 3, 3; 3, 3). Fundus tracking helped ensure that the tested retinal locations were the same in all three repetitions. All perimetric tests used a Goldmann size III (G-III) stimulus. The rationale for the testing protocol is explained in the following sections on structure-function modeling and validation.
Structure-Function Modeling
Fundus images from the SD-OCT and the fundus perimeter (used to track the acquisition of the functional and structural measurements, respectively) were matched using a projective transformation (Fig. 1). The estimation of such transformation is based on feature detection in the two images using the Speeded Up Robust Features (SURF) algorithm24 as imple-mented in MATLAB. Projective transformation can account for linear distortions needed to match the images from the two devices, but they may converge to local minima, giving incorrect solutions. Therefore, all results were visually inspected (GM and DA) to ensure correct alignment. This provided a spatial transformation that could be used to map the coordinates of the tested locations onto the structural SD-OCT thickness map and hence on the estimated GCC map.
the total estimated GCC within the deformed tile and dividing this number by its area.
For the structure-function model, we used all the data from the examinations performed with a 10-2 grid (healthy subjects and glaucoma in group 1). Instead of modeling the final estimated threshold, we extracted single subjects’ responses to each stimulus presentation. Specifically, we analyzed the seen/not seen outcome for each stimulus presentation as signaled by the subjects during the test by pressing the response button on the perimeter. We then modeled the response as a binary process using a multivariate logistic model (detailed in theAppendix) that included, as predictors, the age of the subject, the local log10(GCD), and the eccentricity and the
intensity of each projection. Interactions between the intensity of the projection, the log10(GCC), and
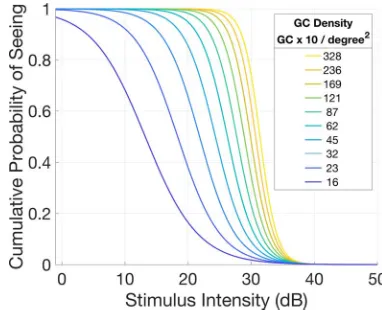
the eccentricity allowed for a change in slope and intercept of the logistic model, as these three parameters varied. An example of the resulting curves at different GCD (without considering eccentricity) is depicted in Figure 3. These logistic curves can be interpreted as estimated structural POS curves. The change in location along the horizontal axis (stimulus intensity) and the slope of the curve model the
expected probability of response and its variability, respectively. The structure-function model was built and fitted in the software R (R Project for Statistical Computing, Vienna, Austria).
Implementation of the Structural Strategy
[image:5.612.61.560.67.314.2]The basis for the structural strategy was an implementation of the ZEST described by Turpin et al.19Such a strategy was used for comparisons in the simulations. Briefly, the prior distribution for each tested location was a combination (in a proportion of 4:1) of an empirical distribution of normal and abnormal thresholds.The mean of the prior distribu-tion is used as the intensity of the first projecdistribu-tion. The prior distribution is then multiplied by a likelihood function centered on the intensity of the projection to produce a posterior distribution. The function could be increasing (for a seen) or decreasing (for a not seen). The posterior distribution is finally scaled and used as the prior distribution for the next iteration. In our work, we used the same starting prior distribution and likelihood function as in Turpin et al.,19 varying the mode of the normal peak according to the age of the subject. The model for the macular sensitivities was estimated using a large collection of visual field
tests from 444 healthy subjects recruited for the validation study for the Compass.18 These subjects were examined with a grid that contained all the points of a 24-2 grid with 12 additional macular points. A mixed model with eccentricity and age as predictors was used to estimate the normal sensitivity for the tested locations.
The MacS-ZEST strategy replicated the ZEST procedure changing the starting prior distribution according to the structural information from the OCT. The structural prior distributions were derived from the structure-function model by centering the normal peak on the 50%threshold predicted from the structural POS curves (Fig. 4B). This allowed for different average threshold in the starting distribution depending on the structural GCD. The abnormal component in the prior distribution was weighted according to the difference between the predicted structural mean threshold and the expected mean threshold for a subject’s age. The exact formula for the weighting is detailed in theAppendix. The presence of
the scaled abnormal component of the curve ensured faster convergence toward lower thresholds.
The structural strategy was implemented in R using the Open Perimetry Interface (OPI) package27 to provide open access to our algorithm for testing in a reproducible environment.
Implementation of the Simulations
[image:6.612.77.270.65.336.2]We used the method proposed by Henson et al.28 as implemented in the OPI package27 to simulate subjects’ response. This formula combines responses from glaucoma and healthy subjects and varies the slope of the sampling frequency of seeing function of the response according to the input threshold (see details in the Appendix). It also allows for arbitrary rates of false positive (FP) errors, indicating the rate at which the simulated patient is responding when no stimulus is seen, and false negative (FN) errors, indicating the rate at which the simulated patient is not responding, even when a stimulus is perceived. First, we simulated responses from reliable subjects (FP 3%; FN 3%). We then simulated increasing rates of either FP or FN errors (10%, 20%, and 30%), while keeping the other parameter fixed at 3%(either FN or FP errors, respectively). The simulation was stopped when each location reached a standard deviation (SD) in the posterior distribution ,1.5 dB, a widely used limit for dynamic termination.8,29,30 For both strate-gies, the likelihood function was a Gaussian cumula-tive distribution function (SD ¼ 1) centered on the
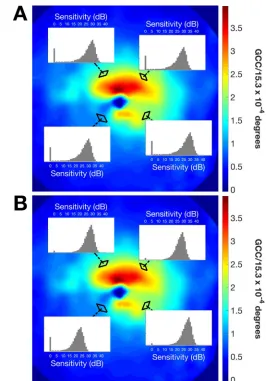
[image:6.612.339.530.70.225.2]Figure 2. Quantification of the local macular damage. (A) Exemplar estimated GCC map derived from the segmented GCL in a macular OCT scan. Theblack squaredregions are centered on each one of the 68 locations in the 10-2 grid and have the same area as a G-III stimulus. (B) The same regions displaced and distorted using the model proposed by Drasdo et al.26 The anisotropic distortion is a consequence of the shift of the grid center from the anatomical fovea.
tested threshold, whose maximum and minimum values were capped at 0.03 and 0.03, respectively. In order to have realistic inputs to the simulations accurately reflecting the true relationship between structure and function in a real patient, we used data from the 20 glaucoma subjects in group 2, tested three times with a 4-2 strategy at eight locations. Results from the three tests were averaged to obtain accurate estimates of the real threshold. These results also represented an independent dataset set for validation of the MacS-ZEST. The averaging process and the alignment for the three tests with the fundus tracking
was meant to improve the reliability of the estimated threshold.
Performance of the perimetric examination strat-egies were compared in terms of number of presentations and mean absolute error (MAE) from input thresholds per subject. The 90% and 95%
quantiles for each threshold value were also mea-sured and compared for reliable responses, typical FP (FP 20%and FN 3%) and typical FN (FP 3%and FN 20%). All simulations were performed in R using the OPI package. Mean difference in MAE (decibels) between the two strategies was calculated using linear mixed models, where random effects account-ed for correlations among simulation results from the same subject.31 Percentage reductions in MAE and number of presentations were evaluated using generalized linear mixed models with a log link function. This modeling approach provided esti-mates and standard errors of percentage change in the linear scale, while the log link function accounted for the skewed distributions of positive values (MAE and counts for the number of presentations). P
values are not reported as hypothesis testing is meaningless in a context where arbitrary increase in the number of simulations could yield statistical significance at any givenavalue. Bias and variability are also reported. Bias was calculated as the mean error of each estimated threshold from the input threshold, while variability was calculated as the mean absolute deviation (MAD) from the mean estimated threshold. All statistical calculations were performed in R.
Further validation to confirm the reduction in the number of presentations on a full 10-2 field (68 locations) was also performed with simulations using data from healthy subjects and glaucoma patients in group 1, the same used to build the structure-function model. To avoid biasing the results, in this set of simulations we refitted the structural model with a leave-one-out cross-validation approach and predicted the structural prior distributions from the model that did not contain information on the subject being simulated.
Results
[image:7.612.36.302.66.447.2]Demographics of the three groups of study participants are summarized in Table 1. Throughout the study, only one eye per subject was analyzed, chosen at random if the both eyes were eligible. Normal subjects were on average significantly youn-ger than glaucoma patients (mean difference 22
years), but they spanned a wide range of age (26–83 years). Mean deviation (MD) values for glaucoma subjects were extracted from the 24-2 Humphrey visual field examinations (Zeiss Meditec) in the clinical charts, all performed within 1 month from the recruitment date. There was no statistically significant difference (P¼0.89) in MD between the two groups of glaucoma patients, indicating a similar severity in visual field loss.
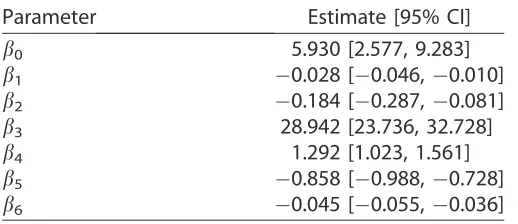
The parameter estimates for the structure-function model fitted on data from 20 healthy subjects and 31 glaucoma patients (group 1) are reported in the
Appendix. An example of the output from the structure-function model, not including the effect of eccentricity, is depicted in Figure 3. As expected for different local GCD values, the model predicted
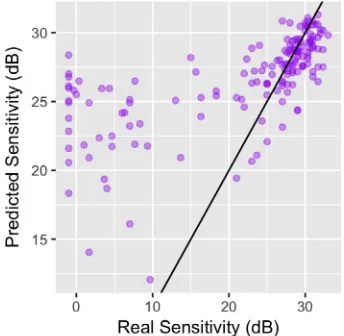
different POS curves. The curves were steeper and centered on higher sensitivities for higher structural GCD estimates, whereas they were shallower and centered on lower sensitivities for lower structural GCD estimates. Figure 5 shows the relationship between real threshold values and the 50% threshold predicted from the model on the subjects in group 2. As with other structure-function models relying on OCT images,10,32 our estimates suffered from a significant upward bias at lower thresholds due to the floor effect in the structural measurement. Therefore, the effective range of accurate prediction of the model was limited to values above 20 dB.
Adaptive starting prior distributions for the MacS-ZEST could be obtained from these POS curves, as described in the Methods section.Figure 5 shows an example from a patient where locations with the same eccentricity from the fovea had very different starting prior distributions due to the very different structural GCD estimate. This contrasts with the standard ZEST, where locations with the same eccentricity are given the same starting prior distribution.
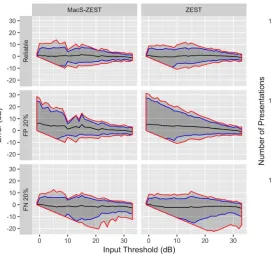
We compared the performance of the standard ZEST and the MacS-ZEST using structural and functional data input from glaucoma patients in group 2 (n¼20; 500 simulations per subject on eight locations). Error plots inFigure 6show a comparison at different input thresholds of the 95%and 99%error limits for reliable responses, 20%FP errors, and 20%
FN errors. In general, MacS-ZEST offered a better control over extreme errors, especially on the 99%
error limits, in unreliable patients. The MacS-ZEST showed a slight upward increase in the average error at 15 dB (1.3 dB on average). This sensitivity value was obtained from the average of tests at one location in a single patient whose average sensitivity was lower than predicted by the structural model. This location was at the edge of a structurally damaged region (see
Supplementary Fig. S1).
Table 1. Demographics of the Three Groups
Group Healthy Eyes,
n¼20
Glaucoma Group 1, Eyes, n¼31
Glaucoma Group 2, Eyes, n¼ 20
Age, y 486 16 [26, 83] 70614 [34, 88] 71 616 [34, 90]
24-2 MD, dB – 13.967.5 [31.6, 1.3] 13.565.4 [23.2,3.4]
BCVA, decimals 0.986 0.05 [0.80, 1.00] 0.7360.22 [0.15, 1.00] 0.8660.13 [0.6, 1.00]
[image:8.612.88.260.454.622.2]Visual fields (24-2) were extracted from clinical charts and were not available for healthy subjects. Healthy subjects were on average younger than both glaucoma groups but spanned a wide range of age. Only one eye per subject was analyzed. Data are reported as mean6SD [minimum, maximum]. MD, mean deviation; BCVA, best corrected visual acuity.
The average number of presentations needed to converge to threshold is reported in Figure 7. The major improvement in speed was for thresholds above 10 dB, where the structural prior distributions were more informative.
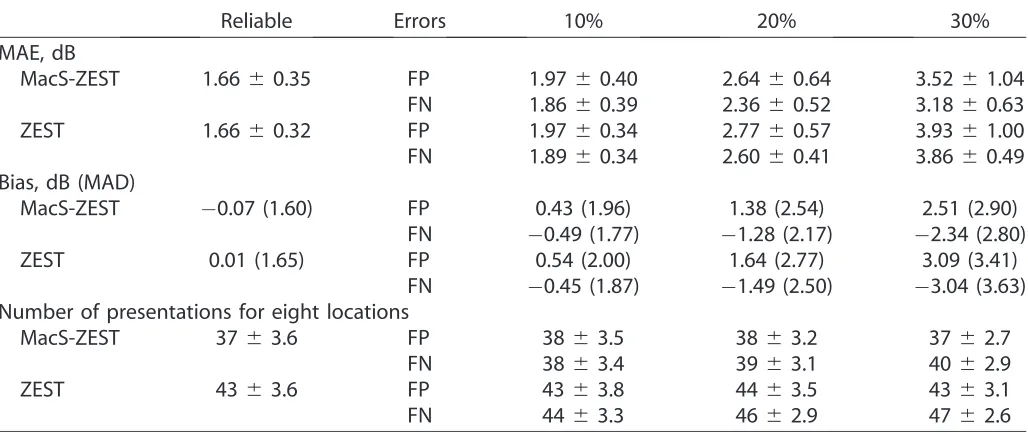
We then compared the average MAE improvement per subject at all tested rates of FP and FN errors (Table 2). As expected, we could not detect any substantial decrease in MAE when reliable responses were simulated (Fig. 8). However, the average number of presentations per eight locations was reduced by 12.6% (12.3%, 13%) (mean [95% confidence interval (CI)]), reducing from 4363.6 (mean 6SD) to 376
3.6, respectively. Increased FP and FN error rate worsened the accuracy for both strategies. However, MacS-ZEST was less affected than standard ZEST, especially when the error rate was larger than 10%. For example, at 30%FP error, the MAE was 10.6%
[9.2%, 12.1%] (0.41 [0.37, 0.45] dB) less for MacS-ZEST and 18.3%[16.9%19.7%] (0.68 [0.65, 0.71] dB) less at 30% FN. The number of presentations was
reduced for all tested levels of error rates with MacS-ZEST (seeTable 2and Figure 8).
Extrapolating these results to a full 10-2 grid (68 locations) would predict a reduction of 51
presenta-Figure 6. Results of simulations (500) with reliable responses (top panels), 20% FP errors (middle panel), and 20% FN errors (bottom panel) for the MacS-ZEST (left panels) and the ZEST (right panels). The graphs report the error in decibels (vertical axis) at different input thresholds (horizontal axis). The black lines represent the mean error, while the shaded areas represent the 95% quantiles (enclosed in theblue lines) and the 99% quantiles (enclosed in the
[image:9.612.54.325.68.322.2]red lines). No improvement in precision was evident in reliable subjects, while an important shrinkage of the 95% and 99% quantiles was evident with high FP and FN errors.
[image:9.612.311.559.70.326.2]Figure 7. Average number of presentations per location (solid line) at different sensitivities with simulated reliable responses (top panels), 20% FP errors (middle panel), and 20% FN errors (bottom panel) for the MacS-ZEST (red) and the ZEST (green). The graphs report the number of presentations (vertical axis) at different input thresholds (horizontal axis). Thevertical barsrepresent the SDs at each simulated input threshold. A reduction in presentations was obtained for thresholds higher than 10 dB.
Figure 8. Theleft panelshows the mean difference per test in MAE between MacS-ZEST and ZEST for reliable subjects (dark gray) and for increasing levels of FP (red) and FN (blue) errors. Themiddle panel
shows the same difference as percentage reduction. Theright panel
[image:9.612.310.563.507.621.2]tions for both reliable subjects and for subjects with 20% FP error rate. To validate these estimates, we ran a second set of simulations using reliable responses, 20% FP error rate and 20% FN error rate using data from the all 51 subjects (healthy and glaucoma) used to fit the structure-function model as input. To avoid biasing the estimates, we refit the model 51 times, each time leaving out the subject that was used in the simulation. The average
reduction in the number of presentations needed to complete the test was less than estimated from the small grid simulations (26 presentations reduction in healthy reliable subjects and 13 presentations in reliable glaucoma subjects) and was strictly depen-dent on the level of damage (reported inFig. 9as the mean sensitivity), being larger for less damaged visual fields (Table 3). No advantage in the number of presentations could be seen when very advanced damage was present.
Discussion
In our work, we aimed at creating a model of POS curves for macular locations based on structural features measured with SD-OCT. We developed a logistic model based on data from 31 glaucoma patients and 20 healthy subjects tested with a 10-2 grid. The structural strategy was then validated using an independent dataset of 20 glaucoma subjects, where a few locations (eight) were tested with high precision. This ensured that the inputs to the simulations were very close to the true thresholds, yielding a realistic structure-function relationship in the data.
[image:10.612.50.564.85.302.2]While no noticeable difference in precision could be found in reliable subjects with the MacS-ZEST, an improvement was evident for increasingly unreliable
Table 2. Speed and Precision of the Structural Strategy
Reliable Errors 10% 20% 30%
MAE, dB
MacS-ZEST 1.6660.35 FP 1.9760.40 2.6460.64 3.5261.04
FN 1.8660.39 2.3660.52 3.1860.63
ZEST 1.6660.32 FP 1.9760.34 2.7760.57 3.9361.00
FN 1.8960.34 2.6060.41 3.8660.49
Bias, dB (MAD)
MacS-ZEST 0.07 (1.60) FP 0.43 (1.96) 1.38 (2.54) 2.51 (2.90)
FN 0.49 (1.77) 1.28 (2.17) 2.34 (2.80)
ZEST 0.01 (1.65) FP 0.54 (2.00) 1.64 (2.77) 3.09 (3.41)
FN 0.45 (1.87) 1.49 (2.50) 3.04 (3.63) Number of presentations for eight locations
MacS-ZEST 3763.6 FP 3863.5 3863.2 3762.7
FN 3863.4 3963.1 4062.9
ZEST 4363.6 FP 4363.8 4463.5 4363.1
FN 4463.3 4662.9 4762.6
Average MAE (top) and number of presentations (bottom) per field (small grid, eight locations) for both strategies in glaucoma subjects (group 2) for reliable responses and increasing rates of FP and FN errors. The middle part of the table reports the bias (calculated as the mean error from input threshold) and variability (calculated as the MAD from the mean estimate). Data are reported as mean6SD, except for the middle sub-table where bias (MAD) is reported.
Table 3. Number of Presentations for a 10-2 Test
Number of Presentations, 10-2 Grid, 68 Locations
Reliable FP 20% FN 20%
Healthy
MacS-ZEST 277 620 275615 3026 21
ZEST 303 616 301612 3446 17
Glaucoma
MacS-ZEST 338 635 353636 3476 33
ZEST 351 629 380633 3706 28
responses (either increasing FN or FP errors, especially when larger than 10%). The number of presentations was generally lower in both cases.
However, the MacS-ZEST did not increase the speed of convergence for very low thresholds. This is likely due to the fact that, for advanced damage, the bottom floor effect in structural predictions is predominant.10 This is clear in Figure 4, where the estimates for thresholds below 20 dB are clearly less accurate and positively biased. Although this was accounted for by using varying weights for the abnormal curve when building the prior distributions in order to reduce the risk of bias at damaged locations, the resulting structural prior distributions were weakly informative for low sensitivities. Never-theless, structural information was able to confine the threshold estimates to lower values, reducing the 95%
and 99%limits of errors with high rates of FP errors. On the other hand, convergence for healthier loca-tions was faster due to the more precise estimate from structural measurements. For these locations, the MacS-ZEST was also protective against increased rates of FN errors.
When simulations were carried out for full 10-2 grids, the improvement in speed per test was proportional to the extent of the glaucoma damage (Fig. 9), ranging from 8.6% [8.5%, 8.8%] (mean reduction [95% CI]) in reliable healthy subjects and 3.9%[3.7%, 4.0%] in reliable glaucoma subjects. This was on average much less than observed for reliable simulated subjects using data from group 2 (12.6%
[12.3%, 13%]). This might be due to the fact that in group 1 we did not repeat the test to obtain a more accurate estimate of the true threshold, as in group 2, yielding a less realistic structure-function relationship. However, another likely explanation is that fields in group 1 included a wider range of low sensitivities. This is consistent with the fact that we observed no benefit for severely depressed fields (Fig. 9). Results were similar when responses with 20% FP or with 20%FN error rate were simulated.
Previous works have investigated the possibility of introducing structural information into perimetric tests. Dennis et al.8 proposed a theoretical method to modify ZEST prior distributions according to educated guesses from hypothetical structural
[image:11.612.134.484.59.369.2]surements by changing the mode of the normal component of the general ZEST prior distribution. However, their work focused more on assessing the theoretical benefits on precision and number of presentations, as well as the bias of the determined sensitivities for increasing differences of the structural estimate from the real threshold. Hence, they did not use an explicit structure- function model and actual structural data in their analysis. Other work from the same group9 used RNFL SD-OCT data and the structure-function model developed by Hood and Kardon32to predict the expected threshold. They then used a mix of decision trees and ZEST strategy to guide the initial projections using the structural information. They found an important reduction in the number of presentations but not a large reduction in the error with the structural strategy. This is in agreement with our results. On the other hand, the actual increase in precision is much less than what was predicted by Dennis et al.,8where the effective range of structural predictions was assumed to span the whole domain of tested sensitivities. However, this is largely prevented with real structure-function models (and in our case) by the bottom floor effect.
One novelty in our work is that we used patients’ responses (seen or not seen at each stimulus presen-tation) instead of the final threshold estimates to build the structure-function model for the structural strat-egy. Such an approach has the advantage of modeling the phenomenon generating the estimate of the thresholds rather than the final results of a specific testing strategy. This allowed for simultaneous esti-mation of the predicted threshold and its variability for different levels of structural damage. Moreover, the use of random slopes in the structure-function model (see the Appendix) accounted for interindivid-ual variability in the response in a way that would not be possible by just using final threshold estimates. Although this information was not directly used in our strategy, since we derived our estimates from the population level prediction of the model, accurate modeling of the random components can affect the estimates at the population level.31 This modeling approach could have potential further use, for example, to build structure-function curves by tracing the 0.5 level curves in the multivariate logistic model. One limitation is that slope estimates are biased when estimated using presentations from sequential adap-tive strategies,33 but this is unlikely to make any substantial differences for the applications we are proposing in a clinical scenario. However, we did not use the information on the slope derived from the
structure-function model in the testing procedure. Future work might expand the current methodology to include the uncertainty of the threshold estimate derived from the structural data.
Another strength in our analysis is that we used data acquired with a fundus perimeter, obtaining a more consistent testing of the same retinal locations than with traditional perimetry. This is important, especially when analyzing the macular region that is usually tested with dense grids, such as the typical 10-2, where locations have a spacing of 28. In these testing conditions, fixation stability has been shown to affect the reliability of the test much more than for 24-2 or 30-2 grids.34In addition, shifts and instability in fixation have been shown to arise in subjects with macular damage of the ganglion cells, for example, due to optic neuritis35 or in glaucoma.36 This is particularly relevant in our analysis as we selected patients for whom the central 108 were damaged. Furthermore, we could match the fundus images from the perimeter and the SD-OCT device, also equipped with fundus tracking, increasing the precision in the localization of the tested location onto the structural maps and with respect to the anatomical fovea. This had important consequences for the correct applica-tion of the Drasdo model25,26 to correct for radial displacement of ganglion cells.
Finally, the main novelty in our work was the possibility of obtaining detailed two-dimensional structural maps of the ganglion cell damage in the macula, allowing precise local structure-function modeling, which is not easily achieved for more peripheral locations in the visual field. Indeed, previous work investigating the use of structural prior information for 24-2 grids from RNFL thickness had to estimate the distribution of the defect for entire Garway-Heath sectors,37 rather than for individual locations.9
might be inaccurate when high spatial precision is needed.25One potential practical solution to this issue would be to account for gradient in the structural damage in the area surrounding the tested location, for example, adapting the size of the area used to calculate to GCD. Moreover, customized calculations for RGC displacements might help reduce the error and improve the precision of the structural estimate.25 A further limitation is that our structure-function model only accounts for reduction of sensitivity due to glaucoma damage. This might bias the estimates in the presence of atrophic changes to the external retina, especially in regions with a healthy GCL. However, macular OCT scans provide comprehensive evaluation of all retinal layers of the macular region. Such information could be used to refine and expand the model to build more accurate starting prior distributions.
In conclusion, structural characterization of macu-lar POS curves has the potential for improving testing procedure by reducing testing time and improving precision. In our experiments, such an advantage was particularly evident above 10 dB, the range of sensitivities that is more meaningful to detect progres-sion of glaucoma.38–40 The main future development will be the practical implementation of the strategy to test real patients evaluating test-retest variability, testing time, and offset in sensitivities. This is likely to have an impact in the clinical practice, facilitating the more extensive use of accurate macular tests for early detection of glaucoma, especially when employed for precise monitoring of patients with ocular hyper-tension. Additionally, patients with central visual field damage could benefit from a faster test that might allow, by incorporating structural changes, the early detection of macular damage progression, prompting timely therapeutic interventions.
Acknowledgments
Disclosure: G. Montesano, None; L.M. Rossetti, CenterVue (C); D. Allegrini, None; M.R. Romano, None; D.P. Crabb, CenterVue (C).
References
1. Glen FC, Baker H, Crabb DP. A qualitative investigation into patients’ views on visual field
testing for glaucoma monitoring. BMJ Open. 2014;4:e003996.
2. Turpin A, McKendrick AM. What reduction in standard automated perimetry variability would improve the detection of visual field progression?
Invest Ophthalmol Vis Sci. 2011;52(6):3237–3245. 3. Artes PH, Iwase A, Ohno Y, et al. Properties of perimetric threshold estimates from Full Thresh-old, SITA Standard, and SITA Fast strategies.
Invest Ophthalmol Vis Sci. 2002;43:2654–2659. 4. Bengtsson B, Heijl A. Evaluation of a new
perimetric threshold strategy, SITA, in patients with manifest and suspect glaucoma. Acta Oph-thalmol Scand. 1998;76:268–272.
5. Watson AB, Pelli DG. QUEST: a Bayesian adaptive psychometric method. Percept Psycho-phys. 1983;33:113–120.
6. King-Smith PE, Grigsby SS, Vingrys AJ, et al. Efficient and unbiased modifications of the QUEST threshold method: theory, simulations, experimental evaluation and practical implemen-tation. Vision Res. 1994;34:885–912.
7. Anderson AJ. Utility of a dynamic termination criterion in the ZEST adaptive threshold method.
Vision Res. 2003;43:165–170.
8. Denniss J, McKendrick AM, Turpin A. Towards patient-tailored perimetry: automated perimetry can be improved by seeding procedures with patient-specific structural information.Trans Vis Sci Technol. 2013;2:3.
9. Ganeshrao SB, McKendrick AM, Denniss J, Turpin A. A perimetric test procedure that uses structural information. Optom Vis Sci. 2015;92: 70–82.
10. Raza AS, Hood DC. Evaluation of the structure-function relationship in glaucoma using a novel method for estimating the number of retinal ganglion cells in the human retina. Invest Ophthalmol Vis Sci. 2015;56:5548–5556.
11. Hood DC, Raza AS, de Moraes CG, et al. Glaucomatous damage of the macula.Prog Retin Eye Res. 2013;32:1–21.
12. Grillo LM, Wang DL, Ramachandran R, et al. The 24-2 visual field test misses central macular damage confirmed by the 10-2 visual field test and optical coherence tomography.Trans Vis Sci Technol. 2016;5:15.
13. Traynis I, De Moraes CG, Raza AS, et al. Prevalence and nature of early glaucomatous defects in the central 10 degrees of the visual field.
JAMA Ophthalmol. 2014;132:291–297.
for detecting central visual field abnormalities in glaucoma.Am J Ophthalmol. 2018;196:10–17. 15. De Moraes CG, Hood DC, Thenappan A, et al.
24-2 Visual fields miss central defects shown on 10-2 tests in glaucoma suspects, ocular hyperten-sives, and early glaucoma. Ophthalmology. 2017; 124:1449–1456.
16. Rossetti L, Digiuni M, Rosso A, et al. Compass: clinical evaluation of a new instrument for the diagnosis of glaucoma. PLoS One. 2015;10: e0122157.
17. Fogagnolo P, Modarelli A, Oddone F, et al. Comparison of Compass and Humphrey perim-eters in detecting glaucomatous defects. Eur J Ophthalmol. 2016;26:598–606.
18. Montesano G, Bryan SR, Crabb DP, et al. A comparison between the compass fundus perime-ter and the Humphrey Field Analyzer [published online ahead of print August 14, 2018]. Ophthal-mology. doi: 10.1016/j.ophtha.2018.08.010.
19. Turpin A, McKendrick AM, Johnson CA, Vin-grys AJ. Properties of perimetric threshold esti-mates from full threshold, ZEST, and SITA-like strategies, as determined by computer simulation.
Invest Ophthalmol Vis Sci. 2003;44:4787–4795. 20. Curcio CA, Allen KA. Topography of ganglion
cells in human retina.J Comp Neurol. 1990;300:5– 25.
21. Montesano G, Gervasoni A, Ferri P, et al. Structure-function relationship in early diabetic retinopathy: a spatial correlation analysis with OCT and microperimetry. Eye (Lond). 2017;31: 931–939.
22. Harwerth RS, Wheat JL, Fredette MJ, Anderson DR. Linking structure and function in glaucoma.
Prog Retin Eye Res. 2010;29:249–271.
23. Montesano G, Crabb DP, Jones PR, et al. Evidence for alterations in fixational eye movements in glaucoma.BMC Ophthalmol. 2018;18:191.
24. Bay H, Tuytelaars T, Van Gool L. SURF: Speeded Up Robust Features. Berlin, Heidelberg: Springer Berlin Heidelberg, 2006.
25. Turpin A, Chen S, Sepulveda JA, McKendrick AM. Customizing structure-function displace-ments in the macula for individual differences.
Invest Ophthalmol Vis Sci. 2015;56:5984–5989. 26. Drasdo N, Millican CL, Katholi CR, Curcio CA.
The length of Henle fibers in the human retina and a model of ganglion receptive field density in the visual field. Vision Res. 2007;47:2901–2911. 27. Turpin A, Artes PH, McKendrick AM. The Open
Perimetry Interface: an enabling tool for clinical visual psychophysics.J Vis. 2012;12(11) :pii.
28. Henson DB, Chaudry S, Artes PH, et al. Response variability in the visual field: compar-ison of optic neuritis, glaucoma, ocular hyper-tension, and normal eyes. Invest Ophthalmol Vis Sci. 2000;41:417–421.
29. McKendrick AM, Turpin A. Advantages of terminating Zippy Estimation by Sequential Testing (ZEST) with dynamic criteria for white-on-white perimetry.Optom Vis Sci. 2005;82:981– 987.
30. Rubinstein NJ, McKendrick AM, Turpin A. Incorporating spatial models in visual field test procedures. Trans Vis Sci Technol. 2016;5:7. 31. Bates D, M¨achler M, Bolker B, Walker S. Fitting
linear mixed-effects models using Ime4. J Stat Softw. 2015;67(1).
32. Hood DC, Kardon RH. A framework for comparing structural and functional measures of glaucomatous damage. Prog Retin Eye Res. 2007;26:688–710.
33. Kaernbach C. Slope bias of psychometric func-tions derived from adaptive data. Percept Psy-chophys. 2001;63:1389–1398.
34. Wyatt HJ, Dul MW, Swanson WH. Variability of visual field measurements is correlated with the gradient of visual sensitivity.Vision Res. 2007;47: 925–936.
35. Mallery RM, Poolman P, Thurtell MJ, et al. The pattern of visual fixation eccentricity and insta-bility in optic neuropathy and its spatial relation-ship to retinal ganglion cell layer thickness.Invest Ophthalmol Vis Sci. 2016;57:OCT429–437. 36. Montesano G, Fogagnolo P, Digiuni M, Rossetti
LM. How glaucoma shapes fixation: structure-function analysis using COMPASS fundus pe-rimeter and SD-OCT.Invest Ophthalmol Vis Sci. 2017;58:5827.
37. Garway-Heath DF, Poinoosawmy D, Fitzke FW, Hitchings RA. Mapping the visual field to the optic disc in normal tension glaucoma eyes.
Ophthalmology. 2000;107:1809–1815.
38. Pathak M, Demirel S, Gardiner SK. Reducing variability of perimetric global indices from eyes with progressive glaucoma by censoring unreliable sensitivity data.Trans Vis Sci Technol. 2017;6:11. 39. Gardiner SK, Swanson WH, Demirel S. The
effect of limiting the range of perimetric sensitiv-ities on pointwise assessment of visual field progression in glaucoma. Invest Ophthalmol Vis Sci. 2016;57:288–294.
Appendix
Structure-Function Model
To model subjects’ reactions to each projection we used a mixed effect generalized linear model with a logit link function. The outcome was the binary response (seen or not seen) to each presentation. The model formula was the following:
logit pijk
¼b0þb1ageiþb2intijkþb3log10 GCDij
þb4eccijþb5 intijk3log10 GCDij
þb6 intijk3eccij
þ#ijintijkþmiþcij
þeijk
mi;Nð0;r1Þ
cij;Nð0;r2Þ
eijk;Nð0;r3Þ
hij;Nð0;r4Þ;
where age is the age of the subject (years), int is the intensity of the projection,eccis the eccentricity of the stimulated location, and GCD is the local ganglion cell density. Interaction terms allow varying slopes of the POS curve at different eccentricities and local GCD values. The eccentricity was kept as a separate predictor in the final model as it had significant effect. This indicates that the transformation of thickness values into GCD alone was not sufficient to fully compensate for the distance from the fovea. The random part of the model included a random factor grouping projections on the same location (cij) nested within a random factor for the subject (mi). A random
slope was also used for the intensity of the projection (hij). FP and FN errors were not included in the
model. However, only 3/20 healthy subjects and 5/31 subjects with glaucoma (group 1) had a FP rate.0 as determined by Compass (no FN errors were record-ed), and these errors are not individually tracked in the test history. The coefficients for the fixed effects may be seen in Table A1.
Weighting of Abnormal Component in the
Prior Distributions
To ensure convergence toward very low thresh-olds, as with the standard ZEST, we built the
structural prior distribution using a weighted mixture of a distribution derived by shifting the normal peak of the standard ZEST prior distribution on the 50% threshold predicted by the structural POS curves and a set of abnormal thresholds, in a 4:1 proportion. When the predicted threshold from the structural POS curve at one location was within 3 dB of the expected normal value for the subject at that location, the abnormal component in the prior distribution was weighted less by applying the same mixing proportion but multiplying the abnormal part by 0.01.
This formulation produced stable convergence to lower thresholds while not compromising the predictive ability of the structure before the floor effect ensues.
Simulation of Subjects’ Responses
Subject’s responses were simulated using the method propose by Henson et al.28 as implemented in the OPI R package.27The response to a stimulus is sampled from a frequency of seeing function with the following formula:
th¼fprþð1fprfnrÞ3ð1pnorm xð ;tt;VarÞÞ;
wherethis the sampled threshold,fprandfnrindicate the FP and FN rate, respectively, andpnormindicates the cumulative distribution function of a Gaussian function with meantt (the true input threshold) and varianceVar, evaluated at the intensityx.
The variance Var was modified according to the input threshold with the formula
Var¼min cap;eA3ttþB;
[image:15.612.311.570.87.199.2]wherecapis the maximum allowed variability, set at 6 dB, and A and B were selected from Table 1 in Henson et al.28 to provide a combined response of glaucoma and normal subjects. Specifically, A ¼ 0.081 and B¼3.27.
Table A1.
Parameter Estimate [95% CI]
b0 5.930 [2.577, 9.283]
b1 0.028 [0.046,0.010] b2 0.184 [0.287,0.081]
b3 28.942 [23.736, 32.728]
b4 1.292 [1.023, 1.561]