promoting access to White Rose research papers
White Rose Research Online
Universities of Leeds, Sheffield and York
http://eprints.whiterose.ac.uk/
This is an author produced version of a paper published in Journal of
Computer-Aided Molecular Design.
White Rose Research Online URL for this paper:
http://eprints.whiterose.ac.uk/3592/
Published paper
Harrison, A-M., Darren, S.R., Willett, P. and Artymiuk, P.J. (2003)
Representation,
searching and discovery of patterns of bases in complex RNA structures,
Journal
of Computer-Aided Molecular Design, Volume 17 (8), 537 -549.
Article type: Full length paper
Representation, Searching and Discovery of Patterns
of Bases in Complex RNA Structures
Anne-Marie Harrison
1,2, Darren R. South
1,2,
Peter Willett
2and Peter J. Artymiuk
1*.
Krebs Institute for Biomolecular Research, Departments of Molecular Biology and Biotechnology
1and
Information Studies
2, University of Sheffield,
Western Bank, Sheffield S10 2TN, UK
Corresponding author. Email: [email protected],
Tel: (0114) 2224190, Fax: (0114) 2728697
Keywords Graph theory, RNA structure representation, RNA tertiary structure, Structural comparison.
Summary We describe a graph theoretic method designed to perform efficient searches for substructural patterns in
nucleic acid structural coordinate databases using a simplified vectorial representation. Two vectors represent each
nucleic acid base and the relative positions of bases with respect to one another are described in terms of distances
between the defined start and end points of the vectors on each base. These points comprise the nodes and the
distances the edges of a graph, and a pattern search can then be performed using a subgraph isomorphism algorithm.
The minimal representation was designed to facilitate searches for complex patterns but was first tested on simple,
well-characterised arrangements of bases such as base pairs and GNRA-tetraloop receptor interactions. The method
performed very well for these interaction types. A survey of side-by-side base interactions, of which the adenosine
important in structural regulation. A number of examples were found, with GU platforms being particularly
prevalent. A GC platform in the RNA of the Thermus thermophilus small ribosomal subunit is in an analogous position to an adenosine platform in other species. An unusual GG platform is also observed close to one of the
substrate binding sites in Haloarcula marismortui large ribosomal subunit RNA.
Abbreviations PDB Protein Databank
3D three-dimensional
Introduction
The past decade has seen a vast increase in structural data on complex tertiary structures of RNA, beginning
with the hammerhead ribozyme [1-2] and culminating in the atomic resolution structures of both the small (30S)
[3-4] and large (50S) [5] ribosomal subunits. The recently published 5.5Å structure of the complete (70S) ribosome [6]
indicates that this trend is likely to continue. This builds on the knowledge gained from the early crystal structures
of transfer RNA [7-8], which gave the first indication of the complexity of RNA folding in three dimensions.
It is clear that tertiary structure plays as important a part in complex RNA molecules as it does for proteins.
In spite of a wide range of functions that would seem to require a large number of varied structures, there appear at
present to be a relatively small number of secondary structure elements which serve as building blocks that combine
to give rise to folded tertiary structures. Thus Ban et al. [5] noted that no “dramatically new” secondary structural features were observed even in the massive 50S ribosomal subunit. It would appear from this that it is not the motifs
themselves but rather the ways in which these can be combined which will provide the key to understanding
pathways of RNA folding. This emphasises the need for novel computational methods that can be used to discover
novel motifs or to analyse subtle variations in previously recognised ones and also to examine patterns of interaction
between structural motifs.
The presence of some secondary structural features in RNA serves to disrupt the regular helical geometry
and, importantly, to expose functional groups capable of forming hydrogen bonds; the ultimate effect of this is to
create potential binding sites for ligands, either intramolecular when folding to a higher order structure, or
intermolecular involving either other RNA or protein molecules [9-11]. The elements of secondary structure largely
involve the formation of base pairs both canonical and non-canonical, to form regular or distorted double helices.
Hairpin loops, particularly tetraloops [12-13]), and internal loops [12] are common secondary structural motifs that
also contribute significantly to RNA tertiary structural interactions. These elements then interact with each other
through formation of base triples by hydrogen bonding and tetraloop-receptor interactions to stabilise the folding of
the RNA molecule into its three-dimensional (3D) shape [12]. For a summary of structural motifs in RNA see Moore
[14]. The Structural Classification of RNA (SCOR) database is an attempt to classify the 3D motifs present in RNA
RNA structures would be useful [15]. A potential use for the program we describe may be as a tool to search for
specific motifs in the analysis of complex 3D structures. It is possible that an exceedingly large number of
conformations may be derived from this relatively small number of secondary structure motifs if one considers the
longer range arrangements of these motifs. It is known that families of protein folds exist [16-17] and it is possible
that an analogous situation may exist in complex RNA which may be discerned through the comparison of tertiary
structures of RNA molecules.
To achieve such structural comparison by computational methods, algorithms are required that allow one to
search for and retrieve those structures contained in a large RNA/DNA coordinate database which contain a given
structural motif of interest. Such a retrieval algorithm may be one of two types. In a similarity search one wishes to
find those structures in the database which have the greatest similarity to a target structure (maximum common
substructure searching). Alternatively, one may wish to retrieve those structures which contain exactly a specific
structural pattern given as the target structure (substructure searching). Graph-theoretic methods are ideally suited
to tasks such as these and have been used extensively in searching databases of small molecules for patterns of
atoms [18-19]. Such methods have also been applied to searches of protein structural databases such as the Protein
Data Bank (PDB) [20], while subsequent work, whether using graph theory or other methods, has focused on the
geometric arrangements of the secondary structural elements, α−helices and β−sheets [21-25]. These secondary
structure element searches were able to demonstrate similarities between protein families that had been previously
unnoticed [26, 27, 17]. The techniques were then developed to search for 3D patterns of amino acid side chains
contained in protein structures [28]. Graph-theoretic methods have also been used in detection of protein side chain
clustering with the nodes and edges representing the Cβ atoms and distances between them respectively [29] and in
pattern matching of binding pocket properties [30].
Gendron et al. [31] have described the use of homogeneous transformation matrices, data structures that encode the geometric operations needed to transform a 3D object from one coordinate system to another, the objects
here being vectors in bases. These matrices form the edges of structural graphs in which the nodes are nucleotides
and the graphs are used to investigate nucleotide conformations and base-pair interactions in PDB structures. They
also describe a distance measure based on the matrices, permitting the identification of unusual nucleotide
complex structural motifs that can be searched. However their MC-Annotate appears to be intended to examine
individual structures rather than to conduct rapid searches for patterns in large databases of structures [31].
In this paper we describe a graph-theoretic searching program aimed at searching for 3D patterns of bases in
the database of nucleic acid structures. The representation of the structure is of key importance for such searching
methods and in the next section we describe a scheme to represent the individual bases in a nucleic acid. A complete
structure can then be represented as a labelled graph. We then describe how this graph representation is applied to
searches for complex arrangements of bases in RNA and discuss some novel RNA base arrangements that were
found by using the search method. Analysis of structural information is key to our understanding of the biological
function of complex molecules and has an important role to play in the design of therapeutics.
Materials and Methods
The Ullmann Subgraph Isomorphism Algorithm
A graph is a mathematical construct consisting of a set of objects, called nodes and the relationships between them,
the edges. A labelled graph has a set of attributes for the nodes and edges, in our example base type and distances
between vectors respectively. If an edge connects a pair of nodes then the nodes are said to be adjacent.
Isomorphism occurs if there is a mapping between adjacent nodes of graph A and adjacent nodes of graph B. Graph
A is a subgraph of graph B if there is an isomorphism between A and a subset of the nodes of B. To determine
whether one graph is a subgraph of another one can apply a computational procedure known as a subgraph
isomorphism algorithm. A number of such algorithms exist and studies have demonstrated the general effectiveness
of the Ullmann subgraph isomorphism algorithm for searching both small molecules and biological macromolecules
[32, 33, 21]). We have used the Ullmann algorithm as the basis for our program NASSAM.
The Graph Representation
Previous work has described the use of subgraph isomorphism algorithms for the rapid comparison of 3D
protein structures [21, 28]. Here, we describe the program NASSAM, in which a subgraph isomorphism algorithm
is used to compare 3D nucleic acid structures at the base level. The nucleic acid structure is represented by a graph
structural variation between coordinate sets representing similar nucleic acid sequences. Furthermore, to use all
atoms in the base would increase the number of nodes in the graph, thus reducing the speed of the search as the time
requirement of a subgraph isomorphism algorithm is proportional to the factorial of the number of nodes in the
query graph.
Each base is represented by four pseudoatoms; by connecting these pseudoatoms to give two pairs we can also consider the base to be represented by two vectors whose start (S) and end (E) points are specified by the
positions of the pseudoatoms. This is illustrated in Figure 1. A nucleic acid can be represented by a graph in
which the nodes are the vector pair describing each base and the edges are the distances between pairs of these
vectors. The base vectors are labelled x and y. The pseudoatoms were chosen so as to represent, accurately but
economically, the particular base. For purines the x vector begins at N9 and ends at the C6 functional group –
either N6 or O6. The y vector begins at N7 and ends at the C2 functional group. For adenine which has no C2
functional group this vector is extended by 1.4Å to place the pseudoatom in the approximate position such a group
would occupy, for example, N2 in guanine. For pyrimidines the x vector begins at N1 and ends at the C4 functional
group and the y vector begins at C5 and ends at the C2 functional group. This particular description of the base
encompasses many of the potential hydrogen bonding functional groups, and also allows the use of generic base
types for both purines and pyrimidines. We also calculate the midpoint (M) of each vector by taking the average of
the start and end positions.
Non-standard and substituted bases are represented in a similar way to standard ones. In general, the atoms
involved in the vector start and end points are generic to either a purine or pyrimidine base, and thus substituted
bases can be treated in the analogous way to the parent base. Pseudouridine, is a more unusual case, where the
glycosidic bond is at C5 instead of C1. In this case the atoms used are those with the same labels (N1, N4, C5 and
O2) as in uridine. This has the advantage of consistency in the representation of hydrogen bonding groups, but
does mean that pseudouridine is represented differently from uridine from the point of view of its connection to the
main-chain.
It is not necessary to use all possible distance combinations to describe orientations of bases with respect to one
another; indeed, any combination of inter vector distances may be used to set up a query pattern. Some query
patterns are illustrated in Figure 2. In our initial experiments, the SxSx distance is included in every pattern as we
may constitute a hydrogen bond are used wherever appropriate. Other distances are included as required, in a
pattern-specific manner, to enable discrimination between similar yet different orientations of bases with respect to
one another. The non-planarity of bases was a problem only at higher tolerances than those we would normally
recommend for searching. This problem could however be overcome, if necessary, by the use of a post-search
planarity check, or alternatively by the addition of an extra vector to monitor separations perpendicular to the base
planes.
The NASSAM program
Each structure to be searched is represented as a graph. However, these graphs are not stored explicitly.
Instead, each structure has a text file associated with it which contains the coordinates of the pseudoatoms for each
base in the structure. When a given query pattern is matched against a structure the coordinate information in the
text file is used to generate only the inter-vector distances for the particular pseudoatoms and distance types
specified in the query. This generation of only the required parts of the graph at run time reduces storage and
input/output overheads that would otherwise adversely affect the speed of the program.
The query pattern is defined in a matrix containing a set of inter vector distances and is illustrated in Figure 2 for the
G.C Watson-Crick (GCWC) and GG N3-amino symmetric (GGN3) pairs. The MxMy distance is measured for each
base and used to check that the x and y vectors are being measured for the same base. A fixed pseudodistance is
used to ensure that the midpoints of each of these vectors are so close that they must be on the same base; otherwise,
for example, the search may measure distances using x on one guanine and y on a different guanine. This constraint
is included in all patterns and will not be indicated further in this paper. Pattern matrices can be created by the use of
a program that creates the query pattern matrix based on user input. The user can select which inter-vector start / end
point distances to use to describe the geometry and set the required distance values. These distances may be based
on an actual existing structure, or may be hypothetical distances created by the user. The latter allows the user to
easily set up pattern matrices to search for novel types of base interaction that may not have been previously
described.
Any of the distances may be used, and it is not necessary to use distances between pairs of atoms in every
for the name of the pattern and also for a tolerance value that is to be applied to all the distances in the selected
query pattern. The search matrix is generated from each PDB structures associated text file as described above. The
query matrix is searched for in the search matrix using the Ullmann subgraph algorithm and any matches are output.
By default, all searches are carried out independent of sequence order. Consequently chain direction is not a
constraint in the searches, unless explicitly required by the user.
The full NASSAM suite of programs consists of software to produce the query pattern files and the
NASSAM implementation of the Ullmann algorithm written in Fortran 77. A C program is also available to convert
a structure database into the NASSAM searchable database of text files. The program has been implemented on
Silicon Graphics R12000 workstations under the UNIX operating system.
Results and Discussion
Evaluation of the Representation
We first describe a series of testing procedures to which the representation scheme was subjected. It was
essential to establish that the scheme could correctly find well-known base patterns before advancing to searches for
Search Database
The test database of RNA structures to be searched was derived from deposited entries in the PDB [34]. We
have used a database of 17 ‘small RNA’ molecules. This set comprised structures determined by X-ray
crystallography to a resolution of 3Å or better. These structures contained a variety of secondary structural motifs
such as hairpin loops, internal loops and base pair mismatches and also included some single stranded entries for
which, clearly, there is no secondary or tertiary structure. Molecules with some tertiary interaction were also
included, so that the set included an example of transfer RNA, a hammerhead ribozyme and the P4-P6 domain of the
group I intron structure. Added to this set was one of the structures of the Thermus thermophilus small ribosomal subunit [4]. This contained a greater number and diversity of secondary structure types than the initial set and was
an ideal test for the representation and efficiency of the search. Together with the ‘small RNA’ set, this formed the
testing dataset.
A second database was compiled for performing searches for more complex base patterns. This database
contained 48 structures solved by X-ray crystallography to a resolution of at least 3Å and did not include any of the
structures contained in the testing database except for the T. thermophilus small ribosomal subunit. Simple duplex RNA structures were excluded from this set, as were structures of less than 25 nucleotides. Thus, this dataset
included some large ribosomal subunit structures, several ribozymes and other RNA protein complexes such as
tRNA-tRNA synthetases.
Validation of the Method: Planar Base-Base Interactions
The representation was tested by constructing query patterns based on a number of possible base pairing
types. There have been a number of different compilations of base pair types since the solution of early crystal
structures revealed modes of interaction other than canonical Watson-Crick hydrogen bonding. These have been
classifications based on base type [35-36] or by geometry [37-38]. Our method of representation is totally
independent of how one classifies a structure as it directly compares the positions of atoms relative to one another.
Thus, for example, base pair interactions involving bifurcated hydrogen bonds are equally well covered by the
representation.
To evaluate the representation query patterns were constructed for 32 base pairing types. These included the
trans, C.C amino-O2, amino-N3 cis and A.C N6-N3, N6-carbonyl [Image Library of Biological Macromolecules,
http://www.imb-jena.de/IMAGE_BPDIR.html]. In order to test the performance of NASSAM the number of occurrences of each type of base pair was determined independently for each set of data. For the ‘small RNA’ set it
was possible to identify the expected locations of examples of the base pairs in many cases by examination of the
sequence, secondary structure and visual inspection. In the case of some of the more complex structures, the
primary citation was checked for reference to any specific base pairs and also the PDB file itself, which, for some
structures, contains a list of non Watson-Crick base pairs in the structure. Bases were only considered paired if they
had N—N or N—O hydrogen bond lengths of < 4.0Å. The number of occurrences of base pair types in the 30S
small ribosomal subunit was obtained by reference to the PDB file. This contains a list of all bases involved in non
Watson-Crick pairs and a further list of atoms participating in non Watson-Crick hydrogen bonds. From this
information a list of non Watson-Crick base pair types was compiled. This information was then used to assess the
performance of the NASSAM search and provided the best opportunity to test the type of representation we have
used. Hydrogen bonds between bases are susceptible to bending and stretching and the geometry may be variable.
There is no convention for the description of the ‘ideal’ base pair hydrogen bond, so clearly any such assignments
are based on the judgement of the authors of the structure paper or the assignation criteria used in the PDB entry.
Thus, in the comparison of results obtained by NASSAM we are comparing the performance of our method with the
published analysis of the structure, and inevitably some inconsistencies occur in the literature because of differing
criteria used by various authors in assigning hydrogen bonding distances
Searches were performed on the testing dataset described above and the resulting hits were compared to
those expected. NASSAM allows the user to select a tolerance value at run time. This sets the amount of deviation
from the distance set in the query pattern and may be either a discrete distance value e.g. 1Å or a percentage value.
The tolerance value is applied to all distances contained within the query, so it is clear that, as the range of different
distances in any given query may vary between > 10Å and < 3Å, the percentage option is preferable. Therefore, the
searches were performed at distance tolerance values of 20%, 30% and 40%. The search takes less than 20 seconds
to run on the ‘small RNA’ set and approximately 60 seconds on the 30S ribosomal subunit on an SG R12000
processor. In our patterns we set the hydrogen bond length at 2.6Å, which at the 30% tolerance level, gives an
upper limit of 3.38Å. Variation of the tolerance value will obviously allow different upper and lower distance limits
to be used. In general, distances in the query patterns were chosen as reasonable guesses to the actual distance, to
The success rate of the searching was determined by calculating precision and recall values. Precision measures the proportion of the hits obtained which were correct. Recall measures the proportion of correct hits
obtained from the total number of expected hits. Both values are expressed as percentages. Note that we are using
either the structure authors or the PDB definitions of what is ‘correct’, therefore we are measuring really the
performance of NASSAM against these assignations. Unexpected hits were examined visually in order to discover
whether they were correct, but previously undocumented, or incorrect.
The precision and recall values for the testing dataset are given in Table 1 for the searches using all three
tolerance values. They are calculated from the total number of expected hits, correctly found hits and additional hits
for all base pair types combined. The table illustrates clearly the difference in results obtained from each of the
tolerance values used. At 20% tolerance one gains in precision but there is a cost to the recall and vice versa for the
40% tolerance value. At 40% tolerance the search returns significantly more bases in stacked orientations. Although
these are considered incorrect hits in our searches for planar base-base interactions, it illustrates the point that the
query pattern matrix and the tolerance value can be manipulated by the user to represent any orientation of bases
desired. Such trade-offs between recall and precision are typical in database searches of this sort. However it is clear
that the 30% tolerance value gives an excellent balance of high precision (91.0%) and recall (93%), and is clearly a
very good working tolerance to use.
This is an excellent performance for such a minimal representation and demonstrates the effectiveness of our
representation and searching methods. This is particularly shown for the 13 out of the 32 patterns where a hydrogen
bond vector is not explicitly part of the pattern matrix, and implies that our representation of the bases is appropriate
to describe orientations of bases with respect to each other regardless of the hydrogen bonding pattern. The A.C
N6-N3, N6-carbonyl interaction has an almost identical geometry to the A.C reverse Hoogsteen interaction and there is
significant overlap between the hits obtained for each of these patterns. This emphasises the point that it is a
base-base interaction geometry that is the target in our search, not a specific ‘named’ type of interaction. A query pattern
may be set up by the user to represent any particular orientation of a number of bases: in the case of base pairing for
example, one may wish to create query patterns based on the Watson-Crick/Hoogsteen/Sugar edge classification of
Leontis et al [38]. It is also able to distinguish very well between bases in similar yet subtly different orientations. For example, the cis and trans C.C amino-O2, amino-N3 pairs feature the same bonding interactions but differ in the
patterns using our representation. The search at 30% tolerance also locates a number of base pairs that had not been
previously documented in the sources we used, for example, two A.C reverse Hoogsteen pairs. Query patterns for
tandem mismatches such as tandem G.A sheared pairs and G.U wobble pairs successfully return all expected
examples in the test dataset. In all cases the 30% tolerance values give excellent recall and precision (see above) and
appear to be the values of choice.
Adenosine Platforms
The adenosine platform motif was first observed in the crystal structure of the P4-P6 domain of the group I
self-splicing intron [39]. It consists of two consecutive adenines in a strand, which form a pseudo base pair within
the helix with N3 of the 5’ base forming a hydrogen bond with N6 of the 3’ base. In the group I intron examples, a
non-canonical base pair below the platform alters the positions of the bases to increase stacking, which is believed to
be the driving force behind formation of the platform.
The motif occurs three times in the P4-P6 group I intron structure, once mediating an intramolecular
interaction and twice an intermolecular interaction. The intramolecular interaction involves an adenosine platform
within the tetraloop receptor motif where it serves to open the minor groove, allowing docking of the P5b GAAA
tetraloop with the receptor. The high proportion of adenosines found in RNA internal loops is suggestive of a key
role for adenosine in mediating helical packing within RNA structures [40] and it is thus possible that the adenosine
platform is a fairly widespread interaction motif.
With this in mind we have used our base representation to construct a pattern to allow searching for
coplanar adenosine bases as found in the adenosine platform. Searches were carried out on both the testing dataset
and the working dataset of RNA structures. The only hits returned from amongst the smaller RNA molecules were
the known platforms in the P4-P6 group I intron structure. Comparative sequence analysis for the AAG:U sequence
motif (which occurs at two of the platforms in the P4-P6 domain of the group I intron) with greater than 50%
conservation for the AAG sequence and greater than 33% for the G:U pair, had previously found thirteen possible
adenosine platform locations in Escherichia coli ribosomal RNA [41]. However, many of these locations are not conserved in either T. thermophilus or Haloarcula marismortui, the species from which the large subunit structure data we used was obtained. In a search at 30% tolerance no examples of the adenosine platform were found in the
numbers A51.A52, A54.A56). Four of these hits are consecutive adenines and on visual examination can be seen to
be coplanar and capable of forming the N3-N6 interaction. The fifth hit, A54.A56 in the loop B region of 5S RNA,
does not contain coplanar adenines. Base U55 is flipped out of the loop and base A56 moves to form the interaction
we observe with base A54. The region around this loop (base numbers 54-57) is heavily involved in interactions
with the L5 protein. Interestingly, the hit consisting of coplanar adenines in 5S RNA is also in loop B (bases
A51:A52), suggesting that a significant rearrangement of bases has occurred in this loop to facilitate protein
interactions. The search database contains a number of analogues of both the P4-P6 domain of the group I intron
and large ribosomal subunit RNA and the adenosine platforms found by NASSAM are conserved throughout these
structures.
The searches were carried out at increased tolerances of 40% and 50% but no further adjacent, coplanar
adenines were discovered, again confirming the general utility of the 30% tolerance value. This suggests, indeed,
that the adenosine platform interaction does not occur with great frequency and may not be as prevalent as was first
envisaged. It is also of note that NASSAM has enabled the discovery of adenosine platforms in a structural context
that is quite unlike the tetraloop receptor motif in the P4-P6 group I intron where the motif was first observed.
GAAA Tetraloop–Receptor Interaction
In the P4-P6 domain of the group I intron the GAAA tetraloop binds specifically to an 11-nucleotide
internal loop. Each adenosine of the GAAA tetraloop makes contact with part of the receptor, the specific
interactions are detailed in Cate et al. [12]. The interaction of the first adenosine in the tetraloop is with an A.U reverse Hoogsteen pair, with the adenosines forming an A.A N1-amino symmetric pair. NASSAM searches for this
type of two base pair interaction have also been undertaken and we successfully find this triple in the P4-P6 domain
of the group I intron. The second and third adenosines form rather more complex interaction networks with the
receptor. The interaction of the third adenosine in the GAAA tetraloop contains an example of a type I adenosine to
minor groove interaction. The adenosine to minor groove interaction is now recognised to be an important and
abundant mode of tertiary interaction in RNA [41] and is in fact the most abundant tertiary interaction in the large
ribosomal subunit [42]. The adenine interacts with the minor groove face of a Watson-Crick base pair, in this case a
Interaction between a GNRA tetraloop and a helical stem was also noted in the hammerhead ribozyme crystal
structure [1].
A pattern was constructed to search for the interaction involving the conserved adenine in the GNRA
tetraloop. The conservation of this particular base suggests that its interactions are likely to make important
contributions to the GNRA tetraloop – receptor complex. A NASSAM search at 30% tolerance correctly returns the
tetraloop – receptor interactions from the P4-P6 domain of the group I intron and the hammerhead ribozyme and we
have also performed the search on both the ribosomal subunits used earlier. The hits were examined for reasonable
(< 45o) planarity and for whether one of the interacting systems was a GNRA loop. The only example found in the
small ribosomal subunit is a very non-planar interaction and is not in a tetraloop. There are 18 GNRA type
tetraloops in the large ribosomal subunit 23S RNA and 1 in large ribosomal subunit 5S RNA and of our hits, 6
contain bases from a GNRA loop. Thus, approximately one third of GNRA loops in the 23S RNA are involved in a
tetraloop-receptor interaction of a similar nature to that observed in the P4-P6 group I intron structure. These
interactions are mainly between helices and loops contained within the same domain. There are two inter domain
interactions: one between Helix 52 (domain III) and Helix 66 (domain IV) and another between Helix 89 (domain
V) and Helix 39 (domain II).
The hits obtained which do not contain a tetraloop tend to be slightly less planar, but not so much as to
prohibit interaction. Appropriate hydrogen bonds may be made and the orientation of the central adenine is correct.
This set of hits consists of examples of adenosine to minor groove interactions with a G.C Watson-Crick base pair,
in which the adenine also forms a hydrogen bond with a guanine to form a G.A pair. The difference being that the
guanine and adenine forming this pair are not members of a GNRA tetraloop. The mode of interaction between the
bases is identical and is another example of the structural utility of unpaired adenine bases. This illustrates the
potential for NASSAM to uncover recurrent interaction types regardless of their sequence or structural context.
At higher tolerances four hits are discovered in the 30S subunit: 2 at 40% and a further 2 at 50%, these are
interactions with a GNRA loop but are generally more distant and less planar interactions than those seen at 30%.
No further legitimate hits are found for the 50S ribosomal subunit. The search has been repeated using different base
pairs in the receptor site. As it has been reported that the adenosine to minor groove interaction occurs
any other examples of GNRA tetraloops interacting with other Watson-Crick base pairs in the same manner as the
original P4-P6 domain of the group I intron example.
Novel and Unusual Base-Base Interactions
Platform-like Interactions
The adenosine platform motif has been described in detail above and consists of consecutive adenines in a strand
forming a pseudo base pair. We were interested to discover whether analogous base rearrangements could occur
involving other bases. Other types of platforms have been observed already. A conserved AU platform important for
protein recognition is reported in the ribosomal protein S8-RNA complex [45]. The same type of platform also
occurs in the HIV-1 RNA packaging signal [46]. A GU platform in a GUA triple in the sarcin/ricin loop of 23S large
ribosomal subunit RNA has also been documented [47]. The SCOR database [15] contains more than 20 examples
of platform arrangements. Target patterns were created for platforms consisting of all other combinations of bases
regardless of whether a hydrogen bond was possible between the bases. All possible base-base orientations were
considered and a NASSAM search was performed for each pattern.
All the currently known examples (as in SCOR [15] Nov 2002) were recovered by the NASSAM searches.
In addition a further 15 platforms were found. Many of these were base arrangements for which examples were
already recorded in SCOR. Platforms involving GU sequences are particularly prevalent. As well as the GU
platform already noted in the sarcin/ricin domain [47], 13 hits of a slightly different GU platform were found (of
which 6 are already recorded in SCOR), these correspond to the highly conserved large ribosomal subunit RNA GU
platform at 175.176 in H.marismortui and many of the other examples of this platform are themselves highly conserved. Fascinatingly, they occur almost exclusively in domains I and II in large ribosomal subunit RNA. Some
interesting hits of, to date, unrecorded platform types were also found. A GC platform in T. thermophilus small subunit ribosomal RNA was observed (G595.C596), in a Methanoccus jannaschii fragment this is an adenosine platform and although not highly conserved is considered to have an important structural role [45]. This is borne out
by the occurrence of the GC platform we find in the same position in T. thermophilus implying that the base and backbone rearrangement induced by platform formation is essential for the structure. The actual components of the
platform in this case are apparently irrelevant. A similar platform was also discovered by NASSAM in a signal
does not appear to be functionally important in this particular structure. A GG platform is found in the structure of
domain V of H.marismortui large ribosomal subunit RNA (G2616.G2617) and both guanines are highly conserved in archaea. This is at a key position in the peptidyl transferase centre, base numbers 2618 to 2620 are all implicated
in substrate binding as they have been shown to interact with substrate analogues incorporating the CCA portion of
A site tRNA [49]. The structural role of the platform may be that it creates a space within the cavity for the
subsequent bases to interact with the substrate. It is also possible that the platform provides an alternative means to
alter the backbone conformation during protein synthesis so that the positions of bases in that region are modulated
as required to allow movement of the CCA end of the tRNA during the translocation process. Although it may be
the case that some of these platforms are not so perfectly coplanar as the original adenosine platforms they are
clearly side-by-side arrangements and as such demonstrate the versatility of RNA to modify its conformation to
accommodate functionally important features.
A further demonstration of the utility of the side-by-side arrangement is seen in two RNA-protein structures
that contain a hairpin loop with high affinity for spliceosomal protein U1A, engineered to enhance crystallisation
[50-51]. A CU platform occurs in the loop for both these structures. It is not observed anywhere else in our dataset,
it is close to, but not in direct contact with the protein and it is almost certain to be important for the correct
orientation of bases within the protein binding site. It serves as another reminder of the flexibility of RNA that
enables it to form such a diverse range of contacts and interactions.
Unusual U.U Interaction
An unusual arrangement of uracils was noted by Leeper et al. in the NMR structure of a UGAGAU hexaloop in RNase P RNA [52]. It had been expected from the sequence that the central GAGA would form a GNRA type
tetraloop, but this is not the case and the closing uracil bases of the loop are arranged in a side-by-side fashion. A
target pattern was devised for this uracil arrangement and we searched through our full database of structures in
order to determine how frequently, if at all, this arrangement had occurred in other structures. A number of hits were
obtained, of which some were not coplanar and thus clearly did not match the query pattern, while many others were
coplanar but did not match exactly the arrangement seen in RNase P RNA. However, a small number did give a
good match to the target structure in terms of base orientation, although in general the backbone orientation is
variable. Most of these are in hairpin tetraloops where the uracils are the first and final bases in the loop. All of these
GNRA tetraloop. However, in the RNase P RNA example it appears to be the case that the U.U interaction is
stabilising a non GNRA like conformation which is essential for activity [52]. The difference being clearly that in
this example the uracils are not part of the backbone turn as is the case in our hits. The most similar previously
unreported hit we observe occurs in helix 65 of the H. marismortui. large ribosomal subunit RNA, where the ring atoms of U 1831 and U 1846 pair superpose on the U 14 and U 9 pair of RNaseP with an root mean square
deviation of 1.01 Å (Figure 4c). Note that the uracils are in different sequence orders in the two structures,
illustrating the sequence independence of the searching process. Both the uracils involved are participating in other
interactions as in fact are many of the bases in that region. The significance, if any, of the juxtaposition of bases we
see remains unclear. Our investigation shows that the arrangement of uracils described is rare, a fact which we were
able to determine in a very short time using NASSAM. In this case, the utility of NASSAM lies in its ability to
rapidly search the structural database and screen out a large fraction of the data, leaving only potential close matches
to be examined more exhaustively.
Conclusions
We have demonstrated that a minimal representation of nucleic acid bases can be used in performing
searches for specific structural features in large RNA structures. The database of nucleic acid structures is now
expanding rapidly and there is a need for efficient searching methods and the ability to detect subtle differences
between related structures [15]. The method has been tested by searching successfully for different base pair types.
The real utility of the method was then shown by searching for more complex patterns such as
GNRA-tetraloop-receptor interactions. Excellent rates of precision and recall were obtained for all structures surveyed where
measurement of these values was possible, and we were additionally able to identify occurrences of interactions
which had not previously been recorded including novel platform interactions. The method is versatile and patterns
can easily be constructed for any orientation of bases. This also means that query patterns can be created for novel
base orientations and we have presented the results of searches using some novel patterns. Furthermore, NASSAM
may be used to validate the discovery of a new structural feature by comparison with other structures contained
within the structural database. It has also been shown to be useful when comparing structures where subtle
differences in structure may be observed. When the database has grown to include, for example, more different
example, different substrates bound or from different species. The distribution of motifs within a complex molecule
is also a further area for study which may provide some further insight into the evolution and folding pathways of
complex RNA. The finding of the GC platform in 16S T. thermophilus RNA, rather than the AA platform previously observed at the same position in M. jannaschii indicates that there may be a certain amount of structural conservation at some level that is not necessarily reflected in the sequence and the search method we describe
provides an easy way to discover such structural alignments.
The hits found in some of our NASSAM searches have contributed further to our knowledge and
understanding of the distribution and types of interactions that are important in shaping complex RNA structure.
Acknowledgements
We thank the Biotechnology and Biological Sciences Research Council for funding, and the Royal Society
and the Wolfson Foundation for computing facilities. The Krebs Institute for Biomolecular Research is a designated
centre of the Biotechnology and Biological Sciences Research Council.
References
1. Pley, H. W., Flaherty, K. M. and McKay, D. B., Nature, 372 (1994) 68.
2. Scott, W. G., Finch, J. T. and Klug, A., Cell 81 (1995) 991.
3. Schluenzen, F., Tocilj, A., Zarivach, R., Harms, J., Gluehmann, M., Jonell, D., Bashon, A., Bartels, H., Agmon,
I., Franceschi, F. and Yonath, A., Cell 102 (2000) 615.
4. Wimberly, B. T., Brodersen, D. E., Clemons, W. M., Morgan-Warren, R. J., Carter, A. P., Vonrhein, C, Hartsch,
T. and Ramakrishnan, V., Nature 407 (2000) 327.
5. Ban, N., Nissen, P., Hansen, J., Moore, P. B. and Steitz, T. A., Science 289 (2000) 905.
6. Yusupov, M. M., Yusupova, G. Z., Baucom, A., Lieberman, K., Earnest, T. N., Cate, J. H. D. and Noller, H. F.,
Science 292 (2001) 883.
7. Kim, S., Suddath, F., Quigley, G., McPherson, A., Sussman, J., Wang, A. H. J., Seeman, N. and Rich, A.,
8. Ladner, J., Jack, A., Robertus, J., Brown, R., Rhodes, D., Clark, B. and Klug, A., Proc. Natl. Acad. Sci. USA, 72
(1975) 4414.
9. Chang, K. Y. and Tinoco Jr, I., J. Mol. Biol. 269 (1997) 52.
10. Steitz, T. A., Moore, P. B., Freeborn, B. and Correll, C. C., Cell 91 (1997) 705.
11. Zimmermann, G. R., Jenison, R. D., Wick, C. L., Simorre, J. P. and Pardi, A., Nature Struct. Biol. 4 (1997) 644.
12. Cate, J. H., Gooding, A. R., Podell, E., Zhou, K., Golden, B. L., Kundrot, C. E., Cech, T. R. and Doudna, J. A.,
Science 273 (1996) 1678.
13. Westhof, E., Michel, F. and Jaeger, L., J. Mol. Biol. 236 (1994) 3491.
14. Moore, P. B., Annu. Rev. Biochem 68 (1999) 287.
15. Klosterman, P. S., Tamura, M., Holbrook, S. R. and Brenner, S. E., Nucl. Acids Res. 30 (2002) 392.
16. Rao, S. T. and Rossmann, M. G., J. Mol. Biol. 76 (1973) 241.
17. Artymiuk, P. J., Grindley, H. M., Kumar, K., Rice, D. W. and Willett, P., FEBS Letters 324 (1993) 15.
18. Willett, P., J. Mol. Recog. 8 (1995) 290.
19. Willett P., (1999) In Rational Drug Design (Truhlar, D. G., Howe, W. J., Hopfinger, A. J., Blaney, J. D. & Dammkoehler, R., eds.), pp. 11-38. Springer-Verlag, New York.
20. Brint, A. T., Davies, H. M., Mitchell, E. M. and Willett, P., J. Mol. Graph. 7 (1989) 48.
21. Mitchell, E. M., Artymiuk, P. J., Rice, D. W. and Willett, P., J. Mol. Biol. 212 (1990) 151.
22. Grindley, H. M., Artymiuk, P. J., Rice, D. W.and Willett, P., J. Mol. Biol. 229 (1993) 707.
23. Holm, L. and Sander, C., J., Mol. Biol. 233 (1993) 123.
24. Orengo, C. A. and Taylor, W. R., J. Mol. Biol 233 (1993) 488.
25. Madej, T., Gibrat, J.-F. and Bryant, S. H., Proteins: Struct. Funct. Genet. 23 (1995) 356.
26. Artymiuk, P. J., Rice, D. W., Mitchell, E. M. and Willett, P., Prot. Engin. 4 (1990) 39.
27. Artymiuk, P. J., Grindley, H. M., Park, J. E., Rice, D. W. and Willett, P., FEBS Letters 303 (1992) 48.
28. Artymiuk, P. J., Poirrette, A. R., Grindley, H. M., Rice, D. W. and Willett, P., J. Mol. Biol 243 (1994) 327.
29. Kannan, N. and Vishveshware, S., J. Mol. Biol. 292 (1999) 441.
30. Schmitt, S., Hendlich, M. and Klebe, G., Angew. Chemie Intl. Ed. 40 (2001) 3141.
31. Gendron, P., Lemiuex, S. & Major, F. J. Mol. Biol. 308 (2001) 919.
32. Ullmann, J. R., J. Assoc. Comput. Machinery16 (1976) 31.
34. Berman, H. M., Westbrook, J., Feng, Z., Gilliland, G., Bhat, T. N., Weissig, H., Shindyalov, I. N and Bourne, F.
E., Nucl. Acids Res. 28 (2000) 235.
35. Saenger, W. In Principles of Nucleic Acid Structure. Springer-Verlag, New York 1984.
36. Tinoco Jr, I. In The RNA World (Gesteland, R. F. and Atkins, J. F., eds.), pp. 603-607. Cold Spring Harbour
Laboratory Press 1993.
37. Leontis, N. B. and Westhof, E., RNA 7 (2001) 499.
38. Leontis, N. B., Stombaugh, J. and Westhof, E., Nucl. Acids Res. 30 (2002) 3497.
39. Cate, J. H., Gooding, A. R., Podell, E., Zhou, K., Golden, B. L., Szewczak, A. A., Kundrot, C. E., Cech, T. R.
and Doudna, J. A., Science 273 (1996) 1696.
40. Woese, C. R., Winker, S. and Gutell, R. R., Proc. Natl. Acad. Sci. USA, 87 (1990) 8467.
41. Gutell, R., Cannone, J. J., Shang, Z., Du, Y. and Serra, M. J., J. Mol. Biol. 304 (2000) 335.
42. Nissen, P., Ippolito, J. A., Ban, N., Moore, P. B. and Steitz, T. A., Proc. Natl. Acad. Sci. USA, 98 (2001) 4899.
43. Doherty, E. A., Batey, R. T., Masquida, B. and Doudna, J. A., Nature Struct. Biol. 8 (2001) 339.
44. Battle, D. J. and Doudna, J. A., Proc. Natl. Acad. Sci. USA, 99 (2002) 11676.
45. Tishchenko, S., Nikulin, A., Fomenkova, N., Nevskaya, N., Nikonov, O., Dumas, P., Moine, H., Ehresmann, B.,
Ehresmann, C., Piendl, W., Lamzin, V., Garber, M. & Nikonov, S., J. Mol. Biol. 311 (2001) 311.
46. Amarasinghe, G. K., De Guzman, R, N., Turner, R. B. & Summers, M. F., J. Mol. Biol. 299 (2000) 145.
47. Correll, C. C., Wool, I. G. and Munishkin, A., J. Mol. Biol. 292 (1999) 275.
48. Oubridge, C., Kugslatter, A., Jovine, L. and Nagai, K., Mol. Cell 9 (2002) 1251.
49. Nissen, P., Hansen, J., Ban, N., Moore, P. B. and Steitz, T. A., Science 289 (2000) 920.
50. Rupert, P. B. and Ferre-D’Amare, A. R., Nature 410 (2001) 780.
51. Ferre-D’Amare, A. R., Zhou, K. and Doudna, J. A., Nature 395 (1998) 567.
52. Leeper, T. C., Martin, M. B., Kim, H., Cox, S., Semenchenko, V., Schmidt, F. J. and Van Doren, S. R. Nature
Struct. Biol. 9 (2002) 397.
Tables
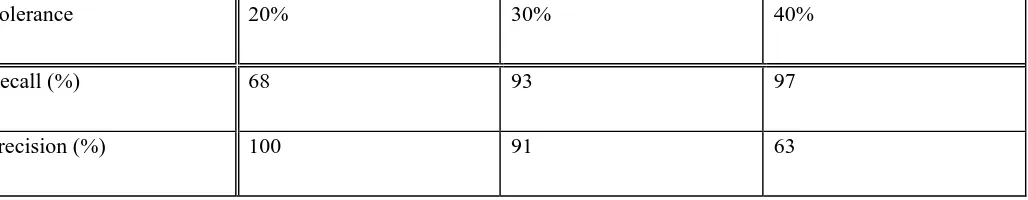
Table 1: The precision and recall of a NASSAM search for base pairing orientations using the testing
dataset. Results are given for three different tolerance values. These are selected by the user at run-time.
Tolerance 20% 30% 40%
Recall (%) 68 93 97
Precision (%) 100 91 63
Figure legends
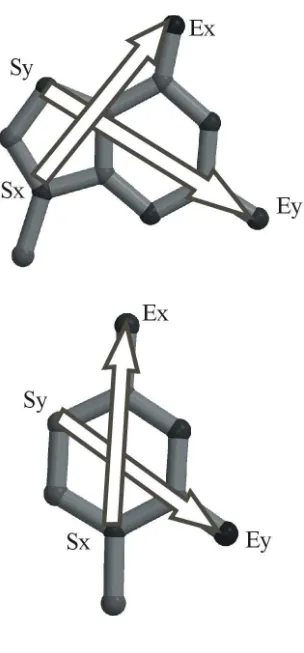
Figure 1
The vectors describing the bases in the NASSAM scheme. (a) guanine, the x vector runs from N9 to O6, the y vector
from N7 to N2. (b) cytosine, the x vector runs from N1 to N4, the y vector from C5 to O2. Analogous vector
orientations are used for adenine and uracil. Figure was prepared using Molscript [53].
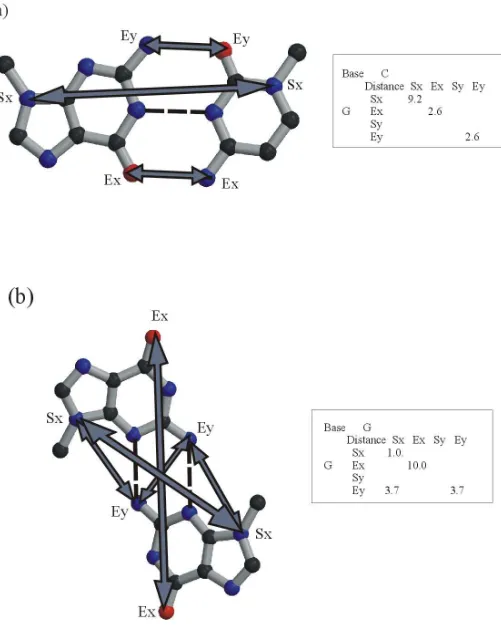
Figure 2
Some NASSAM search patterns for (a) the G.C Watson-Crick base pair, (b) the G.G N3-amino symmetric (GGN3)
base pair. Hydrogen bonds are shown as dashed lines and measured vector distances as solid arrows. Figure
prepared using Molscript [53].
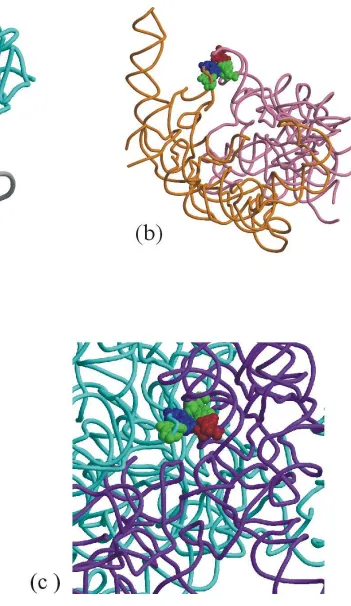
Figure 3
Hits obtained using NASSAM during the evaluation process. (a) The adenosine platform hit in 5S ribosomal RNA
of the large ribosomal subunit [5]. A backbone trace of bases 1-74 of the 5S RNA (grey) is shown together with
protein L5 (cyan). Some of the bases in loop B are shown as spacefilling representations. Bases A51 and A52
(b) A GAAA tetraloop-receptor complex in the large ribosomal subunit [5]. Close up view of the interaction
between Helix 52 (domain III) and Helix 66 (domain IV). Guanine is shown in green, adenine in blue and cytosine
in crimson. (c) Close up view of the interaction between Helix 89 (domain V) and Helix 39 (domain II). The bases
are coloured in the same way as described above. Figure prepared using Molscript [53].
Figure 4
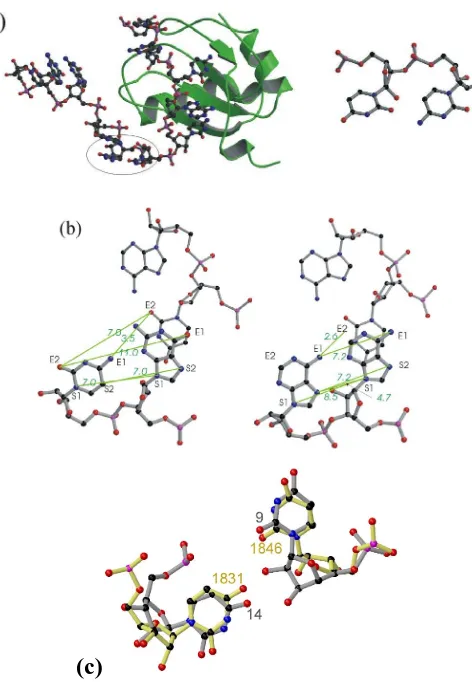
Hits obtained from searches for novel base patterns using NASSAM (a) Left. The CU platform observed in the
engineered loop of the hepatitis delta virus [50]. The nucleic acid is shown as a ball-and-stick representation while
the protein is represented as green ribbons. The platform bases are not themselves involved in protein interactions.
Right. A close up view of the platform interaction. (b) Left. The GC platform located in the T. thermophilus small ribosomal subunit RNA [4]. It is shown together with the conserved AU platform (indicated by thinner sticks) and
the stacking of the purine of the GC platform on the uracil of the AU platform is observed. On the right is the
platform from M. jannaschii [44] again with the conserved AU platform shown in thinner sticks. The similarity in mode of interaction is clear, as in this case an adenine from the adenosine platform stacks on the uracil. Distances (in
Å) used in the search patterns are shown in green, and are indicated by green lines. (c) The UU motif in RNase P.
The structure from RNase P is shown in grey (U9 and U18) and the structure from the H. marismortui large ribosomal subunit (shown in yellow, U1846 and U1831)is shown superposed on it. Although the realtive
orientations of the uracils are strikingly similar, note that these bases occur in different orders in the two sequences
Figure 4
Supplementary Material:
The PDB file identifiers of the structures in the testing dataset
157d 205d
1gid 255d
1hmh 259d
1osu 280d
1rna 283d
1rxa 300d
1rxb 353d
1sdr 354d
1tra 356d
The PDB file identifiers of the structures used in the analysis Dataset