University of Southern Queensland
Core Muscle Function in Young
Adults Aged 18 to 30
A thesis submitted by:
HAZHEER RASIF (BSc)
As partial fulfilment of the requirements of the degree of
Bachelor of Science Honours
Background:The core or the lumbopelvic region of the body is a complex that comprises
many anatomical structures that act in concert to maintain core stability and function.
Good core muscle function plays an important role in maintaining good spinal health by
reducing occurrences of lower back pathologies and injuries. In addition, it plays a vital
role in reducing lower limb injuries. However, gender differences, the effects of age,
physical activity, and body composition on core muscle function of young adults have
not been fully understood.
Aims:Using a cross-sectional study design, the project aimed to investigate the effects
of physical activity and body composition on core muscle function. In addition, the
project explored gender and age related differences in core muscle function in young
adults. Moreover, the relationship between core muscle function and lower limb muscle
function was examined.
Methods:98 young adults (men = 48, women = 50) between the ages of 18 to 30
participated in this project. Body composition variables such as height, weight, body
mass index (BMI), sum of skinfolds (subcutaneous fat mass) and waist circumference
were measured. Lengths of time holding the front bridge and side bridge were recorded
as measure of core muscle function. Standing long jump distance was recorded as
measure of lower limb muscle function. Weekly exercise duration was used as measure
of physical activity level and this information was collected using a questionnaire. IBM
SPSS statistics software version 19 was used to run descriptive statistics, one-way
analysis of variance (ANOVA), and correlation analysis among the variables.
Results:It was found that increased subcutaneous fat mass, weight and waist
and lower limb muscle function than women (p < 0.05). Exercise duration had a
moderate positive correlation with core muscle function in men only (p < 0.05).
Significant positive correlation was present between core muscle function and lower
limb muscle function in men only (p < 0.05). No significant association was observed
between age and core muscle function and lower limb muscle function in young adults.
Conclusion:The results suggest that young men have better core and lower limb muscle
function compared to young women. This may have been due to the higher muscle mass
and lower fat mass in men. In addition, body composition is a good predictor of core and
lower limb muscle function. Further, side bridge exercise may not be a good core muscle
assessment tool for untrained women due to their intrinsically weak core muscle
I would like to thank Dr Jianxiong Wang, my principal supervisor, for his supervision of
my Honours study at University of Southern Queensland. Dr Wang has assisted me
immensely and has provided the best learning environment one could ask for. His
dedication in helping me increase my research skills and writing ability has proven to be
a priceless asset. He has truly gone above and beyond expectations to make my Honours
project a success.
I would like to thank Dr Dean Mills, my co-supervisor, for his continuous support and
advice. He has helped me in more than one way in improving my writing ability.
I would like to thank Dr John Dearnaley for his encouragement, support and dedicating
his time to assist me throughout my honours project.
I would like to thank Professor Lindsay Brown and Dr Mark lynch for their valuable
academic advice.
I would like to thank the Willowburn soccer club in Toowoomba, for giving me the
opportunity to recruit participants from their soccer club.
Most importantly, I would like to thank my family, my mother: Farida Rasif, my aunt:
Aziza Parwani, and my brother: Farrukh Rasif, for their continuing love, support and
I, Hazheer Rasif, certify that the work reported in this thesis is entirely my own effort,
except where otherwise acknowledged. This thesis is an original document created to
fulfil the requirements of the Bachelor of Science Honours degree at University of
Southern Queensland and I certify that it has not been submitted previously as part of
requirement for courses at this or any other institution.
Candidate Signature:
Student Number: Date:
0050010157 ____08/10/2015____
ENDORSEMENT
Supervisors:
Supervisor Name: Associate Supervisor name:
Jianxiong Wang Dean Mills____
Signature: Signature:
Date: Date:
Table of Contents
Abstract... i
Acknowledgements ...iii
Declaration...iv
Table of Contents...v
List of Figures...x
List of Tables ...xiii
Abbreviations...xiii
Chapter One: Introduction... 1
1.1 Background ... 1
1.2 Statement of the Problem ... 2
1.3 Aims ... 3
1.4 Hypotheses ... 3
1.5 Significance ... 4
Chapter Two: Literature review... 5
2.1 Introduction ... 5
2.2 The core ... 6
2.2.1 The passive subsystem... 6
2.2.2 The active subsystem... 8
Transverse Abdominis... 9
Rectus Abdominis and the Obliques ... 9
Interspinales and Intertransversarii... 11
Erector Spinae... 11
Quadratus Lumborum... 12
Pelvic girdle, Diaphragm and Hip musculature... 13
Thoracolumbar Fascia ... 14
2.2.3 The neural subsystem... 14
2.3 Pathologies ... 15
2.3.1 Lower back pain ... 15
2.3.2 Lower extremity injuries ... 16
2.4 Core muscle function in sports ... 17
2.5 Training and rehabilitation programs... 19
2.6 Future directions... 21
2.7 Conclusion... 22
Chapter Three: Methodology ... 23
3.1 Ethics approval... 23
3.2 Study design... 23
3.3 Participants ... 23
3.3.1 Inclusion and exclusion criteria... 24
3.3.2 Participant recruitment methods ... 24
3.3.3 Information sheet ... 24
3.3.4 Consent form ... 25
3.4.1 Body composition ... 25
3.4.2 Physical activity... 26
3.4.3 Core muscle function... 26
The front bridge ... 26
The side bridge... 27
3.4.4 Lower limb muscle function... 27
3.5 Data analyses ... 28
3.5.1 One-way ANOVA... 28
3.5.2 Pearson’s Correlation test ... 28
Chapter Four: Results ... 29
4.1 Descriptive statistics & gender related differences... 29
4.3 Body Composition and Core muscle function Correlation ... 31
4.3.1 Results for men... 31
Sum of skinfolds, bridge times and long jump distance ... 32
Waist circumference, bridge times and long jump distance ... 33
Weight, bridge times and long jump distance ... 34
BMI, bridge times and long jump distance ... 35
4.3.2 Results for women ... 36
Sum of Skinfolds, bridge times and long jump distance ... 37
Waist circumference, bridge times and long jump distance ... 38
Weight, bridge times and long jump distance ... 39
4.4 Exercise duration, bridge times and long jump distance... 41
4.4.1 Results for men... 41
4.4.2 Results for women ... 42
4.5 Bridge times and long jump distance ... 43
4.5.1 Results for men... 43
4.5.3 Results for women ... 44
4.6 Age related difference in core muscle function ... 45
4.6.1 Results for men... 45
4.6.3 Results for women ... 47
Chapter Five: Discussion... 49
5.1 Gender related difference in core muscle function... 49
5.2 Body Composition and Core Muscle Function... 51
5.2.1 Sum of Skinfolds and Core Muscle Function... 51
5.2.2 Waist Circumference and Core Muscle Function ... 53
5.2.3 Weight and Core muscle Function... 54
5.2.4 BMI and Core Muscle Function... 55
5.2.5 Body composition and side bride times on women ... 57
5.3 Physical Activity and Core Muscle Function ... 58
5.4 Core muscle function and lower limb muscle function ... 59
5.5 Age related difference in core muscle function ... 61
5.6 Limitation and Future Direction... 63
References ... 67
Appendices ... 1
Appendix 1: Information sheet... 1
Appendix 2: Consent form ... 3
List of Figures
Figure 1 The passive subsystem (Source: Moore et al. 2014) ... 7
Figure 2 The passive subsystem and the deep core muscle origin and insertion points (Source: Marieb & Hoen 2010)... 8
Figure 3 The main muscles of the active subsystem (Source: Marieb & Hoehn 2010) .... 10
Figure 4 Deep core musculature... 12
Figure 5 The Bird Dog... 20
Figure 6 The Curl Up ... 20
Figure 7 The Front Bridge Exercise ... 26
Figure 8 The side bridge exercise... 27
Figure 9 The Standing Long Jump Exercise ... 28
Figure 10 Bar chart showing gender specific difference in core muscle and lower limb muscle function ... 30
Figure 11 Scatter plot showing correlation of sum of skinfolds with front bridge times (p < 0.01) and side bridge times (p < 0.01), and long jump distance (p < 0.01) in young men ... 32
Figure 13 Scatter plot showing correlation of weight with front and side bridge times (p
< 0.05), and long jump distance (p > 0.05) in young men. ... 34
Figure 14 Scatter plot showing correlation of BMI with front bridge times (p < 0.05) and
side bridge time (p < 0.01), and long jump distance (p > 0.05) in young men ... 35
Figure 15 Scatter plot showing correlation of Sum of Skinfolds with front bridge times (p
<0.01) and side bridge times (p > 0.05), and long jump distance (p < 0.05) in young
women. ... 37
Figure 16 Scatter plot showing correlation of waist circumference with front bridge
times (p < 0.01) and side bridge times (p > 0.05), and long jump distance (p > 0.05) in
young women ... 38
Figure 17 Scatter plot showing correlation of weight with front bridge times (p <0.05)
and side bridge times (p > 0.05), and long jump distance (p > 0.05) in young women.... 39
Figure 18 Scatter plot showing correlation of BMI with front bridge times (p > 0.05) and
side bridge times (p > 0.05), and long jump distance (p > 0.05) in young women... 40
Figure 19 Scatter plot showing correlation of exercise duration with front bridge times (p
< 0.05) and side bridge times (p <0.05), and long jump distance (p > 0.05) in young men
... 41
Figure 20 Scatter plot showing correlation of Exercise duration with front bridge times (p
> 0.05) and side bridge times (p > 0.05), and long jump distance (p > 0.05) in young
women. ... 42
Figure 21 Relationship between long jump distance and front bridge times (p <0.05) and
Figure 22 Relationship between front and side bridge in young women (p < 0.01). Right:
Relationship between long jump distance and bridge times in young women (p > 0.05).
... 44
Figure 23 Bar chart shoes the age related difference in core and lower limb muscle
function in young men... 46
Figure 24 Bar chart shoes age related difference in bridge times and long jump distance
List of Tables
Table 1 Descriptive statistics of body composition, exercise duration, and core muscle
and lower limb muscle function in men and women ... 29
Table 2 Correlation analysis of body composition and exercise duration with core and
lower limb muscle function in young men (n = 48). * Correlation is significant at the 0.05
level (1-tailed). ** Correlation is significant at the 0.01 level (1-tailed)... 31
Table 3 Correlation analysis of body composition and exercise duration with core and
lower limb muscle function in young women (n = 50). * Correlation is significant at the
0.05 level (1-tailed). ** Correlation is significant at the 0.01 level (1-tailed)... 36
Table 4 Age related descriptive analysis of core and lower limb muscle function in young
men (n = 48)... 45
Table 5 Age related descriptive analysis of core and lower limb muscle function in young
women (n =50)... 47
Abbreviations
CNSCentral Nervous System
PNSPeripheral Nervous System
EMGElectromyography
Chapter One: Introduction
1.1 Background
Movement in human body is governed by nervous and musculoskeletal systems which
complement each other. Musculoskeletal activity is controlled by the central and
peripheral nervous system (CNS & PNS) in response to internal or external stimuli.
Mechanosensors, such as osseous and ligamentous tissues, connective tissue, and
muscle spindles feedback information to the CNS via the PNS. CNS then responds to the
input to initiate, or inhibit movement via muscle contractions and relaxation depending
on the stimulus (Behm et al. 2010).
Muscles exert force on skeletal bones that act as levers which enable human movement
(Turner 1998). In addition, muscles provide balance, stability, act as shock absorbers and
protect vital internal organs. Muscles of the lumbopelvic region of the body i.e. core
muscles particularly serve this function and facilitate trunk rotation, load transfer and
stabilisation of the lumbopelvic region (McGill 2010). Core muscles provide the strength
and endurance required to maintain dynamic stabilisation of the body and support to
the lumbar spine and pelvic systems (Panjabi 1992a).
Core muscles work in a feed forward manner to protect the spine from excessive
movement and compressive forces caused by external stimuli. Without well-developed
core muscles, the body is no longer able to stabilise itself during activity (Panjabi 1992a,
McGill 2010, Colsten 2012a, Warren et al. 2014, Leetun et al. 2004, Wilson et al. 2005,
Ferreira et al. 2007). Poor core muscle function may lead to excessive stress being
placed on the spine, which can result in lower back pain, lower back and lower extremity
injuries (Colsten 2012a, Warren et al. 2014, Leetun et al. 2004, Wilson et al. 2005,
1.2 Statement of the Problem
Male and female individuals differ vastly when comparing muscle function and capacity.
However, there are few studies that report gender related differences in core muscle
function of young adults aged 18 to 30. There are studies on core muscle function in
young people (Chon et al. 2010, Behm et al. 2005, Steffen et al. 2008, Arnold et al. 2015)
but they did not report on differences between males and females. Although, it is
widely accepted that muscle function is influenced by age, the changes that occur in
core muscle function between ages of 18 to 30 years has yet to be documented.
Regular exercise improves and maintains good muscle function. Yu and Lee (2012)
investigated the effects of eight week Pilates training on core stability in 40 healthy
individuals aged 25 to 35. They found that the Pilates training program significantly
improved core stability in the training group when compared to the control group.
Stanton et al. (2004) demonstrated that six weeks of core stability training improved
core muscle function in young male athletes. These studies demonstrate the efficacy of
different exercise interventions on core muscle function. However, there are few
cross-sectional studies about the effects of daily physical activity on core muscle function in
healthy young adults.
Behm et al. (2005) investigated the efficacy of unstable and unilateral resistance
exercises on core muscle activity of healthy individuals age 20 to 45. They found that
performing resistance exercises for the limb improved core muscle function. Wilson et
al. (2006) reported that knee strength and joint orientation were influenced by hip
musculature, suggesting a relationship between lower limb muscle function and core
muscle function. Few studies have presented cross-sectional data on this relationship in
In a recent study, Ervin et al. (2014) assessed core, upper and lower body muscle
strength in children and youth aged between 6 to 15 years. They found that as body
weight increased, the length of time the bridge was held decreased. They concluded
that increasing body weight is negatively correlated with core muscle strength. Further
research is needed to determine whether body composition affects core muscle
function in young adults.
1.3 Aims
This project aimed to gain a deeper understanding of core muscle function and the
variables that affect it by presenting cross-sectional data on the variables that influence
core muscle function in young adults aged 18 to 30 years. Firstly, this study investigated
gender related differences and age related changes in the core muscle function of young
adults. Secondly, this study provided evidence of how exercise duration affects core
muscle function. Thirdly, influences of body composition factors such as body weight,
BMI, sum of skinfolds, and waist circumference on core muscle function was
investigated. Finally, the relationship between lower limb function and core muscle
function was explored.
1.4 Hypotheses
In this project the following hypotheses were examined:
1. There is a difference between core muscle function of young men and women
age 18 to 30 years.
2. Increased weight, BMI, sum of skinfolds, and waist circumference negatively
affects core muscle function.
3. Exercise duration improves core muscle function.
5. Age related changes exist in core muscle function of young adults aged 18 to 30
years.
1.5 Significance
Poor core muscles function has been linked lower back pathologies (Colsten 2012a,
Warren et al. 2014, Leetun et al. 2004, Wilson et al. 2005, Ferreira et al. 2007).
According to Australian Institute of Health and Wellbeing (AIHW) (2015) in 2011-12, 14%
of Australians reported back problems. In addition, Global Burden of Disease reports
that lower back pain is ranked first in Australasia (Australia, New Zealand, the island of
New Guinea, and neighbouring islands in the Pacific Ocean) (AIHW 2015).
A research study that examines the above hypotheses (listed in section 1.4) and
contributes to the existing body of knowledge will be beneficial in gaining a deeper
understanding of core muscle function and the variables that affect it. The knowledge
gained will enable better intervention design that will help young adults better assess
and improve their core muscle function so that they can avoid pain and injury. This in
turn will have a positive impact on their quality of life, reduce financial impact due to
less visits to healthcare professionals.
So far, there has been a lack of studies that report gender related differences and
age-related changes in core muscle function of young adults. As far as we know, this study is
the first attempt to explore how factors such as body composition and training state
Chapter Two: Literature review
Following literature review will provide detailed overview of the core muscles and their
function. In addition, it will explain disorders that arise from poor core muscle function.
Moreover, an overview of future directions and the study questions that arise as the
outcome of the review will be discussed.
2.1 Introduction
The core or the lumbopelvic region of the body is a complex that comprises many
anatomical structures that act in concert to maintain core stability and function. The
main purpose of the core is to provide a stable foundation for the movement of upper
and lower extremities (Panjabi 1992a, McGill 2001, Willardson 2007a). In addition, the
core maintains the spine within the physiological limits in order to protect the spinal
cord and propagating nerves (Colsten 2012a, Warren et al. 2014, Willardson 2007a). In
contrast to other muscles of the body, core musculature functions to inhibit motion
rather than initiate it. This is key to the core musculature’s ability to maintain spinal
stiffness and stability (McGill 2010).
The anatomical structures that comprise the core have been a matter of debate. Kibler
et al. (2006) argued that the core consists of the musculoskeletal structures of the spine,
hips, pelvis, abdomen, and the proximal lower limb. In contrast to this, Akuthota &
Nadler (2004) defined the core as comprising the diaphragm as the roof; the pelvic floor
and hip girdle as the floor; and the abdominals, spinal, and gluteal muscles serving as
the walls. Frank et al. (2013) proposed that the core consists of the deep cervical flexors,
deep spinal extensors of cervical, thoracic and lumbar regions, the diaphragm, pelvic
floor, and the abdominals. In summary, the muscles, osseous and ligamentous, and
movement, maintain spinal stiffness and integrity, transfer force from lower body to the
upper body and vice versa make up the core.
To this date, the most commonly accepted model for the core is one that was devised by
Panjabi (1992a). Panjabi (1992a) categorised the core into three major components: the
passive, active and neural subsystems. In this review, these subsystems will be discussed
in detail to provide an insight into the core anatomy and physiology. In addition, this
review will discuss some of the pathologies associated with poor core muscle function
and how these pathologies are investigated, and treated.
2.2 The core
Panjabi (1992a) divided the core into three subsystems; passive, active and neural
subsystems. The passive subsystem supports minimal load as it consists of ligaments and
facet articulations (Panjabi 1992a). The active subsystem consists of muscles that
support the body mass and other loads associated with body movements and activities
(Panjabi 1992a, McGill 2001). The neural subsystem controls the active and passive
subsystems via communication between CNS and mechanoreceptors (muscle spindles,
spinal ligaments and Golgi tendon organs) present in the passive and active subsystems
(Panjabi 1992a, McGill 2001). Using feedback from the mechanoreceptors, the neural
subsystem activates the active subsystem to create tension, which generates
compressive forces between lumbar vertebrae to stabilise in the lumbar spine (Panjabi
1992a, Panjabi 1992b, McGill 2001). These subsystems are integrated together to
provide core stability during movement and maintain correct posture.
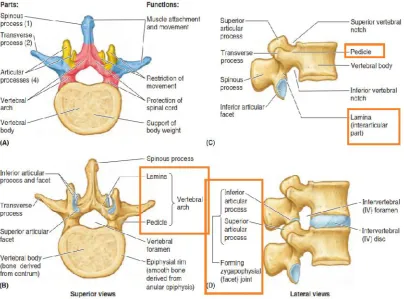
2.2.1 The passive subsystem
The passive subsystem consists of osseous and ligamentous structures of the vertebrae
subsystem (Figures 1 & 2). These structures provide passive stiffness to the lumbar spine
and include zygapophyseal joints, pedicle, lamina, pars interarticularis and muscle
attachment sites (Panjabi 1992a, Akuthota & Nadler 2004). This subsystem cannot
handle external loads. Excessive lumbar flexion and extension will cause failure in the
passive subsystem which leads to poor spinal stability and injury (Panjabi 1992a, Panjabi
1992b). The passive subsystem is supported by the active subsystem. According to
Akuthota & Nadler (2004), weak muscular control leads to excessive loads on the spine
[image:21.595.133.538.287.586.2]causing damage to the intervertebral disks.
Figure 2 The passive subsystem and the deep core muscle origin and insertion points (Source: Marieb & Hoen 2010)
2.2.2 The active subsystem
The active subsystem constitutes the muscles that provides support to the passive
subsystem, controls movement and is responsible for core stability (Figures 3 & 4).
Bergmark (1989) divided the core musculature into two groups according to their
function; local and global muscles.
The local muscles consist of transversus abdominis, multifidi, interspinales,
intertransversarii, local erector spinae muscle (Iliocostalis lumborum, longissimus
lumborum), and the quadratus lumborum (medial fibres). They are made up of type I
skeletal muscle fibres and are fatigue resistant. They are directly attached to the
vertebrae and can only generate minimal torque due to their small momentum arm.
Their main function is to provide precise control of spinal vertebrae and posture control
Global muscles consist of the rectus abdominis, global erector spinae muscle group
(longissimus thoracis and Iliocostalis thoracis), quadratus lumborum (lateral fibres),
internal oblique and external obliques (Bergmark 1989, Warren et al. 2004). They attach
to the hip and thorax, and have a larger moment arm to generate torque to counteract
the external forces placed on the spine during movement (Bergmark 1989, Warren et al.
2014). The function of the core muscles are discussed separately below.
Transverse Abdominis
The transverse abdominis (Figure 3) play an important role in creating intraabdominal
pressure and support the spine during movement. The horizontally orientated fibres of
the transverse abdominis when contracted create tension within the thoracolumbar
fascia and co-contraction of the diaphragm and the pelvic floor muscles generate
intraabdominal pressure (Cresswell et al. 1992). This creates stiffness within the core
and protects the spine by decreasing the compression forces exerted on it. Transverse
abdominis functions in a feed-forward manner and activates prior to movement to avoid
spinal displacement (Colsten 2012). Absence of this protective mechanism may result in
lower back pathologies (Colsten 2012).
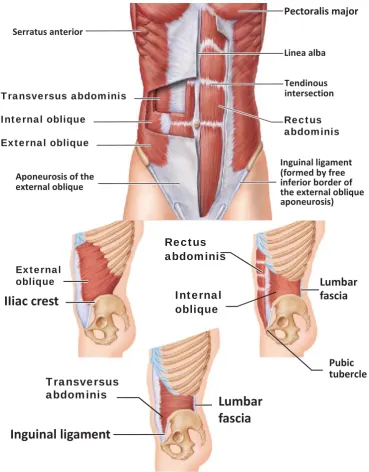
Rectus Abdominis and the Obliques
Rectus abdominis and the obliques are global muscles. The rectus abdominis and the
lateral fibres of the external oblique are the prime movers of trunk flexion bringing the
ribcage and the pelvis closer (Norris 1995, Norris 1999). The bilateral action of the
external oblique assists in trunk flexion in conjunction with rectus abdominis and the
unilateral action of the external oblique facilitates flexion-rotation of the thoracic cage
(Bergmark 1989). In addition, the internal obliques act as a stabiliser and assist the
Figure 3 The main muscles of the active subsystem (Source: Marieb & Hoehn 2010)
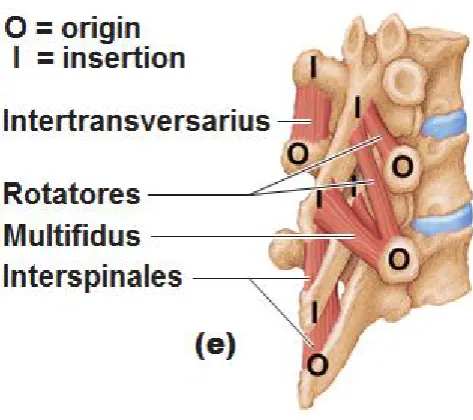
Multifidi and Rotatores Lumborum
The multifidi and the rotatores lumborum provide segmental stability to the spine as
they have direct attachments to the vertebrae (Figures 2 & 4). This allows for specific
vertebral segment motion control when force is exerted on the spine (Bergmark 1989).
Wilke et al. (1996) suggested that the multifidi and the rotatores lumborum act caudally
Transversus abdominis
Inguinal ligament
Lumbar
fascia
Lumbar
fascia
Internal oblique Pubic tubercle Rectus abdominis External obliqueIIiac crest
Transversus abdominis Internal oblique External obliqueto generate intradiscal pressure. The rotatores lumborum cooperates with multifidi,
interspinales and intertransversarii in protecting the articular structures of the vertebrae
from excessive bending and strains (Ebenbichler et al. 2001). Due to the short arm of the
multifidus muscle, it only contributes 20% to the total extensor movement of the lumber
spine (Colston 2012b). Similar to transverse abdominis, lower back pain or injury
changes the activation pattern of the multifidus muscle and reduces its endurance. In
addition to functional changes, morphologic changes such as type II skeletal muscle fibre
atrophy and structural changes in type I skeletal muscle fibres of the multifidi muscles
are observed after lower back injury (Colston 2012b).
Interspinales and Intertransversarii
The interspinales muscles connect to the spinous processes and the intertransversarii
muscles connect to the transverse processes of the vertebrae (Bergmark 1989). These
muscles cooperate to stabilise the spine during movement (Bergmark 1989).
Interspinales in conjunction with the multifidi muscles enable posterior sagittal rotation
and the intertransversarii is associated with proprioception (Norris 1995)
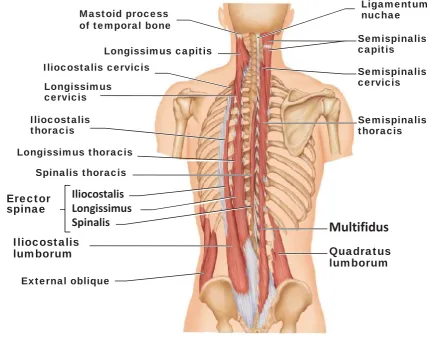
Erector Spinae
There are four muscles in the erector spinae muscle group: longissimus lumborum,
iliocostalis lumborum, longissimus thoracis, and Iliocostalis thoracis. The longissimus
lumborum and iIliocostalis lumborum are part of the local muscles and facilitate and
stabilise the spine during lumbar flexion and assist in posterior sagittal rotation. In
addition, iliocostalis lumborum works together with the multifidi to counteract flexion
caused by abdominal muscles during trunk rotation. The longissimus thoracis and the
Iliocostalis thoracis are part of the global muscles of the core. The longissimus thoracis
functions indirectly maintaining the lumbar lordosis (normal curvature of the lumbar
spine. The Iliocostalis thoracis facilitates the lumbar lordosis and control the extent to
[image:26.595.121.552.128.466.2]which the lumbar spine can be laterally flexed (Norris 1995).
Figure 4 Deep core musculature
Quadratus Lumborum
The quadratus lumborum (Figure 4) is both a global muscle and a local muscle. The
medial fibres of the quadratus lumborum are part of the local muscles of the core and
its lateral fibres are global muscles (Bergmark 1989, Warren et al. 2004). The local
quadratus lumborum facilities lateral bending of the spine and stabilises the spine
laterally and the global part acts as an antagonist to the diaphragm (Bergmark 1989). Mastoid process
of temporal bone
Pelvic girdle, Diaphragm and Hip musculature
Besides the major local and global muscles mentioned above, the diaphragm and the
pelvic floor assist in the generation of intraabdominal pressure, which is vital for
maintaining spinal stability during general movement and lifting activities (Akuthota &
Nadler 2004). Pelvic floor plays a critical role in maintaining correct lumbo-pelvic
stability. This is important when force is being transferred between lower extremity and
the spine. Lumbo-pelvic stability is important in preventing lower back pain and low
extremity imbalances, misalignments, and injuries (Colsten 2012b). O’Sullivan and
Beales (2002) studied the mechanics of the diaphragm and the pelvic floor in people
with sacroiliac joint pain. Using ultrasonography, they measured the diaphragmatic
excursion and pelvic floor descent during active straight leg raise with and without
manual compression through the ilia. They observed decreased diaphragmatic excursion
and increased pelvic floor descent in individuals with sacroiliac joint pain when
performing the active straight leg raise. However, these observations were not present
when the pelvis was stabilised using manual compression through the ilia. They
concluded that imbalance and poor motor control in the pelvic floor musculature causes
pain in the sacroiliac joint which causes non-specific chronic lower back pain (O'Sullivan
& Beales 2002). In addition, they argued that lack of neural control and reduced muscle
capacity are the main factors causing dysfunction in the pelvic floor musculature.
Furthermore, they pointed out that physical training aimed to increase muscle
endurance and neural control has been successful in reducing pain and increasing
sacroiliac joint stability.
Hip flexors, extensors, adductor and abductors are part of the global muscles of the core
as they originate from the lumbar vertebrae and insert in the proximal portion of the
femur, tibia, or fibula (Willardson 2007b). These muscles are important during walking
these muscles are involved in force transmission between the lower extremities, the
pelvis and the spine (Akuthota & Nadler 2004). Hip flexors include rectus femoris,
sartorius, iliacus, and psoas major and minor. Hip extensors are the gluteus maximus,
semimembranosus, semitendinosus, and long head of the biceps femoris. Hip adductors
consist of the adductor magnus, adductor brevis, adductor longus, gracilis, and
pectineus. Hip abductors include tensor fascia latae, gluteus medius, and gluteus
minimus (Willardson 2007a).
Thoracolumbar Fascia
Though, the thoracolumbar fascia is not a muscle, it plays an important role in core
stability and function. The thoracolumbar fascia consists of anterior, medial and
posterior layers with the posterior layer being more involved in spinal stability due to its
large attachments with the transverse abdominis. In addition, it provides feedback to
the neural subsystem during general movement or lifting activities (Akuthota and Nadler
2004). The thoracolumbar fascia is extensively attached to the local and global muscles
of the core so that it can transfer tension between these muscles. It surrounds the
quadratus lumborum and the erector spinae muscle groups; and it is connected to the
latissimus dorsi in the upper extremity of the core and to the gluteus maximus in lower
extremity of the core (Colston 2012a). Therefore, it acts as a natural back belt and
provides support to the lower back and transfers force between the lower and upper
body.
2.2.3 The neural subsystem
Good core muscle function requires an individual to control the activation of voluntary
muscles of the active subsystem, thereby having good sensory-motor control.
Inadequate sensory-motor control introduces neuromuscular imbalances in the core
distribution (Macedo et al. 2009, Warren et al. 2014). This leads to poor stability and
control in spinal segments during movement, which may cause injury and lower back
pain. The CNS controls the core muscles via feedback and feed-forward motor control
mechanisms (Behm et al. 2010). Ligaments, joint capsules, and muscles feedback
sensory information to the CNS. CNS uses this information to adjust core muscle activity
in anticipation of spinal movement or external load stresses in a feed-forward manner to
maintain spinal stability (Behm et al. 2010). The feedback and feed-forward systems
help keep the spinal segments in correct alignment and within physiological limits
known as the neutral zone (Behm et al. 2010). An imbalance in the neural subsystem
translates to poor core muscle function causing lower back pathologies and lower
extremity dysfunction.
2.3 Pathologies
2.3.1 Lower back pain
Lower back pain is one of the chronic diseases affecting many people in Australia. AIHW
(2015) reported that in 2011-12, 14% of Australians reported back problems. In addition,
according to Global Burden of Disease, lower back pain is ranked first in Australasia
(Australia, New Zealand, the island of New Guinea, and neighbouring islands in the
Pacific Ocean) (AIHW 2015). Lower back pain is generally caused by the lack of
neuromuscular response to sudden loading force on the spine. Poor core muscle
endurance and suboptimal neuromuscular coordination are major risk factors of lower
back pain (Colsten 2012a, Warren et al. 2014, Leetun et al. 2004, Wilson et al. 2005,
Ferreira et al. 2007). To prevent pain and injury, core muscle endurance and strength
must be sufficient to overcome external loads placed upon the spine and to maintain
Lack of neuromuscular coordination and poor core muscle function compromises core
stability by introducing incorrect motor patterns and compensatory movements which
can compromise core stability (Colston 2012a). Good neuromuscular control means that
CNS can anticipate and react to external forces which results in good spine stability
reducing the risk of injury and mitigating lower back pain (Leetun et al. 2004, Wilson et
al. 2005, Ferreira et al. 2007, Warren et al. 2014).
Training the neuromuscular recruitment patterns to pre-activate the core muscles to
contract in anticipation to movement is vital for good core muscle function (Ferreira et
al. 2007). This anticipatory mechanism provides a stable foundation prior to movement
and protects the spine from injury (Ferreira et al. 2007). Co-contraction exercises,
balance training, proprioceptive training and skill specific exercises assist in training or
retraining neuromuscular recruitment patterns for better core muscle control and
stability during movement (Caraffa et al. 1996).
2.3.2 Lower extremity injuries
Hip and pelvic muscles are associated with maintaining pelvic-femoral alignment.
Fatigue, imbalances and weakness in hip and pelvic musculature may result in many
lower extremity misalignments such as trunk flexion, anterior pelvic tilt, hip adduction,
hip internal rotation, knee valgus, and foot pronation. Wilson et al. (2006) studied the
association between trunk, hip and knee strength and the orientation of the knee joint.
They determined peak isometric torque for trunk flexion, extension and lateral flexion,
hip abduction and external rotation, and knee flexion and extension. In addition, the
frontal plain projection angle of the knee during a 45-degree single leg squats was
measured. They found that individuals with greater hip external rotation strength resist
hip internal rotation and have a smaller frontal plain projection angle of the knee. This
Poor core muscle function leads to imbalanced loads on the knee joint during movement
as the muscles that act on the knee joint originate at the lower lumbopelvic region
(Willardson 2007a). This may increase the risks of anterior cruciate ligament (ACL)
injuries. Exercises that introduce destabilisation improve muscle readiness and
neuromuscular response to external and internal stimuli, which reduces the risk of lower
extremity injuries such as ACL injury (Willardson 2007a). Preventing these types of
injuries proves important not only to the general public but takes great precedence in
sports.
2.4 Core muscle function in sports
Correct core stability is important in improving sports performance and reducing injury.
From an athletic point of view, it is widely understood that good core muscle function
improves performance as it enhances force transfer efficiency between lower and upper
extremities of the body. Behm et al. (2005) studied the effect of unstable and unilateral
resistance exercises on trunk muscle activation in healthy adults. They observed
electromyographic (EMG) activity of the upper lumbar, lumbosacral erector spinae, and
lower-abdominal muscles. They found that unilateral exercises and exercises performed
in unstable surfaces showed higher core musculature activation. In addition, their
results showed that the side bridge exercise activated core musculature to higher
degree than the front bridge, pelvic tilt, alternate arm and leg extension, parallel hold,
superman, chest press and shoulder press exercises.
Core stability exercises that are used to increase sports performance need to be
designed for the specific sport. Studies have shown that when traditional exercise are
modified such that the core musculature is activated whilst performing the exercise,
core muscle function and sports performance are improved (Frank et al. 2013,
effects of a six-week Swiss ball training on core stability and running economy in 18 male
athletes. The athletes were aged between 15.5 and 17.0 years. The authors found that
core muscle function had been improved after the training intervention. However, due
to the lack of specificity of the training, no improvements were observed in running
economy. They argued that core muscle endurance, and strength training result in
overall improved performance only if the design of the exercises simulates the
movements involved in the sport.
Core musculature work in concert to stabilise the spine and support the body when
external loads are exerted on the body. To improve core muscle function, training
should focus on local, global and other core musculature simultaneously. Using a
biomechanical model, Cholewicki and Van Vliet (2002) compared core muscle
contribution during seated, standing and isometric tasks. They used EMG to measure
muscle activity during these tasks and to estimate stability of the lumbar spine. They
repeatedly ran trials on the model and removed one of the 10 major trunk muscles from
the model at each simulation. It was reported that depending on the direction and
magnitude of the movements, all core musculature were involved in maintaining core
stability with erector spinae muscle group being the major contributor in maintaining
stability.
In a comparative study of core musculature, Arokoski et al. (2001) observed similar
activity pattern and simultaneous activation and function in the multifidus and
longissimus thoracis muscles. This is interesting because the multifidus is a local muscle
and the longissimus thoracis is a global muscle. This study shows that all core muscles
are needed to function optimally to maintain stability and prevent lower back and lower
limb injuries. Core muscle response to movement is relative to type and phase of the
of each core muscle changes, meaning that at different stages of movement, different
core muscles are activated to varied intensity.
All sports involve a destabilising component, therefore training program needs to
include exercises with an instability component in order to improve core muscle
function (Behm et al. 2002, Andersen and Behm 2004). When traditional resistance
exercises such as squats or a chest press are performed on an unstable surface, maximal
force output is considerably reduced due to the unstable nature of the exercise but core
muscle activity is increased (Behm et al. 2002, Andersen and Behm 2004). To improve
core muscle function, increasing core muscle endurance is more important than
strength and power (Arokoski et al. 2001, McGill 2001). Therefore, core exercises would
be better if performed on an unstable surface and incorporate light loads and long
tension times to increase core muscle endurance (McGill 2001).
2.5 Training and rehabilitation programs
Any training or rehabilitation program designed to improve core muscle function should
consider the complexity of the structure and function of the core. Akuthota & Nadler
(2004) suggested that prior to attempting core muscle exercises in functional positions,
training to develop motor pattern awareness is necessary. Once this has been achieved,
core stability exercises in functional positions need to be performed. This reduces the
risk of further injury and eases individuals into core muscle training and strengthening.
The authors further pointed out that exercises that cause full spine flexion and torsion
such as sit ups and roman chair exercises are deemed unsafe for individuals with lower
back pain or spinal injury.
McGill (2010) advocated three rehabilitative exercises that encourage motor pattern
side-bridge exercises (Figures 5, 6, 8). These exercises are beginner level activities that
train motor pattern awareness and muscle recruitment. However, to increase core
muscle endurance and strength, more complex exercises are required that are goal or
[image:34.595.135.544.229.405.2]skill specific.
Figure 5 The Bird Dog
[image:34.595.135.544.478.735.2]Suitable exercises are to be designed such that the whole core is engaged to avoid
introducing imbalances in the core structure and function as injury risks
characteristically arise from such imbalances. Hibbs et al. (2008) pointed out that for a
training program to be effective, it must include exercise that engage the core at a low
and high level of muscle activation and be goal specific. Good core stability program
needs to include low-load motor control training as this type of training enhances CNS
ability to control muscle coordination (Hibbs et al. 2008).
Exercises such as bird dog (Figure 5), curl ups (Figure 6), front bridge (Figure 7), and side
bridge (Figure 8) are low load exercises that are used for motor control training (McGill
2010, Akuthota & Nadler 2004). High load exercises incorporate external loads such as
weights to increase the magnitude of stimulus (Hibbs et al. 2008). Hibbs et al. (2008)
suggested that programs that include low and high-load exercise result in elimination of
imbalance in the core musculature which reduces the risk of injury. Further, using
low-load and high-low-load training in a training method improves core muscle function and
performance in sports.
2.6 Future directions
Current literature discussed in this review mainly studied the effect of training on core
muscle function. It has been found that core muscles work in concert to provide core
stability and protect the spine from damage by keeping the spinal movement within
physiological limits. The literature review revealed that poor core muscle function is
mainly due to poor neural control of core musculature which leads to an array of lower
back and lower extremity pathologies.
There are many studies on the effects of different exercises on core muscle function.
However, fewer studies have been done to understand the nature of core muscle
composition. There is a lack of knowledge in the changes that occur in core muscle
function between the ages of 18 to 30 years. Further to this, it is important to
understand if exercise improves core muscle function in young healthy people.
Investigating these variables can help in predicting how core muscle function changes
over time in individuals whether they are active, sedentary or sports oriented. By
understanding how core muscle function changes throughout these years, better
rehabilitation and training programs can be devised to assist individuals in improving
their core muscle function. This can assist in reducing spinal, lower back and lower
extremity injuries, which can improve individuals’ quality of life. In addition, better core
muscle function improves sport performance and assist in maintaining good
occupational health.
2.7 Conclusion
The core is a complex structure comprising of passive, active and neural subsystem that
work together to provide spinal control, stiffness and stability. The neuromuscular
control of the core musculature is the main reason for core dysfunction as it introduces
musculature imbalances that fail protect the spine and maintain its movement within
physiological limits. Core muscle endurance is another contributor that plays a vital role
in core stability during different bodily movements because fatigued core muscles are
not able to counteract external loading on the spine. Understanding core muscle
function and how it changes within certain age groups makes it possible to design
protective intervention that may improve core muscle function. Understanding how
core muscle function is affected by body composition and training state is an important
factor that can mean the difference between an effective and poor core muscle
Chapter Three: Methodology
This section will explain in details participants’ information, research design,
measurements, equipment, and data analyses.
3.1 Ethics approval
This project was approved by the USQ ethics committee on the 30thApril 2015. The
approval number for the project is H15REA102. Additionally, the Dean of Faculty of
Health, Engineering and Sciences has approved the recruitment of USQ students for this
project.
3.2 Study design
This was a cross-sectional study. Healthy young men and women aged 18 to 30 years old
were recruited. All participants were given a questionnaire to collect information about
lifestyle, physical activities, and medical history. Body composition was measured by
BMI, sum of skinfolds, and waist circumference. Core muscle function was assessed
using length of time front bridge and side-bridge positions were help. Lower limb muscle
function was measured using long jump distance. Data analyses were run to evaluate
the effects of age, gender, physical activity and body composition variables on core
muscle function. In addition, relationship between core muscle function and lower limb
muscle function in young adults was investigated.
3.3 Participants
Young male and female individuals were recruited from USQ and the wider Toowoomba
population. Potential participants were given information sheets and consent forms
pertaining to the project. Participants were divided into four age groups; 18-20, 21-23,
3.3.1 Inclusion and exclusion criteria
Participants were required to be between the age of 18 and 30 years. Individuals who
had medical conditions that inhibited them from performing the exercises were
excluded from the study. Individuals with conditions such as recent lower back, spinal,
abdominal and lower extremity injury were excluded from the study. In addition,
individuals who had undergone recent surgical intervention were not included in the
study due to safety concerns. Individuals who were advised by their general practitioner
to avoid exercising were also excluded from participating in the study.
3.3.2 Participant recruitment methods
Various methods were used to recruit participants for this study. Cold canvasing was the
main method to recruit participants. Researcher approached individuals during common
hours at USQ social gathering areas and the project was explained and individuals were
asked if they wanted to participate. Researcher approached other establishments such
as soccer clubs, gyms, workplaces and general public gathering areas to recruit
participants. In addition to this, noticeboards at various USQ sites were used to
promote the project. Finally, social media such as Facebook was another modality that
was used to successfully recruit participants for the study.
3.3.3 Information sheet
Potential participants were provided with an information sheet (Appendix 1) that had
detailed overview of the project so that individuals can make a well informed decision
on whether they want to take part in the project. Project description, risks involved,
privacy and confidentiality, expected benefits and researcher contact details were the
main points presented in the information sheet. Upon providing the information sheet,
questions that were asked by the potential participants. This helped individuals
understanding the project and what would be required from them if they chose to
participate.
3.3.4 Consent form
All individuals who decided to take part in the study were given a consent form
(Appendix 2) to sign and return. By signing the consent form, participants acknowledged
that they understood the purpose of the research project and were well informed about
what was required from them. Additionally, the participants were required to
acknowledge that they understand that their participation was voluntary and agree to
participate in the study.
3.4 Measurements
3.4.1 Body composition
Body composition measurements included height, weight, BMI, sum of skinfolds and
waist circumference. Height was measured using a STANLEY millimetre scaled tape
measure. The measurement was done in centimetres (cm) then converted to metres in
order to calculate BMI. A digital scale accurate to two decimal places was used to
measure weight in kilograms (kg). Sum of skinfolds in millimetres (mm) from four sites
was used to represent body far mass. SLIM GUIDE skinfold callipers were used to
measure skinfold thickness in millimetres. Four regions of the body were used for the
sum of skinfolds which included the triceps brachia, subscapular, abdomen and thigh.
Waist circumference at the navel level was measured in centimetres using a tailor’s tape
3.4.2 Physical activity
All participants had to give specific details regarding their physical activity levels in the
questionnaire (Appendix 3). Participants were required to report the type of activity and
its duration. The time spent in hours per week was used to determine physical activity
level.
3.4.3 Core muscle function
Two exercises (Figures 7 & 8) were used to determine the quality of core muscle
function. The exercises included the front bridge and the side bridge. Participants were
timed whilst holding a front bridge and a side bridge and these times were used as an
indicator of poor or good core muscle function.
The front bridge
The front bridge is performed with the front of the body facing the ground and the body
is held up by having elbows and forearm on the ground and legs supporting with balls of
the feet on the ground in a plank position (Figure 7). This exercise activates the core
musculature simultaneously and can be used as a good indicator of core muscle function
(Tan et al. 2013). The participants were shown to correctly perform this exercise and
were asked to hold the exercise for as long as they can. The length of time holding the
[image:40.595.134.542.615.731.2]front bridge was used as one of the indicators for core muscle function.
The side bridge
The side bridge has been proven to be an excellent exercise as this exercise activates
core musculature to higher degree and can be used as an indicator of the functional
capacity of core musculature. Tan et al. (2013) measured EMG signals of the different
core muscles on healthy men and found that this simple exercise activates all the major
core muscles and a at a higher degree than the front bridge. This exercise is performed
[image:41.595.134.541.360.517.2]by laying on the side and supporting the body using the elbow, the forearm and feet
(Figure 8). The participants were shown how to correctly and safely perform this
exercise and the length of time this position was held was used as an indicator of core
muscle function.
Figure 8 The side bridge exercise
3.4.4 Lower limb muscle function
Standing long jump (Figure 9) was used to determine quality of lower limb muscle
function. The length of the standing long jump in centimetres (cm) was used to
Figure 9 The Standing Long Jump Exercise
3.5 Data analyses
IBM SPSS statistics software version 19 and Microsoft Excel 2013 was used to collate and
analyse the data. All variables were presented as Mean ± SD. One-way ANOVA and
Pearson’s correlation analyses were used to investigate the relationship among the
variables.
3.5.1 One-way ANOVA
One-way ANOVA was used to analyse any significant differences in the variables
between different age groups and gender related differences in core muscle function of
young men and women. Mean front bridge, side bridge times and long jump distance
were analysed to see if there any variation in different age groups. In addition, the
analysis would suggest whether gender related differences exist in core muscle function
of young adults.
3.5.2 Pearson’s Correlation test
Pearson’s correlation analysis was done to investigate the relation between core muscle
Chapter Four: Results
4.1 Descriptive statistics & gender related differences
One-way ANOVA was conducted to explore gender related difference in core and lower
limb muscle function. Participants were divided into two groups according to their
[image:43.595.128.525.278.572.2]gender.
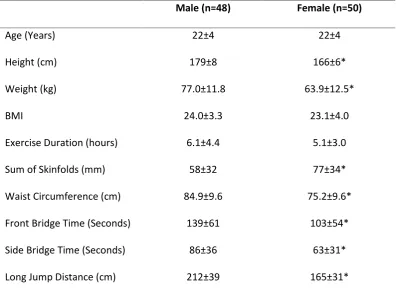
Table 1 Descriptive statistics of body composition, exercise duration, and core muscle and lower limb muscle function in men and women
Male (n=48) Female (n=50)
Age (Years) 22±4 22±4
Height (cm) 179±8 166±6*
Weight (kg) 77.0±11.8 63.9±12.5*
BMI 24.0±3.3 23.1±4.0
Exercise Duration (hours) 6.1±4.4 5.1±3.0
Sum of Skinfolds (mm) 58±32 77±34*
Waist Circumference (cm) 84.9±9.6 75.2±9.6*
Front Bridge Time (Seconds) 139±61 103±54*
Side Bridge Time (Seconds) 86±36 63±31*
Long Jump Distance (cm) 212±39 165±31*
Note: All data are presented as mean ± SD. *p < 0.05 between male and female
48 young men and 50 young women, with mean age of approximately 22 years took part
in the study. All variables except age, BMI, and exercise duration are significantly
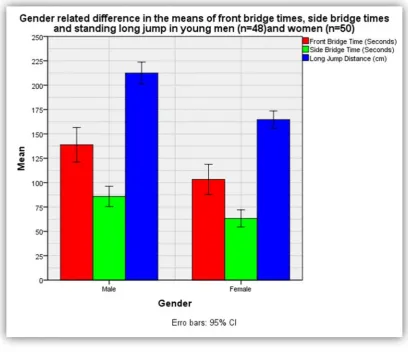
Figure 10 shows the difference in the means front bridge times (red), side bridge times
(green) and standing long jump (blue) for young men and women. Overall, men
[image:44.595.136.545.160.512.2]performed better than women in the three exercises (p < 0.05).
4.3 Body Composition and Core muscle function Correlation
Pearson correlation analyses were used to investigate the relationship of core muscle
function with body composition, and exercise duration. In addition, relationship
between core muscle function and lower limb function was explored.
4.3.1 Results for men
Table 2 shows results from Pearson correlation analyses of weight, BMI, exercise
duration, sum of skinfolds, and waist circumference with front bridge times, side bridge
[image:45.595.130.534.370.487.2]times and long jump distance for young men.
Table 2 Correlation analysis of body composition and exercise duration with core and lower limb muscle function in young men (n = 48). * Correlation is significant at the 0.05 level (1-tailed). ** Correlation is significant at the 0.01 level (1-tailed).
Front Bridge Time Side Bridge Time Long Jump Distance
Weight -.337** -.323* -.078
BMI -.328* -.396** -.192
Sum of Skinfolds -.568** -.525** -.400**
Waist Circumference -.418** -.443** -.339**
Sum of skinfolds, bridge times and long jump distance
Sum of skinfolds had significantly strong negative correlation with front bridge times (r =
-0.568, p < 0.001) and side bridge times (r = -0.525, p < 0.001), and a moderate negative
correlation with long jump distance (r = -0.4, p = 0.002) (Table 2). Figure 11 shows the
relationship of sum of skinfolds with bridge times and long jump distance in young men.
Larger sum of skinfolds measurement adversely affected bridge times and long jump
distance. Note that figure 12 to 22 do not have y axes labels as variables shown in the
figures have different units. The legend on the right if the figures provides the
[image:46.595.136.543.328.685.2]referencer required.
Waist circumference, bridge times and long jump distance
There was a statistically significant moderate negative correlation between waist
circumference and front bridge times (r = 0.418, p = 0.002), side bridge times (r =
-0.443, p = 0.001) and long jump distance (r = -0.339, p = 0.009) (Table 2). Figure 12
shows the relationship of waist circumference with bridge times and long jump distance
in young men. Larger waist circumference adversely affected bridge times and long jump
[image:47.595.138.542.283.611.2]distance.
Weight, bridge times and long jump distance
There was a moderate but statistically significant negative correlation between weight
and front bridge times (r = 0.337, p = 0.01), and weight and side bridge times (r =
-0.323, p = 0.013). There was no significant correlation between weight and long jump
distance (r = -0.078, p = 0.3) (Table 2). Figure 13 shows the relationship of weight with
bridge times and long jump distance in young men. Increased weight reduced bridge
[image:48.595.138.541.283.613.2]time but had an insignificant impact on long jump distance.
BMI, bridge times and long jump distance
There was a statistically significant moderate negative correlation between BMI and
front bridge times (r = 0.328, p = 0.011) and between BMI and side bridge times (r =
-0.396, p = 0.03). BMI had a small non-significant negative correlation with long jump
distance (r = -0.095, p = 0.054) (Table 2). Figure 14 shows the relationship of BMI with
bridge times and long jump distance in young men. Increased BMI reduced bridge times
[image:49.595.137.542.282.615.2]but had an insignificant impact on long jump distance.
4.3.2 Results for women
Table 3 shows Pearson correlation analyses of weight, BMI, exercise duration, sum of
skinfolds, and waist circumference with front bridge times, side bridge times and long
[image:50.595.130.535.239.354.2]jump distance for young women.
Table 3 Correlation analysis of body composition and exercise duration with core and lower limb muscle function in young women (n = 50). * Correlation is significant at the 0.05 level (1-tailed). ** Correlation is significant at the 0.01 level (1-tailed).
Front Bridge Time Side Bridge Time Long Jump Distance
Weight -.298* -.076 -.070
BMI -.170 -.063 -.167
Sum of Skinfolds -.363** -.170 -.288*
Waist Circumference -.328** -.119 -.189
Sum of Skinfolds, bridge times and long jump distance
Sum of skinfolds had a statistically significant moderate negative correlation with front
bridge times (r = -0.363, p = 0.005) but had weak negative correlation with side bridge
times which was not statistically significant (r = -0.170, p = 0.119). Sum of skinfolds had a
small but significant negative correlation with long jump distance (r = -0.288, p = 0.021)
(Table 3). Figure 15 shows the relationship of sum of skinfolds with bridge times and
long jump distance in young women. Larger sum of skinfolds measurement adversely
affected front bridge times and long jump distance but its effect on side bridge times
[image:51.595.134.543.333.658.2]was not significant.
Waist circumference, bridge times and long jump distance
Waist circumference had a statistically significant moderate negative correlation with
front bridge times (r = -0.328, p = 0.01). However, it had small non-significant negative
correlation with side bridge times (r = 0.119, p = 0.205), and long jump distance (r =
-0.189, p = 0.095) (Table 3). Figure 16 shows the relationship of waist circumference with
bridge times and long jump distance in young women. Larger waist circumference
adversely affected front bridge times but its effects on side bridge times and long jump
[image:52.595.137.541.305.634.2]distance is not statistically non-significant.
Weight, bridge times and long jump distance
Weight had a moderate but statistically significant negative correlation with front bridge
times (r = -0.298, p = 0.018). There was a very weak non-significant correlation between
weight and side bridge times (r = -0.076, p = 0.3) and long jump distance (r = -0.07, p =
0.314) (Table 3). Figure 17 shows the relationship of weight with bridge times and long
jump distance in young women. Increased weight reduced front bridge times but had an
[image:53.595.136.541.281.605.2]insignificant impact on side bridge times and long jump distance.
BMI, bridge times and long jump distance
There was a weak negative correlation between BMI and front bridge times (r = -0.170,
p = 0.119), side bridge times (r = -0.063, p = 0.333) and long jump distance (r = -0.167, p
= 0.123) (Table 3), these relationships did not reach statistical significance. Figure 18
shows the relationship of BMI with bridge times and long jump distance in young
women. Increased BMI had no significant impact on bridge times and long jump
[image:54.595.135.543.282.614.2]distance.
4.4 Exercise duration, bridge times and long jump distance
4.4.1 Results for men
Exercise duration had a weak but statistically significant positive correlation with front
bridge times (r = 0.274, p = 0.03) (Table 2) and a moderate positive correlation with side
bridge times (r = 0.307, p = 0.017) (Table 2). However, long jump distance was not
affected by exercise duration (r = 0.054, p = 0.358) (Table 2). Figure 19 shows the
relationship of exercise duration with bridge times and long jump distance in young
men. Longer exercise duration was associated with an improvement bridge times but
[image:55.595.136.542.365.698.2]had an insignificant impact on long jump distance.
4.4.2 Results for women
Exercise duration had a weak positive correlation with front bridge times (r = 0.212, p =
0.07), side bridge times (r = 0.194, p = 0.088) and long jump distance (r = 0.219, p =
0.063) (Table 3). These correlations were not statistically significant. Figure 20 shows the
relationship of exercise duration with bridge times and long jump distance in young
women. The improvement observed in bridge times and long jump distance was not
[image:56.595.136.541.307.636.2]statistically significant.
4.5 Bridge times and long jump distance
4.5.1 Results for men
Standing long jump had moderate positive correlation with front bridge times (r = 0.315,
p = 0.015) and side bridge times (r = 0.342, p = 0.009) (Table 2). Figure 21 illustrates
these relationships. A high front bridge time was accompanied with a high side bridge
[image:57.595.137.542.281.631.2]time and greater long jump distance.
4.5.3 Results for women
Standing long jump had a small non-significant positive correlation with front bridge
times (r = 0.155, p = 0.141) and very weak positive correlation with side bridge times (r =
0.058, p = 0.345) which was not statistically significant (Table 3). Figure 22 illustrates
these relationships. A high front bridge time was accompanied with a high side bridge
time but there was no relationship present between bridge times and standing long
[image:58.595.137.544.287.611.2]jump.
4.6 Age related difference in core muscle function
One-way ANOVA analysis was performed to investigate age related differences in core
and lower limb muscle function in young men and women. Each gender group was then
subdivided into four age groups; 18 to 20, 21 to 23, 24 to 26 and 27 to 30 years.
4.6.1 Results for men
Table 4 shows mean and standard deviation of men’s front bridge, side bridge times and
[image:59.595.128.526.315.440.2]long jump distance for the four age groups.
Table 4 Age related descriptive analysis of core and lower limb muscle function in young men (n = 48).
18-20 group (n=20) 21-23 group (n=11) 24-26 group (n=7) 27-30 group (n=10) Total (n=48)
Front Bridge Time (Seconds)
145±62 150±69 129±51 120±60 139±61
Side Bridge Time (Seconds)
94±36 93±46 71±31 71±21 86±36
Long Jump Distance (cm)
216±24 216±37 224±65 195±42 212±39
Note: All data are shown as mean ± SD. No significant difference between age groups
Mean front bridge and side bridge times in men plateaued at the 21 to 23 age group and
gradually reduced as age progressed. Reduction was observed in side bridge times.
However, these trends did not achieve statistical significance. No significant differences
Figure 23 shows age related difference in the means for front bridge times, side bridge
times and standing long jump distance in young men. Front and side bridge plateaued in
the 21 to 23 age group then decreases as age increases. However, this trend was not
significant (p > 0.05). There were no observable differences in the standing long jump
[image:60.595.136.543.217.556.2]distances.
4.6.3 Results for women
Table 5 shows mean and standard deviation of women’s front bridge, side bridge and
[image:61.595.129.526.182.311.2]long jump distance for the four age groups.
Table 5 Age related descriptive analysis of core and lower limb muscle function in young women (n =50)
18-20 group (n=21)
21-23 group (n=12)
24-26 group (n=10)
27-30 group (n=7)
Total (n=50)
Front Bridge Time (Seconds)
99±66 103±55 97±25 124±51 103±54
Side Bridge Time (Seconds)
66±35 57±26 63±34 65±25 63±31
Long Jump Distance (cm)
168±31 175±37 153±30 156±20 165±31
Note: All data are shown as mean ±