Int. J. Electrochem. Sci., 13 (2018) 5762 – 5774, doi: 10.20964/2018.06.41
International Journal of
ELECTROCHEMICAL
SCIENCE
www.electrochemsci.orgSynchronous Sensing Analysis Based on Nonmodified
Multi-Metal Sensor for Five Tastes
Lin Lu*, Xianqiao Hu, Zhiwei Zhu*
Rice Product Quality Supervision and Inspection Center, Ministry of Agriculture, China National Rice Research Institute, Hangzhou 310006, China
*
E-mail: [email protected]
Received: 27 January 2018 / Accepted: 23 March 2018 / Published: 10 May 2018
This paper deals with a synchronous sensing analysis for five tastes namely sweetness, bitterness, sourness, saltiness, astringency by qualitatively and quantitatively analyzing taste stimuli with nonmodified multi-metal sensor, which has the advantage of being rapid, easy and simultaneous. Eight metal electrodes that were easily available constituted the electrode array. Cyclic voltammetry (CV) and differential pulse voltammetry (DPV) were employed. The original voltammetric signals were transformed by Continuous Wavelet Transform (CWT) in order to reveal more feature information for sensing taste stimuli. The data of feature points from the transformed signal as the input were used for neural network model. Polar Phasor Approach was used to classify and locate single taste. It was resulted that Layer-Recurrent neural network could effectively identify the types of mixed tastes. The response areas of eight electrodes for five tastes in oxidation part and reduction part of CV and DPV were visually characterized. Combining CV with DPV, the accuracies of the training set and test set were both more than that of single voltammetry, confirming that Back Propagation neural network could quantitatively analyze each taste of the mixture. Moreover, the advantages of nonmodified sensor compared with modified sensor were discussed. It was concluded that synchronous sensing analysis has strong ability to sensing the five tastes accurately and simultaneously as human gustation.
Keywords: Taste stimulus; Synchronous sensing; Voltammetry; Nonmodified sensor
1. INTRODUCTION
important role in guiding, and the sensitivity of human sensory organs is susceptible to physical condition, mental status, regional difference, gender difference and so on. In addition, sensory evaluation has the disadvantages of complicated operation, time consuming and high cost. In order to the replacement of artificial sensory evaluation, bionic electrochemical technology has been developed for imitating human sensory organs.
Biomimetic sensors and biosensors [2], as the main parts of bionic electrochemical technology, have been developed for several years. Sensors based on potentiometry [3,4], voltammetry [5-7], impedance spectroscopy [8,9] have been primarily used to determine taste-causing components in food and pharmaceutical such as wine [10-12], tea [13,14], fruit [15,16], dairy [17], fish [18], meat [19] and topiramate [20]. However, these sensors which were high-cost, hard-to-operate and time-consuming only analyzed one or two tastes rather than five tastes. Biomimetic sensors cannot determine directly and precisely with respect to a single component in the solution like chemical instruments such as gas chromatography, liquid chromatography and gas chromatography mass spectrometry. It increases the overall variance of the solution by increasing the variance of the different electrodes via data processing, to evaluate the overall quality difference of solutions rather than a single component. So most sensors cannot really mimic the tongue for simultaneous perception of several tastes.
The selection of the array of sensors is limited but needs much deliberation, collinearity and interference between different electrodes must be considered carefully. In general, metal electrode usually provides a drifting signal which is falsely proportional to a set of substances in the solution. An appropriate voltammetric measurement and signal transforming can control or eliminate the drift, and manifest the feature of signal. It has been reported that Artificial Neural Network (ANN) is one of common tools for discrimination and quantification of samples [21], however, it cannot be used to analyze single component in the mixture due to the improper input. Representing the cross-specificity of the array of electrodes is in need of adopting the proper input data and data processing tool. Consequently, it is possible that the technology based on multi-metal sensor using voltammetry is achieved to successfully mimic human gustation.
In this study, a synchronous sensing analysis for five tastes namely sweetness, bitterness, sourness, saltiness, astringency was developed by qualitatively and quantitatively analyzing taste stimuli via voltammetry with multi-electrode array using the methods of signal transforming and data processing.
2. MATERIALS AND METHODS
2.1. Taste stimuli
Sucrose— 6mM, 13mM, 22mM, 36mM, 50mM, 70mM, 100mM Sodium chloride— 2mM, 4mM, 10mM, 20mM, 30mM, 40mM, 50mM Citric acid— 0.1mM, 0.25mM, 0.5mM, 0.8mM, 1.5mM, 3mM, 5mM
Quinine— 0.01mM, 0.015mM, 0.02mM, 0.03mM, 0.05mM, 0.1mM, 0.2mM Tannic acid— 0.01mM, 0.02mM, 0.03mM, 0.05mM, 0.08mM, 0.15mM, 0.25mM
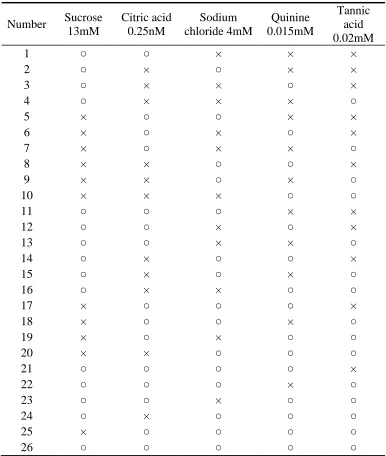
[image:3.596.105.491.277.733.2]The mixture was composed of different types of taste stimulus at the stationary concentration. In this study, there were 26 mixtures of taste stimuli including 10 mixtures with two types, 10 mixtures with three types, 5 mixtures with four types and 1 mixture with all types (Table 1). The blank sample is deionized water for single taste stimulus and the mixture.
Table 1. All mixtures of taste stimuli (○- included, ×- not included).
Number Sucrose 13mM
Citric acid 0.25nM
Sodium chloride 4mM
Quinine 0.015mM
Tannic acid 0.02mM
1 ○ ○ × × ×
2 ○ × ○ × ×
3 ○ × × ○ ×
4 ○ × × × ○
5 × ○ ○ × ×
6 × ○ × ○ ×
7 × ○ × × ○
8 × × ○ ○ ×
9 × × ○ × ○
10 × × × ○ ○
11 ○ ○ ○ × ×
12 ○ ○ × ○ ×
13 ○ ○ × × ○
14 ○ × ○ ○ ×
15 ○ × ○ × ○
16 ○ × × ○ ○
17 × ○ ○ ○ ×
18 × ○ ○ × ○
19 × ○ × ○ ○
20 × × ○ ○ ○
21 ○ ○ ○ ○ ×
22 ○ ○ ○ × ○
23 ○ ○ × ○ ○
24 ○ × ○ ○ ○
25 × ○ ○ ○ ○
2.2. Multi-metal sensor
A standard three-electrode system including working electrode, reference electrode and auxiliary electrode was used in this study. An Ag/AgCl electrode as the reference electrode and a platinum electrode as the auxiliary electrode were employed. Eight metal electrodes of silver (Ag), gold (Au), copper (Cu), nickel (Ni), palladium (Pd), platinum (Pt), titanium (Ti), wolfram (W) were obtained as working electrodes, which were embedded in plastic bodies and exposed metal disks of 2mm diameter. Before the measurement, the electrodes were polished with alumina powder on a soft pad.
2.3. Voltammetric measurements
Voltammetric measurements were carried out in multichannel potentiostat (CHI1040C, CH Instruments Inc., USA) at room temperature (25℃). Cyclic voltammetry (CV) and differential pulse voltammetry (DPV) were used for all samples including single taste stimulus and the mixture. Cyclic voltammetry measurement was performed in the potential range of -1V to 1V with a potential interval of 0.005 V and scan rate of 0.05 V·s-1. Differential pulse voltammetry measurement was scanned from -1V to 1V, pulse amplitude of 0.05V and scan rate of 0.05 V·s-1. All samples were measured randomly to minimize systematic errors. Each sample was measured three times respectively by CV and DPV. Voltammetric signal of each sample ultimately subtracted that of the blank.
2.4. Data processing and algorithms 2.4.1. Continuous Wavelet Transform
Continuous wavelet transform (CWT) is proposed to eliminate the noise of wave signals, which can provide a clear representation of a signal in the time and frequency domains. The wavelet function used in this study is expressed as followed:
2 2
( ) (1 ) exp( ) 2
t
t t
It is assumed that f (t) is a one-dimensional discrete signal consisting of 1 to n data. According to the definition, the CWT of F (T) is its projection on wavelet, which is given as followed:
1
( , ) ( ) ( )
f
t q
W p q f t dt
p
p
relationship with the original signal data, and the relative positions of the transformed peaks remain unchanged, which is the essence of CWT for the identification of the peak position.
2.4.2. Polar Phasor Approach
Polar Phasor Approach can be characterized the differences of samples by drawing with the polar radius and the radian of phase angle. The input data is preprocessed using Fourier Transform. It can be simplified as followed:
( )
(0) f m f
f N
( ) arctan
( )
I f R f
2 2( ) cos 0.5 [ ( ) sin ]
m f m f
( ) sin arctan
( ) cos 0.5
m f m f
Where ρ is the polar radius; θ is the radian of phase angle; f , R, I, f(0) is the amplitude, real part, imaginary part and the first data of the data preprocessed by Fourier Transform; N is the total number of the input data.
2.4.3. Artificial neural network
In order to obtain the optimal model, different network architectures of neural network were tested. Input and output layers were established as the number of the input data and the number of analytes to be determined respectively. Different transfer functions as well as different training and learning algorithms were also tested in the hidden and output layer. In this study, Layer-Recurrent neural network (LRNN) and Back Propagation neural network (BPNN) were applied. Trainlm as the training algorithm and Learngdm as the learning algorithm were equally used for two neural networks. The transfer functions of hidden and output layer in LRNN were Logsig and Tansig respectively. In BPNN, the transfer function of hidden layer was Tansig as well as output layer. In this case, the inputs of neural network models were the data of feature points, and the outputs were the types or concentrations of single taste stimulus in the mixture.
2.4.4. Extraction of feature point
2.4.5. Calculation of accuracy for model
The accuracies of the training and test set can be used to evaluate neural network model. For qualitative analysis, the accuracy A1 was obtained with LRNN. For quantitative analysis, the accuracy A2 was obtained with BPNN. In this study, it can be calculated as followed:
1
1 Tr 100%
A m
Re Co Ce 100%
Ce
2
2 Tr 100%
A n
Where m, n is both the total number of mixture of stimuli; Tr1 is the number of mixture in which all single obtained types are exactly the expected types; Re is the relative error of the expected vs. the obtained concentration for single stimulus; Co, Ce is the obtained and expected concentration; Tr2 is the number of mixture in which Re of each single stimulus is below 10%.
2.4.6. Software
Data processing was carried out in Matlab 2011b (MathWorks, Natick, MA).
3. RESULTS AND DISCUSSION
3.1. Transformation of voltammetric response
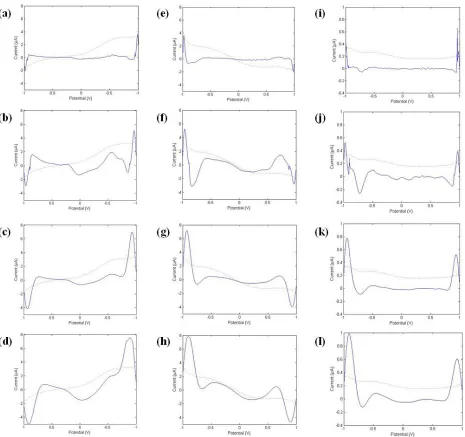
The original voltammetric responses of Pt electrode towards citric acid at 0.1mM were illustrated with dashed curves in Fig.1. Cyclic voltammogram which shows redox processes is divided into two curves from positive potential scan and negative potential scan. As can be observed, there was no obvious peak in oxidation curve and reduction curve of cyclic voltammetry (CV) (Fig.1a and e, dashed curves). In the original response curve of differential pulse voltammetry (DPV) (Fig.1i, dashed curve), the impactful wave couldn’t be found.
The useful data for analysis was unable to be directly obtained from original voltammetric signals below recognition threshold of taste. In order to sense taste stimuli like the tongue, processing the original voltammetric signals with a transform method to acquire characteristic data at recognition threshold or even below was necessary. In this study, Continuous Wavelet Transform (CWT) was proposed for transforming the signals. Wavelet technique which has advantages over traditional transform methods initially decomposes data into different frequency components and then focuses on each component with a resolution matched to its scale [23]. It has been reported that CWT enabled continuous detection of surface signals and instantaneous energy signals [24].
Figure 1. The comparison of original voltammetric signals (dashed curves) from Pt electrode towards citric acid at 0.1mM and corresponding continuous wavelet coefficient curves (solid curves) transformed by CWT in different scales (a, e, i- scale 4; b, f, j- scale 8; c, g, k- scale 16; d, h, l- scale 24) using CV(a~d : the reduction part; e~h: the oxidation part) and DPV( i~l).
[image:7.596.65.530.70.507.2]
24, curve oscillation got worse and covered certain small signal peak. Hence, for Pt electrode, the scale of 8 was the best. Similarly, for the other electrodes, continuous wavelet coefficient curves in different scales were analyzed. For the same original signal, in lower scale, the coefficient curve changed slowly, and more feature information can be extracted for the weak signal peak; conversely, the feature information of the large signal peak can be extracted, but the baseline oscillation is stronger. In this study, the scale of 8 was selected for all electrodes. CWT in the scale of 8 could enhance the sensitivity of weak voltammetric response, and reveal more feature information for sensing taste stimuli.
3.2. Qualitative identification for the tastes
[image:8.596.64.532.332.587.2]The potential data of feature points were used as the input data. For single taste stimulus, Polar Phasor Approach was employed. For the mixture of taste stimuli, Layer-Recurrent neural network (LRNN) was employed, first two measures for all mixtures as the training set and the rest measure as the test set.
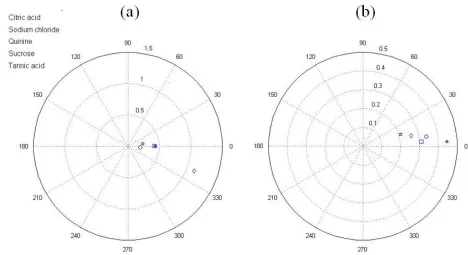
Figure 2. Polar phase diagram for five taste stimuli by CV (a) and DPV (b).
astringency slightly. W electrode had fewer feature points than other electrodes for CV, but for DPV. Different metal towards taste stimuli performed different sensitivity and specificity for qualitative identification.
The potential data of feature points of the same taste stimulus at different concentrations possessed small shift according to the RSD which was in the range of 1.5%~16.5%. So the potential data of feature points could classify and locate these five taste stimuli. As shown in Fig.2, citric acid and sucrose could not be discriminated by CV, however, DPV displayed a clear distinction for all taste stimuli, illustrating that DPV had better discernment to five tastes than CV.
[image:9.596.97.504.419.573.2]Principal component analysis (PCA) generally classifies the samples due to their electrochemical responses [5], and also can figure out the degrees of contribution of the variables which mean electrodes in this case. It maximizes the correlation between the original variables forming a small number of new orthogonal and non-correlated variables called principal components (PC) which seize a majority of the variance in the original ones [26]. The front three PCs explained 94.5% of the variance both in CV and DPV. The principal component coefficients (PCCs), also known as loadings, can be used for the degrees of contribution of electrodes. For CV, high PCCs (>0.7) of PC1, PC2, PC3 occurred in Pd, W, Cu, Pt electrode, and in Ti, Ni for DPV (Table 2), indicating that these electrodes made a large contribution for qualitatively sensing the taste.
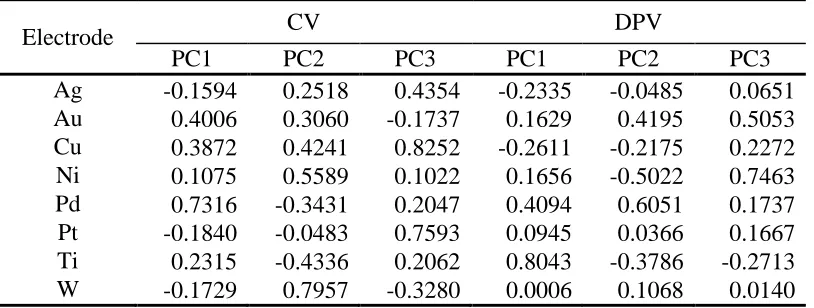
Table 2. The principal component coefficients of front three PCs in different electrodes via CV and DPV.
Electrode CV DPV
PC1 PC2 PC3 PC1 PC2 PC3
Ag -0.1594 0.2518 0.4354 -0.2335 -0.0485 0.0651 Au 0.4006 0.3060 -0.1737 0.1629 0.4195 0.5053 Cu 0.3872 0.4241 0.8252 -0.2611 -0.2175 0.2272 Ni 0.1075 0.5589 0.1022 0.1656 -0.5022 0.7463 Pd 0.7316 -0.3431 0.2047 0.4094 0.6051 0.1737 Pt -0.1840 -0.0483 0.7593 0.0945 0.0366 0.1667 Ti 0.2315 -0.4336 0.2062 0.8043 -0.3786 -0.2713 W -0.1729 0.7957 -0.3280 0.0006 0.1068 0.0140
3.3. Quantitative analysis for the tastes
The current data of feature points were used as the input data. For single taste stimulus, linear regression was utilized. For the mixture of taste stimuli, Back Propagation neural network (BPNN) was utilized, first two measures for all mixtures as the training set and the rest measure as the test set.
Figure 3. Continuous wavelet coefficient curves of citric acid at different concentrations (a- the blank, b- 0.1mM, c- 0.25mM, d- 0.5mM, e- 0.8mM, f- 1.5mM, g- 3mM, h- 5mM) in Ag electrode and good linear regression between the concentrations and current values of the highest peaks.
[image:10.596.126.477.181.372.2] [image:10.596.112.481.472.675.2]
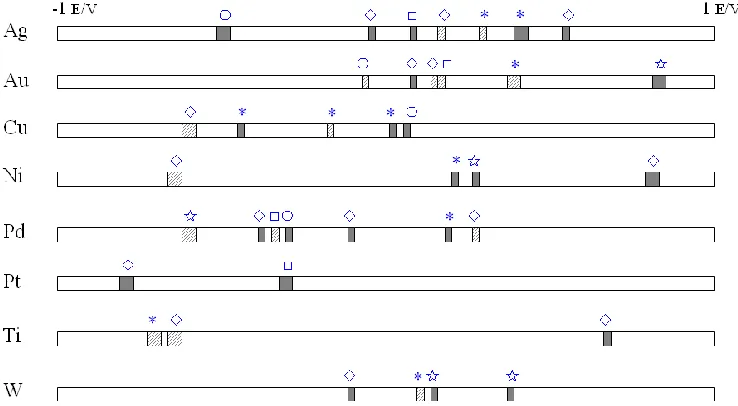
As can be seen in Fig.3, continuous wavelet coefficient curves of citric acid at different concentrations presented a specific trend, in which the highest peak exhibited noticeably. Analogues were found in most electrodes towards the other taste stimuli. Therefore, the highest peak (HP) as a special feature point was extracted for quantitative analysis of single taste stimulus. In terms of each electrode for each stimulus, linear regression between the concentrations and current values of HP was launched. Good correlation coefficients (R> 0.95) showed voltammetric response from corresponding electrode for quantitatively sensing the tastes. Figure 4 visually characterized the response areas which were the locations of HPs (R> 0.95) of eight electrodes for all stimuli in oxidation part and reduction part of CV and DPV. Tannic acid which causes to astringency had its response area for every electrode, most performed via DPV, and overally responded in Ag and Pd electrode which was meant to three response areas via oxidation part and reduction part of CV and DPV. Sourness evoked by citric acid had the response areas except for Pt. Sucrose and sodium chloride that produce sweetness and saltiness both quantitatively responded for four electrodes. Bitterness which is caused by quinine located at 0.845±0.013V in Au, 0.280±0.025V in Ni, 0.170±0.015 V and 0.370±0.023 V in W.
[image:11.596.137.461.539.673.2]Multiple metal electrodes with voltammetry can accurately predict the content of single taste stimulus, more importantly, whether it can predict the contents of all taste stimuli contained in the mixture is a key. In order to obtain the prediction model, different network architectures as well as different functions and algorithms were tested using BPNN. Although the accuracies of the training set by CV and DPV both were 80.8%, the predictive ability to the test set of these two models was poor shown in Table 3. Combining CV with DPV, the accuracies of the training set and test set were on the rise, indicating that the combined voltammetric technique can realize quantitative prediction for taste stimuli contained in the mixture. Owing to the surface solution interaction, the location and intensities of feature points on which the chemical properties of stimuli present in the mixture solution have an important influence differ from one electrode to the other, confirming that the array of electrodes has cross-specificity.
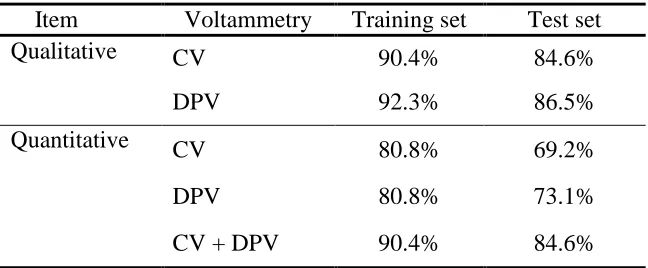
Table 3. The accuracies of the training set and test set in neural network model using CV and DPV.
Item Voltammetry Training set Test set
Qualitative CV 90.4% 84.6%
DPV 92.3% 86.5%
Quantitative CV 80.8% 69.2%
DPV 80.8% 73.1%
CV + DPV 90.4% 84.6%
3.4. Comparison with modified sensor
Modified electrodes and biosensors have been developed to detect taste perception, which many research teams are committed themselves to. The biggest characteristics of modified sensors are specificity and pertinence owing to modified materials, but some nonmodified electrodes possess broad-spectrum, requiring a combination of appropriate signal processing technology, such as increasing the intensity of weak signal, feature extraction, specific ranking method of input data and so on. In this paper, the lowest concentration of five taste stimuli was identified synchronously by the nonmodified multi-metal sensor. And different modified voltammetric sensors for taste stimuli have been reported [5,28-30], most of them could qualitatively distinguish and identify the taste substance, but the quantitative limits of five tastes for synchronous determination were rarely clear. Hence, according to the lowest concentrations of five stimuli, the capacity of the nonmodified sensor used in synchronous sensing analysis was not poorer than the previous modified one.
The nonmodified sensor has other points: Firstly, it is simple, available, easy to operate, and simple to maintain. However, because of the particularity of the modified material, the modified electrode has more stringent conditions for determination or preservation. Secondly, the signals obtained from nonmodified electrodes often need interactive computation to get target data, while the signals in modified electrodes contain little interaction information. Although the research of modified electrodes is very extensive, nonmodified electrode is more useful for practical applications considering its simplicity and universality.
4. CONCLUSION
A synchronous sensing analysis for sweetness, bitterness, sourness, saltiness, astringency was developed by detecting corresponding taste stimuli using cyclic voltammetry and differential pulse voltammetry with nonmodified multi-metal sensor consisting of eight metal electrodes that were easily available. The sensitivity of voltammetric signal was promoted due to the original signal transformed by Continuous Wavelet Transform which could reveal more feature information for sensing taste stimuli. The data of feature points from the transformed signal as the input were used for neural network model to qualitatively identify and quantitatively analyze taste stimuli. Polar Phasor Approach can classify and locate single taste, and Layer-Recurrent neural network could effectively identify the types of mixed tastes. Back Propagation neural network could confirm the concentration of each taste of the mixture. Eight electrodes had their response areas for five tastes in oxidation part and reduction part of CV and DPV. Considering that the minimum concentration of all taste stimuli lower than recognition thresholds, the specificity and sensitivity of synchronous sensing analysis are superior to the tongue. Compared to previous technologies, synchronous sensing analysis has the advantage of analyzing rapidly, easily and simultaneously for five tastes.
ACKNOWLEDGMENTS
References
1. J. Chandrashekar, M.A. Hoon, N.J.P. Ryba, C.S. Zuker, Nature, 444 (2006) 288. 2. L. Lu, X.Q. Hu, Z.W. Zhu, TRAC-Trend Anal. Chem., 87 (2017) 58.
3. K. Toko, D. Hara, Y. Tahara, M. Yasuura, H. Ikezaki, Sensors, 14 (2014) 16274.
4. G. Sharma, S. Kumar, A. Kumar, A. Sharma, R. Kumar, R. Kaur, Procedia Comput. Sci., 70 (2015) 146.
5. J.M. Gutierrez, L. Moreno-Baron, M.I. Pividori, S. Alegret, M. del Valle, Microchim. Acta, 169 (2010) 261.
6. J. Olsson, P. Ivarsson, F. Winquist, Talanta, 76 (2008) 91.
7. S.Y. Tian, S.P. Deng, Z.X. Chen, Sens. Actuators B, 123 (2007) 1049.
8. G. Pioggia, F. Di Francesco, A. Marchetti, M. Ferro, A. Ahluwalia, Biosens. Bioelectron., 22 (2007) 2618.
9. M. Cortina-Puig, X. Munoz-Berbel, M.A. Alonso-Lomillo, F.J. Munoz-Pascual, M. del Valle, Talanta, 72 (2007) 774.
10. A. Legin, A. Rudnitskaya, L. Lvova, Y. Vlasov, C.D. Natale, A. D’Amico, Anal. Chim. Acta, 484 (2003) 33.
11. X. Cetó, F. Céspedes, M. del Valle, Talanta, 99 (2012) 544. 12. X. Cetó, F. Céspedes, M. del Valle, Electroanalysis, 25 (2013) 68.
13. L. Lvova, A. Legin, Y. Vlasov, G.S. Cha, H. Nam, Sens. Actuators B, 95 (2003) 391. 14. N. Hayashi, T. Ujihara, R.G. Chen, K. Irie , H. Ikezaki, Food Res. Int., 53 (2013) 816. 15. C. Medina-Plaza, J.A. de Saja, M. Rodriguez-Mendez, Biosens. Bioelectron., 57 (2014) 276. 16. E.S. Medeiros, R. Gregório, R.A. Martinez, L.H.C. Mattoso, Sensor Lett., 7 (2009) 24.
17. F. Winquist, R. Bjorklund, C. Krantz-Rülcker, I. Lundström, K. Östergren, T. Skoglund, Sens. Actuators B, 111 (2005) 299.
18. L. Gil, J.M. Barat, I. Escriche, E. Garcia-Breijo, R. Martinez-Manez, J. Soto, Microchim. Acta, 163 (2008) 121.
19. L. Gil, J.M. Barat, D. Baigts, R. Martinez-Manez, J. Soto, E. Garcia-Breijo, M.C. Aristoy, F. Toldra, E. Llobet, Food Chem., 126 (2011) 1261.
20. T. Haraguchi, T. Uchida, M. Hazekawa, M. Yoshida, M. Nakashima, H. Sanda, T. Hase, Y. Tomoda, Chem. Pharm. Bull., 64 (2016) 14.
21. A. Gutés, D. Calvo, F. Céspedes, M.D. Valle, Microchim. Acta, 157 (2007) 1. 22. W.B. Zhang, Zhejiang Gongshang University, (2012) Hangzhou, China,. 23. S.M.H. Hosseini, P.R. Baravati, J Electr. Eng. Technol., 10 (2015) 1019. 24. C.P. Uzunoglu, J Electr. Eng. Technol., 11 (2016) 683.
25. Y.Q. Zhang, J.Y. Mo, T.Y. Xie, P.X. Cai, X.Y. Zou, Anal. Chim. Acta, 437 (2001) 151.
26. C.A. Blanco, R.D.L. Fuente, I. Caballero, M.L. Rodríguez-Méndez, J Food Eng., 157 (2015) 57. 27. X. Cetó, F. Céspedes, M. del Valle, Microchim. Acta, 180 (2013) 319.
28. C. Apetrei, M.L. Rodríguez-Mendez, V. Parra, F. Gutierrez, J.A. de Saja, Sens. Actuators B Chem., 103 (2004) 145.
29. V. Martina, K. Ionescu, L. Pigani, F. Terzi, A. Ulrici, C. Zanardi, R. Seeber, Anal. Bioanal. Chem., 387 (2007) 2101.
30. J. Wu, J. Liu, M. Fu, G. Li, Z. Lou, Sensors, 5 (2005) 529.