Vulnerability Report 2018
Overview
1
Contents
Foreword from the Children’s Commissioner, Anne Longfield ... 2
1: Measuring aggregate vulnerability ... 4
2. Combinations of vulnerabilities ... 6
3. Gaps in support to address complex family need ... 10
4. What should be done? ... 11
List of reports summarised in this overview report ... 13
Annex 1 - Summary Table: Vulnerable groups and latest data ... 14
2
Foreword from the Children’s Commissioner, Anne Longfield
Today, I am publishing the second iteration of my annual study of childhood vulnerability in England. Last year’s report was the first nationwide attempt to quantify the level of childhood vulnerability in England. This year’s report tells us more and in more detail about the children who are growing up with risks that could affect their wellbeing and ultimately life chances.
Last year I said the figures we found were shocking.
This year, with greater knowledge and clarity, they are even more so.
I am particularly struck by the finding that there are over 2 million children in England living in families with substantial complex needs, and that of these 1.6 million children have no established, recognised form of additional support.
These figures should trigger not only our concerns and questioning; they must also trigger our action. Of course, the stark statistics explained in this report do not mean that all children with the high level vulnerabilities identified will have poor lives. Growing up is more complicated than that and for a good proportion of these children, the support of families and a good experience in school will be enough to ensure that they have happy and fulfilled childhoods, despite adversity. There will be others not identified in the data who experience harm. In the great snakes and ladders of growing up, families and schools are vital ladders. However, too many vulnerable children do not have these safety nets.
The deep insecurity and unpredictability that is experienced by children whose parents have severe mental health problems, drug or alcohol dependency, or violence in the home strips away the stability, guidance and support children need to thrive. The neglect and chaos that many children become accustomed to as normal undermines every aspect of wellbeing from self-esteem and resilience to physical harm. The pressure felt by the 8-year-old boy who is doing his best to care for his sick mother and keep up with school. The teenager who is struggling to cope since his dad went to prison and is being picked on by bullies and targeted by gangs. These children are all living with risks in their lives that most of us would find overwhelming. The vulnerability framework maps out the scale and nature of these risks for children growing up in England today. I want us to set sights high for all children and make reaching those aspirations for vulnerable children the litmus test of success. To do so we must be both determined and wise.
To begin, we must understand that risks can be reduced and that many of these symptoms are both treatable and preventable. This research gives us some idea of the scale of the challenge we need to address. There are a wide range of types of vulnerability and ways of identifying vulnerable children. Our framework includes groups for which the concern is about the child’s own development, their family circumstances, features of identity or the direct personal experience of harm. Sometimes vulnerability is indicated by receipt of services. The purpose of the framework is to collect all of these types of concern in one place and start to understand the relationships between them.
3
we monitor every part of the process: from the risk factor to the recovery. We understand the causes, and we take steps to address these.
But do we know the same about children who start school unable to speak? Do we know how many children this is? Do we understand how this affects their further progression? Do we realise that an inability to express yourself leads to anger, and difficult behaviour, which is then reflected in rising school exclusions at primary school? Do we know that if this continues to be ignored not only does the child’s education suffer but so does their mental health? Do we know that 60% of children who end up in the youth justice estate have a communication problem, most of which could have been effectively treated? No – we do not know how many children got speech and language therapy last year, or how many were turned down. Do we have a system in place that can identify which children need help and help them? No – and as a result opportunities to help children are missed, and problems escalate.
I remain as ambitious for children as ever, but I am increasingly frustrated by the number of vulnerable children who cannot meet their own ambitions because they are let down by a system that doesn’t recognise or support them; a system that leaves these children, and their families, to fend for themselves, until things have got out of hand and crisis hits.
The point of understanding children’s vulnerability is so we can understand what is needed to help them and give them the best chance in life possible. For some this help may be temporary or take the form of a helping hand, for others it will be specialist support for them and their families that can begin to overcome the challenges and problems that may have been set for a generation – and that may well pass onto the next generation if we don’t step in to help.
This research gives us – in stark detail – the scale of this challenge. It is beholden on all of us to respond. The social, educational and economic costs of failing to help these children are clear. However, beyond all of this is a moral argument about whether we are prepared to deny children who need our support? About whether we want to give all children a fair chance in life, or we are prepared for some to shoulder additional burdens alone. I believe that supporting vulnerable children is the biggest social justice challenge of our time.
I don’t pretend that meeting this challenge will be easy. Or that it can be done for free - it will require additional resources. But more than that, it requires a paradigm shift in our approach to children so that we move from a system which marginalises vulnerable children to one which embraces them. Because in doing this, in expanding the range of support we offer to vulnerable children and their families, we can support many more children in a more efficient and effective way. This is about an approach that works with children and their families, to develop resilience, confidence and independence – rather than presuming vulnerable children lack these characteristics. We get the society we choose. These vulnerable children need us to choose one which commits us to help them succeed.
Anne Longfield OBE
4
1: Measuring aggregate vulnerability
Last year we introduced the framework for measuring aggregate levels of vulnerability in childhood and made an initial estimate of the numbers of children in England under the age of 18 at risk of having different types of vulnerability. These were very cautious estimates with known gaps and uncertainties. This year we have revised and extended the list of groups to be broader and more inclusive and undertaken new, improved analysis of the aggregate numbers.
The aim of the work presented here is to assess overall levels of vulnerability and need, for the strategic purpose of assessing the fit of existing policy and practice to the needs of today’s children and young people. For this reason we do not state what specific action or policy should result for particular children. Although for strategic reasons we focus on needs and vulnerability, for individual children and families there are always important assets and strengths that should be recognised and supported in any policy or practice intervention. However, the concern of this work is for the overall level of need.
We have consulted with children and young people and with a broad range of groups working to support or measure levels of child need, and this has led to an extended framework (see Annex 1) of 37 groups with additional sub-groups. Each group is included because of concerns about risk to the wellbeing and welfare of children in the group. We do not know the specific experience of each child but are concerned by heightened risk that they experience current harm or missed opportunities impacting on their future lives and life chances. We have undertaken analysis of the overlaps between groups, where possible, to enable new assessment of overall levels of vulnerability and of the degree to which multiple vulnerability is recognised and addressed by government and by services for children (or their parents and carers). We have also identified other groups for which we have not yet scoped available data, which we register for now and will add to the framework in due course. It is a living framework and will continue to improve and adapt.
A number of caveats are essential:
The analysis concerns aggregate levels of risk and vulnerability, that is, analysis about large groups of children drawn from what we know from datasets or surveys. It does not enable any assessment of the specific problems faced by specific children and young people in the groups identified. We do not say that each child or young person in each of these groups is vulnerable to immediate harm or would appreciate being described as such. Actual need at the level of the individual child or family will depend on the combination of circumstances they face and the assets and resources available to the child (see Technical Report 3). Our evidence is that young people do not appreciate the language of vulnerability when applied to individuals. However, the young people we have spoken with did express a wish that policymakers and service providers would have a better overview of all the problems they might face, without branding any specific child or family necessarily as ‘a problem.’
There are substantial weaknesses in the data. We have done what we can to draw from all available national statistics and survey data but there are substantial gaps and inconsistencies as explained in the various Technical Reports (see list at end of document). This is a challenge for government in itself, and one of the reasons we undertake this work.
5 and vulnerability. Moreover, children and young people’s lives and circumstances are subject to change, often quite rapid, and the static analysis we have undertaken cannot address this. Nonetheless, this is the first attempt ever to draw all the available data and evidence about childhood vulnerability into one place in this way. Where there are gaps and inadequacies in the data, and hence what we know of children’s lives, this is not the children’s fault – it is for all of us to address, and that rationale lies behind this work and will continue to drive it.
We have done what we can to identify the latest data for all groups in the most consistent way possible, ensuring we clarify ages and areas included. We locked down our data collation for this paper on May 21 2018 and so there may be more recent data for some groups.
Despite these caveats, therefore, we think it is important to have a high level overview of types and levels of childhood vulnerability at national level. We think it is important to have a broad framework that allows for the multiplicity of types of need and vulnerability in order for the country as a whole to have a grip on trends in risk and to ensure that systems are in place to assess and respond to children’s needs. Over time we intend to deepen the analysis further, to use it to frame new data collection and new linking and matching of data to address the gaps in knowledge. We will work with partners to enhance the data and to develop web pages to make the data fully accessible. We have focussed here on quantitative data on overall numbers. Ultimately, we want to use the framework not just to monitor trends but also to ensure the voices of children and young people in each group are heard and that we know the degree to which needs are met.
The latest version of our vulnerability framework identifies 37 types of childhood vulnerability (and 70 subgroups within them), nested within seven broad categories.
Table 1: Categories of vulnerability in the general CCO framework
Categories of vulnerability
Children receiving statutory care or support – including children in care, or in custody and those being supported by children’s services.
Children known to have experienced specific personal harm – including children who have been abused or exploited
Children with a disability, health or developmental difficulties – including mental ill-health and special educational needs.
Children in households or families with characteristics or locations that indicate higher potential likelihood of current and future harm – including poverty and domestic violence Children who are vulnerable or of concern by virtue of their identity or nationality – including LGBTQ+ children and young people and refugees
Children at risk in relation to activity or institutions outside the home – including children involved in gangs or radicalisation
Children caring for others - including children caring for their parents or children who have children themselves
Note: In all groups we have focused on children and young people aged 0-17 years. In many groups there are concerns about transitions beyond 18 into adulthood, including care leavers, disabled children and children in the youth justice system. This is included for some groups and will be addressed more fully in future work
6 data is available by area and over time, and a statement about data quality. The exact year to which the data pertains varies with the availability of data but where possible we present data for 2016/17. Many of these types of vulnerability, risk or harm are relatively common. In a typical classroom of 30 children, for instance:
15 children (52%) report having been bullied at some point
3 children (11%) living with limiting long-term conditions
8 children (25%) have a parent with mental health problems
Bullying is very unpleasant for a child, and particularly when a child also has other forms of vulnerability can have substantial long-term consequences. Fortunately, most children who experience a small number of episodes of bullying will, with the help of family, friends and school, overcome it. Similarly, long-term health conditions include those who develop conditions such as asthma that most children can effectively manage with the help of their family and local GP.
There are other indicators of vulnerability in this framework which are less common, indicate higher prima facie levels of vulnerability and would still be found in the average classroom of 30 children:
1 child (2%) living in a household where both parents have serious mental health problems
3 children (11%) who have relatively serious mental health issues themselves
1 child (2%) caring for their parents or siblings
3 children (10%) with SEN, including 1 child with substantial additional communication needs
2 children (7%) living in homes with domestic violence and abuse
1 child (4%) living in material deprivation and severe low income
Some classrooms may not have any children with these vulnerabilities; other classrooms may have far more. In practice these levels of risk will be clustered by area, and will be higher in areas of greater deprivation.
These are vulnerabilities which will often require support: mental health conditions and communication issues will need support beyond the family, and if this help is not provided, these conditions can escalate and lead to a range of poor outcomes and experiences for the child. Similarly, we know that domestic violence is both extremely distressing for a child to witness, and a key indicator that the child themselves is at risk of experiencing harm and neglect.
2. Combinations of vulnerabilities
In reality, many vulnerabilities are linked, meaning some children have multiple vulnerabilities. For example, children experiencing neglect will be more likely to develop a communication problem, and then both the communication problem and the neglect increase the risk of developing a mental health problem.
7 of which individually meet the high threshold set for a child to receive support. How would a benefits officer assessing the needs of a family know that one child has asthma, another child has low school attendance, their parent has a mental health problem and the eldest child is showing signs of depression and is being bullied at school?
Hence, weaknesses of available data make it difficult to accurately measure the number of children who are vulnerable. Although we are able to measure the scale of most, if not all, individual vulnerable groups, it is much harder to quantify the overlap of these groups to get an accurate reflection of the size of the vulnerable population of children (or families) in England, or to provide clarity on the level of multiple risk. This has been the major challenge for this research.
We have undertaken two analyses of overall levels of vulnerability for this year’s report – see Technical Reports 1 and 2 for more detail. Last year’s reports also provide relevant information about the definition and meaning of vulnerability and about what is known about the outcomes of vulnerable children.
We have undertaken analysis of overall levels of vulnerability for three broad “types” of vulnerable group:
Type I: Children receiving statutory support
Type II: Children with complex family needs
Type III: Children with health-related vulnerabilities
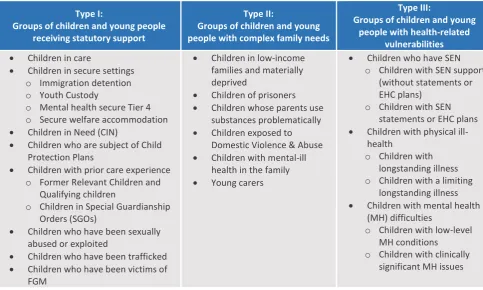
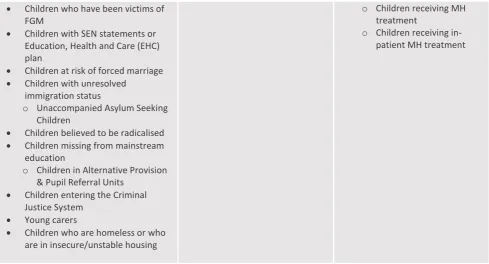
[image:8.595.60.544.484.774.2]For these three sets of vulnerable group we have attempted to take account of multiple vulnerabilities to estimate the overall number of children in the type as a whole. To do this we have to estimate the overlap between the underlying vulnerable groups to know how many children would be double counted if we simply added up all of the numbers. Table 2 sets out the specific vulnerable groups included in each of these general types of group.
Table 2: Vulnerability types and groups of vulnerable children
Type I:
Groups of children and young people receiving statutory support
Type II:
Groups of children and young people with complex family needs
Type III:
Groups of children and young people with health-related
vulnerabilities
Children in care
Children in secure settings
o Immigration detention
o Youth Custody
o Mental health secure Tier 4
o Secure welfare accommodation
Children in Need (CIN)
Children who are subject of Child Protection Plans
Children with prior care experience
o Former Relevant Children and Qualifying children
o Children in Special Guardianship Orders (SGOs)
Children who have been sexually abused or exploited
Children who have been trafficked
Children who have been victims of FGM
Children in low-income families and materially deprived
Children of prisoners
Children whose parents use substances problematically
Children exposed to Domestic Violence & Abuse
Children with mental-ill health in the family
Young carers
Children who have SEN
o Children with SEN support (without statements or EHC plans)
o Children with SEN statements or EHC plans
Children with physical ill-health
o Children with longstanding illness
o Children with a limiting longstanding illness
Children with mental health (MH) difficulties
o Children with low-level MH conditions
8
Children who have been victims of FGM
Children with SEN statements or Education, Health and Care (EHC) plan
Children at risk of forced marriage
Children with unresolved immigration status
o Unaccompanied Asylum Seeking Children
Children believed to be radicalised
Children missing from mainstream education
o Children in Alternative Provision & Pupil Referral Units
Children entering the Criminal Justice System
Young carers
Children who are homeless or who are in insecure/unstable housing
o Children receiving MH treatment
o Children receiving in-patient MH treatment
Technical Report 1 sets out the many issues in measuring a total for each of these three groups, including inconsistencies of time period, population, definition and method used by various reports, surveys and agencies. It sets out the analysis drawing mainly from published sources of data, including new analysis to adjust data to address inconsistencies across different ways in which childhood vulnerability is reported. Technical Report 2 provides new and original analysis from the Adult Psychiatric Morbidity Survey of the numbers of children in households in which there is parental domestic violence or abuse, mental health problems and drug and alcohol misuse; the so-called ‘Toxic Trio’ which is known to present very high risk to children.
[image:9.595.63.553.56.320.2]9 Table 3: Aggregate numbers of vulnerability by type
Type I:
Children receiving statutory support
Type II:
Children with complex family needs
Type III:
Children with health-related vulnerabilities
710,000 2,140,000 2,660,000*
Notes:
See Technical Report 1 for detail on sources and methods. Numbers rounded to nearest 10,000 Date:
Type I: the majority of groups refer to the end of Financial Year 2016/17 (31st March 2017).
Type II: Numbers are based on surveys from different years, adjusted with mid-2016 ONS population figures. Type III: Data varies from 2016 to different quarters of 2016/17.
* The measure of health related vulnerability will be refined and revised in subsequent analysis. We are working with sector experts to improve this set of headings, aiming to develop a more structured and consistent way of conceptualising and quantifying need for this large and diverse group of children. This will lead to more precise aggregate analysis.
Technical Report 2 shows that there are around 471,000 children in families where two of domestic violence, parental mental ill health and alcohol or drug abuse are present, and 103,000 children in families where all three factors are present. Given the known significant risk to children in households where these factors are present, we have produced new analysis relating to this group this year, and spoken to children affected to gain an insight into their experiences1.
Technical Report 2 also reveals that around 770,000 children live with an adult who experienced domestic violence and abuse in the last year, including 300,000 children aged 5 or under. We find that 470,000 children live with an adult who is dependent on drink or drugs, including 180,000 children aged 5 or under. Around 1.6 million children live with an adult who experiences severe mental health problems, such as showing clear signs of a mental or psychiatric disorder or having attempting suicide or self-harm within the past year. This includes 470,000 children under the age of 5.
Altogether, 2.1 million children under 18 live with an adult experiencing at least one of these issues, including 690,000 children aged 5 or under. Around 471,000 children live with an adult experiencing two of these issues, including 159,000 children aged 5 or under. Furthermore, 103,000 children live with an adult who is experiencing all three issues simultaneously – the so-called ‘toxic trio’. This includes 52,000 children aged 5 or under.
As shocking as all of these numbers are, they are actually conservative estimates which will not capture the true scale of these issues. This is because the figures come from a survey which only interviewed one adult per household, and only asked about issues affecting that person. In many households one adult might not face these issues but another adult does, and our figures would not pick that up if the other adult was not in the survey. So the numbers of children living in a household where any adult experiences these issues will be substantially higher.
10
3. Gaps in support to address complex family need
The vulnerability framework in Annex 1 describes a wide range of forms of vulnerability and of ways measuring levels of need. We focus in this section on the estimate of how many children have complex family needs without having known access to any form of support that is recognised by central government through its funding or monitoring of the provision of local services. This is due to our concern about those we call ‘invisible’ children - those under the radar of current services, who may emerge later as crisis cases through referrals to the care system or through involvement with the criminal justice system or other statutory services such as Tier 4 mental health referrals. Many such children may have been known about to some individual local agencies but there is often insufficient recognition and formal assessment of combined need.
There are many forms of vulnerability that are not included in the aggregate category of complex family need. For example children with speech and language difficulties can be thought of as part of a vulnerable group in their own right. Children with complex family needs are more likely to have speech and language difficulties on average and some children who are in both groups may be in receipt of speech and language help. However, here we focus on the question of how many children with complex family needs are receiving known support for the family related vulnerability thorough the two major forms of support that are recognised and funded by central government for such children - ‘Children in Need’ or the ‘Troubled Families Programme’, both assessed and delivered by local authorities. In addition we take account of children identified as young carers. Children in Need is a large group of children identified and supported by local Councils for a wide range of reasons. Children in families in the Troubled Families programme are children with complex family needs who receive funding and support through a centrally funded programme.
Technical Report 1 provides a preliminary and indicative estimate of the number of children having such complex family related vulnerability but not currently accessing help as Children in Need or through the Troubled Families Programme or as young carers. Due to gaps in the data and inconsistencies in the age, time and definition between data sources, this is a challenging number to estimate. Apart from data issues, it is also hard to assess whether a child receives the support she needs or if the support fully addresses the family related vulnerability. A child who is recognised, for example, as a Child In Need in receipt of additional care, may also have other vulnerabilities that have not been identified or for which the support received is not enough. There will be some Children in Need for reasons other than family related vulnerability. There will also be children receiving support that is not known about or collated centrally.
Ideally we would like to know at a single point in time how many children are experiencing the complex family related vulnerabilities we have identified and of these how many are also receiving help and support through these two programmes. As Technical Report 1 explains we have had to make a number of assumptions to estimate this number and the precision of the resulting estimate should not be overstated. However, if anything our estimate is cautious. We estimate that at a snapshot point in time in 2016/17:
We estimate (Table 3) that 2,140,000 children are in families with identified family-related vulnerabilities.
11
This leaves 1.57 million children in families with complex needs for which there is no national established, recognised form of support.
We do not mean to say that all of these children necessarily need help, nor that the help needed should necessarily be in the form of professional services. Furthermore, many of these 1.6 million children may well be receiving support at a local, family or individual level which is not recorded in any aggregate national statistics. However, this is a large group of potentially highly vulnerable children for whom there is no established framework of assessment and intervention other than the patchwork provision of local, family, community and voluntary services that may or may not be present in their lives, or the statutory services such as criminal justice or social care.
4. What should be done?
This research identifies a stark gap between the number of children with additional needs and those getting support. We know that failing to provide support often has major consequences for children to bear, but also carries a substantial cost to the state. The total cost of late intervention is estimated to be £17 billion per year2, and this is just the immediate fiscal costs incurred when acute and statutory
services have to step in to pick up the pieces. The wider economic, social and longer run costs are far greater.
What do we know about children getting support?
There are a lot of agencies supporting vulnerable children, and a lot of money is spent supporting them. The most intensive, and expensive, support is provided to those children accommodated by the state.
Child in a secure children’s homes - £204,000 per year3
Child in Tier 4 mental health services - £61,000 per admission4
Child in care – £55k per year5
Then there are children who receiving acute community support:
Tier 3 mental health support - £2,338 per referral6
Children in PRUs - £33,685 per annum7
Child placed in a privately run special school - £52,000 per year8
Children on a child protection plan – £5,583 on average per year9
Research carried out by the Institute for Fiscal Studies for the Children’s Commissioner showed that children who are considered ‘in need’, among them those on a child protection plan or being taken into
2http://www.eif.org.uk/publication/the-cost-of-late-intervention-eif-analysis-2016/
3
https://www.parliament.uk/business/publications/written-questions-answers-statements/written-question/Commons/2016-01-19/23107/
4
https://www.childrenscommissioner.gov.uk/wp-content/uploads/2017/10/Childrens-Commissioner-for-England-Mental-Health-Briefing-1.1.pdf
5 Source: New Economy Manchester Unit Cost Database (
http://www.neweconomymanchester.com/our-work/research-evaluation-cost-benefit-analysis/cost-benefit-analysis/unit-cost-database)
6
https://www.england.nhs.uk/mentalhealth/wp-content/uploads/sites/29/2015/08/nhse-camhs-baselining-summary1.pdf (p11)
7 DFE Statistics, SFR71/17 SFR Expenditure by Local Authorities and Schools on Education, Children and Young People’s Services in England, 2016-17 (Table 4)
8https://schoolsweek.co.uk/private-special-school-places-cost-480-million-per-year/
9The Cost of Late Intervention: EIF analysis 2016 – Technical Report (
12 care, together account for some 85% of the entire local authority children’s services budget – around £7.3 billion per year. Nearly half of the children’s services budget – around £4 billion per year – is spent on the 73,000 children in care. Yet the analysis we have presented here shows that there are nearly 1.6 million children with complex family needs who are receiving no known, structured support for their additional needs.
This creates both a moral and economic imperative to act. For too long the extent of unmet need among children has been hidden by lack of data: nobody has made the effort to collect all of this information in one place before. A prevalence survey into children’s mental health needs which will be published this autumn by NHS England – the first time in 14 years – will show a similar story: children’s needs overlooked for too long, and we know that acute services from CAMHS are now under intense pressure as a result.
The answer to the scale of need revealed in our childhood vulnerability study cannot be to expand current ‘crisis’ services indefinitely. This is unaffordable and often disproportionate – it is not in the best interests of a child nor is it feasible or necessary for every child in a high-risk situation to be placed on a child protection plan. Instead, we should focus on expanding the provision of lower-level services which support children and families, making them routine to access. We would like to see the Government have as strong a focus on children’s emotional well-being as they do on their exam results.
Unfortunately, it is lower level preventative services which have been most affected by changes in Government spending since 2010: funding on non-statutory, preventative and early intervention services for children, as well as youth services funding, has reduced by 60% since 201010. Yet this sort of
help can often be delivered at a fraction of the cost of acute services. A course of counselling for mental or emotional difficulties can be delivered for £1,00011; it costs more than twice as much just to refer a
child to for specialist Tier 3 mental health support. Effective and well-evidenced programmes to address behavioural problems can be delivered for around £1,000 per child in a group setting12, whereas it can
it can cost over £100,000 per year to lock a teenager up in a Young Offender Institution13.
As ministers like to say to kids: you do the maths.
10https://www.childrenscommissioner.gov.uk/publication/public-spending-on-children/ 11 Curtis, Lesley A. and Burns, Amanda (2017), Unit Costs of Health and Social Care 2017. Report number: https://doi.org/10.22024/UniKent/01.02/65559
12 Curtis, Lesley A. and Burns, Amanda (2017), Unit Costs of Health and Social Care 2017. Report number: https://doi.org/10.22024/UniKent/01.02/65559
13 Source: New Economy Manchester Unit Cost Database (
13
List of reports summarised in this overview report
Technical Report 1: Measuring aggregate vulnerability in childhood.
Technical Report 2: Estimating the prevalence of the ‘toxic trio.’ Haroon Chowdry
Technical Report 3: Childhood vulnerability and assets: Diverse experiences of children with
domestic violence in the household.
Technical Report 4: Childhood vulnerability and outcomes in early adulthood.
Voices Report: “Are they shouting because of me?” Voices of children living in households with
14
Annex 1 - Summary Table: Vulnerable groups and latest data
Vulnerability Groups - Children and Young People (CYP) Indicator
CCO estimate Date of estimate Age split Gender split Sub-national split Time
Series Data source
Data quality C YP r e ce iv in g statu to ry c ar e o r s u p p o rt Lo o ke d af te r C YP
Looked after CYP CYP looked after at the end of the year 72,670 2016/17 Children looked after in England including adoption a
Foster care inc. fostered with friends/family CYP looked after in Foster placements 53,420 2016/17 Children looked after in England including adoption a
Placed for adoption CYP looked after - Placed for adoption 2,520 2016/17 Children looked after in England including adoption a
Placement with parents CYP looked after - Placed with parents 4,370 2016/17 Children looked after in England including adoption a
Other placements in the community CYP looked after in other placements in the community 3,090 2016/17 Children looked after in England including adoption a Secure institutions, Children's homes and
semi-independent living
CYP looked after in secure institutions, children's homes and
semi-independent living 7,890 2016/17
Children looked after in England including adoption a
Other residential settings CYP looked after in other residential settings, or residential schools 1,210 2016/17 Children looked after in England including adoption a
C YP i n se cu re se tti n gs
CYP in immigration detention 0
CYP in Youth custody CYP in custody 833 Dec-17 Youth Justice Board Statistics - Youth Custody Report a
CYP in Mental health secure Tier 4 Mental health detention episodes for CYP 1,044 2016/17 Mental Health Act Statistics b
CYP in Secure welfare accommodation CYP in secure children's homes at 31 March (placed on welfare
grounds) 90 2016/17
Children accommodated in secure children's homes a
Children in Need (CIN) Children in need at 31 March (excluding unborn children) 382,450 2016/17 Characteristics of Children in Need (CIN) b
CYP who are subject to a Child Protection Plan (CPP) CYP who were the subject of a CPP at the end of the year. 49,950 2016/17 Characteristics of Children in Need (CIN) b
C YP w ith p ri o r c ar e e xp e ri e n ce
Former Relevant and Qualifying CYP All CYP aged 17 who had been looked after for at least 13 weeks which began after they reached the age of 14 and ended after they reached the age of 16
620 2016/17
Children looked after in England including adoption a
CYP who returned to their family prior to their
16th birthday
Adopted CYP All CYP Looked After who were adopted during the year 4,350 2016/17 Children looked after in England including adoption a
CYP on Special Guardianship Orders CYP who are currently subject to a Special Guardianship Order (SGO)
23,000 2016/17 Alma Economics estimate using data from: (I) Children looked after in England (including adoption) 2016/17, (ii) Beyond the Adoption Order
c
CYP who have SEN or disability - CYP with SEN statements or EHC plan
Pupils with statements or EHC plans
221,555 2016/17 Special educational needs in England a
C YP kno wn to h av e e xp e ri e n ce d spec if ic p e rso n a l h ar m C YP w h o h av e b e e n v ic ti ms of mal tr e atme n t
CYP who have been sexually abused/exploited
CYP victims of contact sexual abuse
205,287 2011 Radford et al (2011) c
CYP who have been trafficked CYP referred to the National Referral Mechanism (non-sexual
exploitation) 1,456 2016/17
National Referral Mechanism Annual statistics b
CYP who have been neglected CYP experiencing parental neglect 944,240 2011 Radford et al (2011) c
CYP who have been physically abused CYP experiencing severe physical maltreatment 385,202 2011 Radford et al (2011) c
CYP who have been emotionally abused CYP experiencing emotional abuse from a parent/guardian 561,128 2011 Radford et al (2011) c
CYP who have been victims of FGM Girls recorded in the Female Genital Mutilation Enhanced Dataset by
age at attendance 15
Q4
2016/17
Female Genital Mutilation (FGM) enhanced dataset b
CYP victims of crime (other than abuse) CYP who experienced victimisation in the last year (all types of crime)
402,501 2016/17 Crime Survey for England and Wales a
C YP w ith a d isab ili ty , i ll-h e a lth o r d e ve lo p me n tal d if fi cu lti e s C YP w h o h av e S
EN CYP with SEN support (without statements or EHC plans)
CYP with SEN support (without statements or EHC plans)
917,164 2016/17 Special educational needs in England a
CYP with speech or communication difficulties
Number of pupils with Speech, Language and Communication Needs
as their primary SEN need 234,076 2016/17
Special educational needs in England a
CYP with Autism Spectrum Disorder CYP with diagnosed ASD 29,013 2010 CCO using Taylor et al (2010) c
CYP with learning disabilities CYP with learning disabilities 297,627 2011 CCO using Emerson et al (2011) c
C YP w ith p h ysi cal ill -h e a lth
CYP who have physical health issues - CYP with a longstanding illness
CYP with a longstanding illness
1,777,000 2016 Health Survey for England a
CYP who have physical health issues - CYP with a limiting longstanding illness
CYP with a limiting longstanding illness
1,009,000 2016 Health Survey for England a
CYP with life-limiting illness CYP with life-limiting conditions in English Hospital Admissions
dataset 37,713 2012
CCO using Fraser et al (2012) c
C YP w ith e mo ti o n a l an d me n tal h e al th issues
CYP with self-reported emotional and mental health issues
CYP aged 5-17 with significant emotional and mental health issues
920,000 2014 Alma Economics - using estimates from the Millennium Cohort Study c
CYP receiving mental health treatment CYP in contact with mental health services at the end of January 2018
269,425 Jan-18 Mental Health Services Monthly Statistics a
CYP receiving in-patient mental health treatment
Admissions of CYP under 18 in CAMHS tier 4 wards
1,348 Q4
2016/17
15
Vulnerability Groups - Children and Young People (CYP) Indicator
CCO estimate Date of estimate Age split Gender split Sub-national split Time
SeriesData source
Data quality C YP i n h o u se h o ld
s or f
ami lie s w ith c h ar ac te ri sti
cs or l
o cati o n s th at i n d ic ate h ig h e r p o te n ti al li ke lih o o d o f c u rr e n t o r fu tu re h ar m
CYP who are homeless or who are in insecure/unstable housing
CYP and expected CYP living in households in temporary
accommodation 120,510 Q4 2017
Statutory homelessness and prevention and relief a
C YP i n p o ve
rty CYP on Free School Meals CYP eligible for free school meals 1,128,840 Jan-17 Schools, pupils and their characteristics a
CYP in low-income families and materially deprived
CYP in material deprivation and severe low income
471,000 2016/17 Households Below Average Income a
CYP in destitution
CYP in Food Poverty CYP experiencing moderate /severe food insecurity (0-14) 1,898,209 2015 CCO - using Brazier 2017 c
CYP in workless families CYP living in workless households 1,050,967 Dec-17 Working and workless households in the UK. a
CYP in families with poor inter-parental relationship CYP in couple-parent families reporting relationship distress (UK)
1,249,820 2016 Alma Economics - using estimates from DWP's "Improving Lives: Helping
Workless Families"
c
CYP in lone-parent families CYP in lone parent families
2,711,307 Q4
2016/17
Alma Economics - using Quarterly Labour Force Survey data c
CYP of prisoners CYP who had a parent in prison at end 30 June (England and Wales)
86,000 2012 Williams et al (2012) c
CYP living with friends or wider family (informal kinship care)
CYP living with friends or wider family (informal kinship care)
40,300 2011 Wijedasa (2015) c
CYP whose parents use substances problematically CYP in families where an adult has reported alcohol or drug
dependency 469,000 2014
Adult psychiatric morbidity survey (APMS) 2014 a
CYP in households that report domestic abuse CYP in households that report domestic abuse 825,000 2016 Alma Economics - using Vizard et al. (2018) c
CYP with mental ill-health in the family CYP where all resident carers are reporting symptoms of
anxiety/depression 893,000 2016
Alma Economics & CCO - using estimates from DWP's "Improving Lives: Helping Workless Families" and APMS (2014)
c
CYP in locations with concentrated poverty and deprivation
CYP in top 10% most deprived areas
2,071,253 2015 Index of Multiple Deprivation a
CYP not meeting the threshold of social worker intervention
CYP who were assessed as not in need
171,920 2016/17 CIN census, internal analysis b
CYP in ‘troubled families’ CYP in funded families on the programme as at 31 December 2016
(England) 407,924 2016
National Evaluation of the Troubled Families Programme 2015 – 2020 b
C YP w h o ar e v u ln e rab le o r o f co n ce rn b y v ir tu e o f th e ir id e n ti ty o r n ati o n al ity
CYP at risk of forced marriage CYP who have been given support of advice by the Forced Marriage
Unit 360 2016
Alma estimate using FCO/Home Office - Forced Marriage Unit Statistics b
C YP w ith u n re so lv e d immi gr ati o n statu
s Unaccompanied Asylum Seeking CYP CYP arriving under Dublin Regulations UASC looked after at the end of the year 4,560 2016/17 Children looked after in England including adoption a
CYP in families seeking asylum CYP in families seeking asylum aged 0-17 6,101 Sep-17 Immigration statistics a
Undocumented CYP CYP who are irregular migrants in the UK 120,000 2012 Sigona and Hughes (2012) c
Refugees
Gypsy, Roma, Traveller CYP Gypsy, Roma, Traveller CYP 23,571 2011 Alma Economics - using Vizard et al. (2018) c
LGBTQ+ CYP CYP identifying as Gay, Lesbian or Bisexual aged 16-24 295,000 2016 ONS Sexual identity, UK b
C
YP at r
isk i n r e lati o n to a cti vi ty o r in sti tu ti o n s o u tsi d e th e h o me
CYP believed to be radicalised CYP that received Channel Support 82 2015/16 Individuals referred to and supported through the Prevent Programme b
Missing CYP CYP reported missing during the year 55,807 2015/16 Missing Persons Data Report b
C YP ou tsi d e mai n str e am e d u cati o n
CYP excluded Pupils enrolments with one or more fixed period exclusions 167,020 2015/16 Permanent and fixed period exclusions in England a
CYP in Alternative Provision & Pupil Referral Units
Pupils in LA Alternative Provision/Pupil referral units
36,752 2016/17 Schools, pupils and their characteristics a
CYP missing from mainstream education CYP reported as missing from education during the year 49,187 2016/17 Ellison,R. , Hutchinson, D. (2018) c
Young people Not in Education, Employment or Training (NEET)
Young people Not in Education, Employment or Training (NEET) –
annual (aged 16-17) 50,700 2016
Participation in Education, Training and Employment a
Young people involved with the criminal justice system Youth cautions or court sentences given to CYP (aged 10-17), year
ending 31 March 40,558 2016/17
Youth Justice Statistics a
CYP involved in gangs Is a member of a street gang (aged 10-17) 27,000 2016/17 Crime survey for England and Wales 2016/17 a
Bullied CYP CYP who have been bullied at any point (aged 10 - 17)
2,559,099 2010 and
2016
CCO estimate using Chamberlain et al (2010) and annual bullying survey 2017 c
C YP car in g fo r o th e rs
Teenage parents Live births to fathers and mothers aged 17 and under (England and
Wales) 7,004 2016
Births by Parents' Characteristics, England and Wales a
Young carers Young unpaid carers (5-17) 173,000 2011 Alma Economics - using 2011 Census a
a National statistics including ONS badged surveys b Official/experimental statistics c Non-government survey or assumption based
estimates
Note: survey %s have been applied to ONS mid-2016 population totals to calculate estimates. Estimates are current at 21st May 2018 for children in England aged 0-17
16
Annex
2 - Estimate of potential unmet need among children with complex family needs (Type II)
Estimate Source Data Definition Method
(1) Children with complex family needs:
Children living with an adult who has experienced domestic abuse in the last 12 months
825,000 LSE (2018), Child poverty and multidimensional disadvantage: Tackling “data exclusion” and extending the evidence base on
“missing” and “invisible” children
CSEW 2015/16
Intimate violence perpetrated by partner, ex-partner or family member in last 12 months
Rate (7%) applied to ONS mid-2016 child population estimates
Children in families where an adult is dependent on drugs or alcohol
469,000 Technical Report 2: Estimating the prevalence of the ‘toxic trio’
APMS 2014
Alcohol consumption at dependent level (AUDIT score ≥ 20) or reported symptoms of drug dependence
Rate (4%) applied to ONS mid-2016 child population estimates
Children in households where both parents report mental ill-health
289,000 DWP, Improving Lives: Helping Workless Families - indicators and evidence base
USoc 2014/15
Both parents scoring 4 or more on GHQ-12 questionnaire
Rate (2.4%) applied to ONS mid-2016 child population estimates
Children in households where a single parent reports severe mental ill-health
604,000 Technical Report 1: Measuring aggregate vulnerability in childhood
APMS 2014
Severe symptoms of mental health issues as defined in Technical Report 2:
Estimating the prevalence of the ‘toxic trio’
Internal analysis showing that of the 1.6 million children in households where adult has severe mental health issues, 38% live with a single adult Children in material deprivation and
severe low income
471,000 DWP, Households Below Average Income:
1994/95 to 2015/16
Material deprivation score ≥ 25 and household income < 50% of contemporary median income, Before Housing Costs
Rate (4%) applied to ONS mid-2016 child population estimates
Children who have a parent in prison 86,000 MOJ (2012), Prisoners’ childhood and family backgrounds: Results from the Surveying Prisoner Crime Reduction (SPCR) longitudinal cohort study of prisoners
Whether current prisoners have a child under 18 or not
Rate (0.73%) applied to ONS mid-2016 child population estimates
Children who are young carers 173,000 2011 Census Children aged 5-17 providing unpaid care Rate (2.1%) applied to ONS mid-2016 child population estimates
Total excluding double-counting 2,140,000 See Technical Report 1: Measuring aggregate vulnerability in childhood
(2) Children known to be receiving national established support for these issues:
Children in need, excluding children looked after
310,000 DfE, Characteristics of children in need: 2016 to 2017; DfE, Children looked after in England including adoption: 2016 to 2017
Children in need on 31 March 2017 aged 0-16+, less Children looked after on 31 March 2017 aged 0-16+
Children in families receiving support through Troubled Families programme
408,000 MHCLG (2017), National evaluation of the Troubled Families Programme 2015 to 2020: early findings
185,420 families supported as at 31 Dec 2016, and on average 2.2 children per family
Young carers supported by local authorities
34,000 CCO (2016) The support provided to Young Carers in England
Estimated number of young carers aged 5-17 supported by local authorities
Total excluding double-counting 570,000 See Technical Report 1: Measuring aggregate vulnerability in childhood
(3) Potential unmet need: difference between (1) and (2) Children with complex family needs who
are not currently known to be receiving the above support
Children’s Commissioner for England
Sanctuary Buildings 20 Great Smith Street London
SW1P 3BT
Tel: 020 7783 8330
Email: [email protected] Visit: www.childrenscommissioner.gov.uk