August 2009
Ambition 2020:
Technical Report
Professor Derek Bosworth
Warwick Institute of Employment Research
Genna Kik
Research Manager
The UK Commission for Employment
and Skills, launched on 1st April
2008, was a key recommendation
in Lord Leitch’s 2006 review of
skills Prosperity for All in the Global
Economy: World Class Skills.
The UK Commission aims to raise
UK prosperity and opportunity by
improving employment and skills.
Its ambition is to benefit individuals,
employers, government and society by
providing independent advice to the
highest levels of the UK Government
and Devolved Administrations on
how improved employment and skills
systems can help the UK become a
world class leader in productivity, in
employment and in having a fair and
inclusive society.
Research and policy analysis play a fundamental role in the work of the UK Commission and are central to its advisory function. In fulfilling this role, the Research and Policy Directorate of the UK Commission is charged with delivering a number of the core activities of the UK Commission and has a crucial role to play in:
Assessing progress towards making the UK a world class leader in employment and skills by 2020;
Advising Ministers on the strategies and policies needed to increase employment, skills and productivity;
Examining how employment and skills services can be improved to increase employment retention and progression, skills and productivities.
Promoting employer investment in people and the better use of skills.
Sharing the findings of our research and policy analysis and engaging with our audience is very important to the UK Commission. All our outputs are accessible in the Research and Policy pages at www.ukces.org.uk This technical report follows the publication of our first Ambition 2020 report this May. The report presents the approach we took to forecasting progress towards the ‘Leitch’ 2020 skills targets, and the data considerations involved. The report also outlines our 2009/10 programme of development work, which will further build upon the models that report progress towards our 2020 Ambition for skills. We hope you find the report useful and informative in building the evidence we need to achieve a more prosperous and inclusive society.
Professor Mike Campbell
Director of Research and Policy
Lesley Giles
Deputy Director and Head of Research
1
Contents
Foreword 3
Acknowledgements 5
1 IntroductIon 6
1.1 Ambition 2020 projections 6
1.2 Structure of this document 7
2 the AmbItIon 2020 models 8
2.1 Overview 8
3 uk QuAlIFIcAtIon
ProjectIons 14
3.1 Introduction 14
3.2 Using qualifications as a measure of skill 15
3.3 Qualifications model overview
and approach 20
3.4 Four nation forecasts 26
3.5 Future work 26
4 the bAsIc skIlls model 28
4.1 Introduction 28
4.2 Basic skills model overview 29
4.3 Data sources: basic skills baseline model 31
4.4 The basic skills model in-depth 33
4.4.1 Demographic sub-model 33
4.4.2 Poor skills 34
4.4.3 Worst and best case scenarios:
using GCSE data 36
4.5 Future work 39
5 InternAtIonAl modellIng 40
5.1 Introduction 40
5.2 International model 40
5.3 Future work 44
6 next stePs 46
APPendIx A 48
APPendIx b 49
glossAry 52
Acknowledgements
tAble oF grAPhs And chArts
Figure 2.1 Ambition 2020: linkages between forecasting models, data, and
reporting 10
Table 3.1 Comparing qualifications by level: ISCED, OECD, and UK equivalents 16
Figure 3.1 The Ambition 2020 UK qualifications model (based on long term trends) 22
Figure 4.1 Basic skills model overview 30
Figure 4.2 Proportion of population below functional literacy and numeracy
levels, 2003 32
Table 4.1 Extract from the demographic
model (numeracy) 34
Table 4.2 Extract from poor skills forecasts
(numeracy) 35
Figure 4.3 Trends in below level 1 GCSE
English, England 36
Figure 4.4 Trends in below level 1 GCSE
Mathematics, England 37
Figure 4.5 Linear and quadratic trends and projections for GCSE Mathematics and English attainment below
Level 1 to 2020 38
Figure 5.1 Ambition 2020 international skills model overview 40
Table 5.1 Japan international model data
prior to adjustment 43
Table 5.2 Japan international model data
post adjustment 43
Table 5.3 New Zealand international model data prior to adjustment 44
Table 5.4 New Zealand international model data post adjustment 44
The authors are grateful to
Peter Millar at the Warwick Institute
of Employment Research for
undertaking the Labour Force Survey
data preparation underpinning
the qualification model detailed in
this report.
Special thanks are due to Mark
Spilsbury at the UK Commission for
his support and guidance through the
development of the Ambition 2020
models and drafting of this report.
We would also like to acknowledge
the contributions made from
colleagues within other government
departments and agencies including
the Learning and Skills Council
data service, and the International
Evidence Team at DCSF for
their guidance on international
qualifications levels. Helpful
1
Introduction
1.1 Ambition 2020 PROjECTIONS
Ambition 2020
, published by the UK Commission for Employment and Skills
in May of this year, formed its first annual assessment of the progress towards
making the UK a world leader in employment and skills by 2020. This technical
report details the sources and methods underpinning the forecasting models
used to make this assessment.
Ambition 2020
monitors progress on our World
Class Skills and Jobs Ambition and against our international competitors in the
context of (i) the ‘Leitch’ Ambition for 2020; and (ii) the aims and priorities for
the four nations of England, Scotland, Wales and Northern Ireland. It provides
a sound evidence base for advice on strategies, policies and measures needed
to increase skills, employment and productivity. The
Ambition 2020
report
provides the baseline from which to assess future progress.
Specifically our models for the Ambition 2020
report forecast:
The 2020 qualifications profile for the UK and for individual UK nations;
The UK 2020 basic skills position for literacy and numeracy;
Our 2020 international ranking vis-à-vis OECD countries for (i) below upper secondary (‘low skills’), (ii) upper secondary (‘intermediate skills’) and (iii) tertiary (‘high skills’) levels of education.
The results of the projections can be found in Ambition 2020: World Class Skills and Jobs for the UK. This report details the agenda for prosperity, jobs and skills, and the 2020 ambition for skills and jobs. After summarising recent progress the report presents the results of the forecasts for 2020. Alternative measures of skills development, the jobs of today and tomorrow, raising employer ambition, and skills and employment policy are also discussed.
A second document Ambition 2020: Key findings and implications for action
summarises the Ambition 2020 key findings of the main report, including the headline results from the forecasting work. It then goes further to outline the UK Commission’s view of the actions that are required for the employment and skills system to respond to our current difficult economic conditions and to lay the foundations for recovery.
However, we are not bound to the Leitch models. Where the models can be further enhanced to increase their robustness and coverage we will aim to develop them. We will continue for example to review the underpinning assumptions of the models and their data, and make improvements where needed. Whilst we’re mindful of maintaining consistency of our approaches over time, developments may mean year-on-year that our forecasts change. However we will be clear in our approaches and aim to report comparable results had our methods remained unchanged.
We publish this technical report in the interests of transparency and debate. The 2020 targets are a shared ambition and the UK Commission has a responsibility to ensure that our reporting towards these targets is transparent. We also acknowledge when undertaking exercises such as this modelling work that there are data and definitional issues for consideration. We are therefore happy to engage in an open dialogue with experts who may have questions or ideas of how we might make our forecasting models even more robust in the future.
1.2 STRUCTURE OF THIS DOCUMENT
This document gives a detailed description of the forecasting models used within Ambition 2020. Chapter two gives a brief overview of the models that have been used, how they link back to the main Ambition 2020 report, and the connections between the models. From chapter three onwards each
forecasting model is considered in more detail, the first discussed is the qualifications model, here the data issues and sources are considered as well as a step-by-step guide to the workings of the model, details for the 4-nations projections are also outlined. Chapter three concludes with details of future plans for the qualifications model. Chapter four takes a similar approach to chapter three, this time for the basic skills model, the development of the model for next year is considered. Chapter five details the method used for the international forecasts.
2
The Ambition 2020 Models
2.1 OvERvIEw
The
Leitch Review
set out an ambition for the UK to become
a world leader
in skills by 2020
, moving the UK into the top eight in the world, at every skills
level, i.e. being in the top quartile of OECD countries.
To enable this ambition Leitch (2006, p. 137) identified a need to commit to four objectives:
95% of adults to have functional literacy and numeracy (basic skills), up from 85% literacy and 79% numeracy in 2005.
More than 90% of the adult
population qualified to at least Level 2, with a commitment to achieving World Class skills.
Shifting the balance of intermediate skills from Level 2 to Level 3. world Class high skills, exceeding 40% of the adult population qualified to Level 4 and above, with an increased focus on Level 5 and above skills.
The UK Commission Ambition 2020 report assesses our likely progress and prospects for achieving this World Class standing in skills. Underpinning this work three forecasting models were utilised by the UK Commission to project our skills profile to the year 2020:
A basic skills model projecting the future stock of people of working age who lack functional literacy or numeracy skills. A qualifications model which charts progress towards low, intermediate, and high level skills (as measured by qualifications) for the UK and individual nations.
An international model forecasting how our low, intermediate and high level skills mix will rank against OECD countries in 2020.
The models assume changes in qualification/ skill levels are driven by three forces: a qualifications effect, as people who are already in the workforce increase their qualifications level; a demographic effect, whereby older individuals leave the working age population and are replaced by younger people who leave the education system and enter the labour market. Generally, this is a positive effect, as young people flowing into the workforce are (on average) more highly qualified than the average (though not necessarily more so than comparable groups in other countries) and significantly more highly qualified than those older people retiring from the active workforce; and a migration effect, reflecting the skills of the people who migrate into the UK and the skills of the people who migrate out of the UK. However whilst these effects underpin changes in qualifications/skill levels at present only the qualification model takes account of all three of these effects.
Figure 2.1 gives a brief overview of how each of the forecasting models flowed into the
Each of the three main models feeds directly into their respective reporting in Ambition 2020. The only exception to this are the UK results presented for the 2020 international skills position (Ambition 2020, table 4.1). As the qualifications model for the whole of the UK is more sophisticated than the international model (owing to the richer UK data available), the UK 2020 skills profile is imputed from the UK qualifications model into the international rankings. Similarly, both the current and projected international skills positions for the four UK nations are imported from the qualifications model (sub-national geographies are not available within the OECD data). In order to remain comparable with the OECD projections, and compare internationally, only the skills profiles for 25-64 year olds are used from the qualification model.
Figure 2.1:Ambition 2020: linkages between forecasting models, data, and reporting
Ambition 2020
Outcome
Forecasting
Model
Data
Forecasting
Sub-models
OECD ‘Educational Achievement: adult population’, (Highest qualification
level by country and year
Labour Force Survey, (Highest qualification
level by age, sex and year)
International
Skills Position
in 2020
(Ambition 2020,
table 4.1)
International
Model
(Technical Report, Chapter 5)
UK and 4-Nations
2020 Skills Position
2020
Qualifications
Attainment
(Ambition 2020,
tables 4.3-4.6)
Qualifications
Model
(Technical Report, Chapter 3) ONS population
estimates (including immigration and emigration by age,
sex and year)
2003 Skills for
Life Survey AttainmentsGCSE
Four Nations
Model
((Technical Report,Chapter 3.4)
2020
Basic Skills
Attainment
(Ambition 2020,
table 4.2)
Basic Skills
Model
(Technical Report, Chapter 4)
Baseline
Model
((Technical Report,Each of the forecasting models is discussed in detail in the subsequent chapters. The assessment of the UK’s likely skills trajectory has involved extensive work to review, refine and update the models used by the Leitch Review team. This work is detailed within the report as well as avenues for further research and development required to improve the quality of these assessments in future years.
What we are assessing with these models is the likelihood of achieving the 2020 skills targets on the basis of recent trends. A different tool is used by BIS to examine progress to 2020. Their forecasts work as a planning tool, setting out the achievements that will be needed in the future to reach the 2020 targets. In this sense they, necessarily, show the 2020 targets being reached. Box 2.1 gives further details.
BOx 2.1 COMPARING APPROACHES TO SKILLS FORECASTING
There are varying forecasting methods that can be used with time-series data, and also differing approaches to skills forecasting more specifically.
The UK Commission’s forecasting approach is based on taking past skills performance and projecting forward. Where possible the methodology explicitly takes account of population changes (including migration) as well as changes in the qualifications gained by the workforce as they progress through their working lives. The most robust and recent data currently available is used to undertake this exercise. There are known issues with some of these data sources such as comparability of OECD country data, and possible under-reporting of qualifications within the Labour Force Survey. The UK Commission’s annual forecasts will, over time, benefit from the work of other departments and
international partners as they work towards improving the accuracy of their data sources. However, as the UK Commission is not closely involved in such development work, and in order to maintain a transparency of approach over time, it only adjusts for obvious data anomalies. The UK Commission needs to maintain a consistency of approach: in the 2009 forecasting exercise for Ambition 2020, it chose to maintain consistency in its first year of reporting by keeping the forecasting approach broadly the same as that used in the Leitch Review.
The Department for Business, Innovation and Skills (BIS) also forecast the proportions of the workforce who attain basic skills, Level 2, Level 3 and Level 4 qualifications for future years up to 2020. BIS forecasting models use planned, future, publicly-funded achievements together with expected population flows, death and migration effects, and private upskilling to predict the skills position (of England) up to 2020 assuming that planned levels of investment are implemented.
In this respect then the BIS and the UK Commission’s models whilst both projecting forward to 2020 do two quite different things – as well as being useful for BIS internal business planning, the BIS models give us an indication of just how much investment will be needed to get us where we want to be in 2020. In contrast the UK Commission forecasting takes the current trends and forecasts these forward, showing at the current rate of progress where we expect to be in 2020. In this respect the two approaches can be seen as complementary rather than contradictory and strengthen the argument that continued and increasing investment in skills should be sustained over future years if we are to reach our 2020 Ambition. We would expect that over time the BIS planned achievements and recent years’ increases in skills investment will feed positively into the UK Commission’s forecasts in future years (as these begin to be reflected in the data on
UK Qualification Projections
3
3.1 INTRODUCTION
As part of its annual reporting, the
Ambition 2020
report published progress
towards the Leitch qualification ambitions for 2020.
In particular progress was assessed towards the targets of:
90% Low level skills – adults qualified to at least Level 2
68% Intermediate level skills – adults qualified to at least Level 3
40% High level skills – adults qualified to at least Level 4.
The UK qualification model undertakes this assessment by projecting to 2020 the mix of qualifications the UK adult population will hold.
The qualification model developed for this year’s Ambition 2020 forecasting exercise uses the same basic approach as the HM Treasury model used by the Leitch Review. That is, it uses linear time series forecasts of qualifications proportions over the period to 2020 and pins these to the Centre for Demography (ONS) projections of the future population over the same period. Box 3.1 highlights the key differences between the Leitch and Ambition 2020
qualifications model.
BOx 3.1 KEY DIFFERENCES IN THE APPLICATION OF THE LEITCH AND
Ambition 2020 QUALIFICATIONS MODELS
The Ambition 2020 projections are carried out using broadly the same approach as the Leitch projections, however important differences include:
The period used in making the projections has changed; the Leitch series from 1997 to 2003 has been extended to 2007.
Differences are caused by the changes in population forecasts by the ONS Centre for Demography and, in particular, the revisions made to projections of migratory flows. This is potentially important if there are differences between the qualification mix of emigrants and immigrants.
The Ambition 2020 models have more detailed items relating to qualifications by age. Individual years of age between 16 and 64 are used (there are problems with the LFS qualifications data for those above State pensionable age in the historical data), while the earlier Leitch model used individual years of age only up to age 30 and then all individuals aged over 30. Thus, the Ambition 2020 model allows the exploration of the effects of policy initiatives on the qualifications held by older individuals.
No attempt is made to model the implications of the changes to female pensionable age (as in the original Treasury model). This is problematic anyway because of missing qualifications information for females above 59. In the present model all females aged 16 to 64 are included, and the missing data on qualification proportions for the 60-64 year old females is estimated by simple regressions using the changing qualification proportions for slightly younger females.
The remaining sections in this chapter explore the qualification classifications underlying the model, how the qualifications model works, the rationale behind various aspects and choices made with the modelling work are discussed, and any key data issues or considerations highlighted. The chapter concludes by discussing areas for future development.
3.2 USING QUALIFICATIONS AS A MEASURE OF SKILL
An important consideration in projecting progress of skill levels to 2020 is the way in which these skill levels are defined and derived. Ambition 2020 (UKCES, 2009, p.46) acknowledges in practice there are a range of definitions and meanings of skills. There is a body of literature that looks in depth at the issues related to the measurement of skills (usefully summarised in LSC, 2002, p.5-10.), and the Ambition 2020 report extends as far as possible to include a range of measures of skills. Traditionally however skills have been measured by qualifications, despite their shortcomings as a proxy for skills; qualifications allow relatively simple and straightforward comparisons over time, between sub-groups, and internationally (LSC, 2002, p.6).
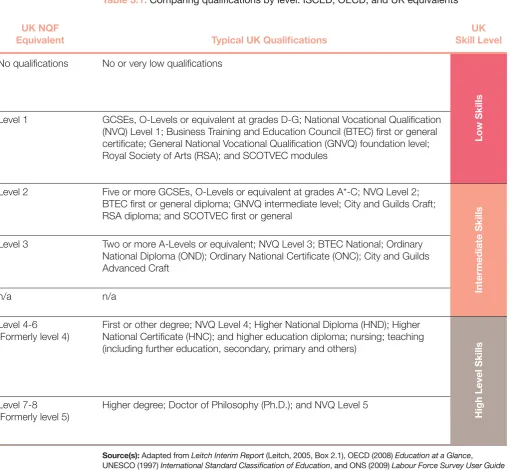
The Ambition 2020 qualifications model classifies qualifications into the six levels set out in table 3.1 below (see “UK Equivalent Levels”). These six national qualification framework (NQF) levels are a common and accepted standard in the UK for classifying UK qualifications.1 More recently these UK qualification levels have been expanded to eight levels, with the previous levels four and five expanded, this new mapping is also noted in table 3.1.
These UK qualifications levels can be grouped into low skills (no qualifications and Level 1); intermediate skills (Level 2 and 3) and high skills (Level 4 and above). This ‘common currency’ allows comparisons across sub-groups of the population, time and, to a certain extent, between countries. Table 3.1 shows how UK qualifications map onto international classifications (specifically, the International Standard Classification of Education 1997 (ISCED) and the groupings and descriptions used by OECD in Education at a Glance).
In the past there has been some debate about the classification of qualifications at an international level. Prior to the introduction of ISCED 1997, the international standard was ISCED 1976. The ISCED 1976 standard was implemented differently by Eurostat and OECD, which has caused some confusion in the past. Under ISCED 1976 Eurostat coded GCSE’s for example to ISCED level 2, whereas OECD coded GCSE’s to ISCED level 3. This has subsequently caused confusion when for example the Eurostat ISCED 1976 coding was used by the International Adult Literacy Surveys (IALS), and published as Adult Literacy in Britain in 1997 (Carey et al. 1997, p.162-163). This survey was undertaken prior to ISCED 1997 being implemented, however the coding has since (on occasion) been incorrectly replicated by other surveys.
Eurostat and OECD are now in alignment with each other in their assignment of qualifications to ISCED 1997. ONS have recently updated volume five of their LFS user guide (ONS, 2009, p.105-108) which shows the ISCED 1997 mapping to UK qualifications. Importantly, UK Level 2 qualifications are mapped to ISCED 3C (Long programme), which is classified as “Intermediate Level Skills” or “Upper Secondary Education”.
1 The manner in which
Low Skills
Intermediate Skills
High Level Skills
UK NQF UK
Equivalent Typical UK Qualifications Skill Level
No qualifications No or very low qualifications
Level 1 GCSEs, O-Levels or equivalent at grades D-G; National Vocational Qualification (NVQ) Level 1; Business Training and Education Council (BTEC) first or general certificate; General National Vocational Qualification (GNVQ) foundation level; Royal Society of Arts (RSA); and SCOTVEC modules
Level 2 Five or more GCSEs, O-Levels or equivalent at grades A*-C; NVQ Level 2; BTEC first or general diploma; GNVQ intermediate level; City and Guilds Craft; RSA diploma; and SCOTVEC first or general
Level 3 Two or more A-Levels or equivalent; NVQ Level 3; BTEC National; Ordinary National Diploma (OND); Ordinary National Certificate (ONC); City and Guilds Advanced Craft
n/a n/a
Level 4-6 First or other degree; NVQ Level 4; Higher National Diploma (HND); Higher (Formerly level 4) National Certificate (HNC); and higher education diploma; nursing; teaching
(including further education, secondary, primary and others)
[image:16.595.59.571.174.645.2]Level 7-8 Higher degree; Doctor of Philosophy (Ph.D.); and NVQ Level 5 (Formerly level 5)
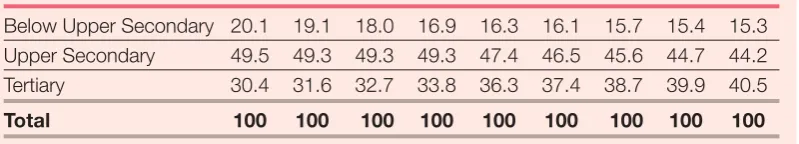
Table 3.1: Comparing qualifications by level: ISCED, OECD, and UK equivalents
Source(s): Adapted from Leitch Interim Report (Leitch, 2005, Box 2.1), OECD (2008) Education at a Glance, UNESCO (1997) International Standard Classification of Education, and ONS (2009) Labour Force Survey User Guide – Volume 5: LFS Classifications (2009, p.105-108).
Below Upper Secondary
Upper Secondary
Education
Tertiary
ISCED OECD
Level ISCED Description OECD Description Skill Level
Level 0 Pre-Primary Education Pre-primary and primary education
Level 1 Primary Education or First Stage of Basic Education
Level 2 Lower Secondary or Second Lower secondary education
Stage of Basic Education
Level 3 ISCED 3C (short programme)
(Upper) Secondary Education ISCED 3C (long programme)
ISCED 3A/3B
Level 4 Post-Secondary Non-Tertiary Post-secondary non-tertiary
Education education
Level 5 First Stage of Tertiary Education Tertiary Education: Type A (Not leading directly to an
advanced research qualification)
Tertiary Education: Type B
Level 6 Second Stage of Tertiary Education Advanced research programmes (Leading to an advanced research
3
To assess the stock of skills as measured by qualification levels the Labour Force Survey (LFS) is the most commonly used source of data, owing to its large sample size, comprehensive UK coverage, regularity of data collection, and robustness. The LFS also provides data to the European Union Labour Force Survey (EU LFS), and is used for international comparisons by the OECD. However there are a number of data issues for consideration when using the LFS data for overall qualification levels. Estimating the proportion of the population qualified at different levels using LFS data is not a straightforward task. Results can differ depending on a number of factors, including:2
1 The vintage of the data set (ONS release different versions, incorporating corrections and adjustments based on other data to benchmark the numbers more robustly).
2 There are also different versions of the LFS available at the same time which can contain different information (e.g. Government Departments get uncensored access to the data while public versions of the data set have various information suppressed because of concerns about confidentiality and data protection issues).
3 The coverage over time. The LFS is conducted quarterly, using an overlapping sample (i.e. individuals appear for five consecutive quarters and are then replaced). There are some differences in the information collected in each quarter. Quarters can be combined together to create an annual average but this requires careful treatment to avoid double counting of some
individuals due to the same individual being questioned in subsequent quarters.
4 There are a number of slightly different questions relating to qualifications resulting in a choice of possible variables in the final survey results.
5 The allocation of individual qualifications to NQF levels is not straightforward. The mapping is complicated by the need to recognise that in some cases some proportion of individuals have achieved the threshold levels to move them up from one NQF level to the next (this will depend on the grades achieved and the number of qualifications obtained).3 This information is not always available in the LFS and an apportionment based on other information is needed. This requires a procedure to randomly select and allocate individual cases which can lead to sampling variation of estimates taken from the LFS, separate from the normal statistical variation. This approach is necessary in a number of situations, as described in more detail in appendix A.
6 The LFS is a complex survey and routing through the questionnaire can affect the number of missing cases. The proportions with different qualifications can be affected by this. Unless this routing is dealt with in precisely the same way when interrogating the survey slightly different results can be obtained.
7 Variations can also arise because of the use of a different population (for example excluding all above the official retirement age).
8 Differences can also arise because the focus is sometimes only on the highest qualification held as opposed to all qualifications held. Only taking the highest qualification may mean individuals are allocated to a lower qualification level than using ‘all qualifications’ (also known as an ‘additive approach’). The sum of all the qualifications held by an individual may move them into a higher qualifications level.
2 Details of the
specific procedures, assumptions, and choices adopted for the 2009 Ambition 2020 UK qualification forecasting exercise are given in appendix A.
3 For example an
4 Further details on our approach can be found in Appendix A and B.
Unless all of these factors are harmonised, two independent interrogations of the LFS can lead to very different outcomes. Without very detailed documentation on how data were extracted and estimates made it is often not possible to exactly replicate results. Our approach to using the LFS for this work is outlined in more detail in appendices A and B. However to summarise, we used LFS datasets based on the 2004 weighting exercise, the fourth quarter of each year’s data were used, those above official retirement age were excluded, and an ‘additive approach’ to deriving qualifications levels utilised.
In addition to the discussions and literature around qualifications being an imperfect proxy for skills and not fully reflecting the stock of skills held by the population, there are also concerns that when we do measure skills via qualifications levels that the LFS may not be fully capturing the stock of qualifications held by the population. As indicated earlier, there are always a number of cases missing in the LFS and in addition there are significant numbers of cases where individuals respond that they “Don’t know” the qualifications they hold.
This has led to worries that the LFS may be under-reporting qualification levels in the UK, particularly with regard to trade apprenticeships, vocational qualifications, and the qualifications of migrants. As such BIS are working with the Office for National Statistics to review the education and training section of the LFS. BIS have been undertaking analysis, research, and consultation around these issues, with the aim of introducing an improved education and training section on the LFS in 2011. The hope is that the new section will be more effective at getting the correct information whilst at the same time reducing the burden on respondents’ time. The changes that will be introduced in the LFS may produce a discontinuity to the statistics after that date.
In the meantime these types of problems (missing cases, and the treatment of “Don’t Knows”) can be dealt with in various different ways. One possibility is to assume that such cases all have the same probabilities of holding qualifications as the population as a whole. Another is to assume that those who don’t know have no qualifications. A third possibility is to allocate them all to a residual category. These different approaches can lead to quite different outcomes and, as with the other data issues highlighted above, detailed documentation on the approach used is the only way to ensure results can be replicated with two separate interrogations of the LFS.4 In the present work, where the response was ‘don’t know’, the individuals are allocated as ‘other qualified’, while those with no response were excluded. There is, however, no current evidence of which method of dealing with this problem is the most appropriate.
3.3 QUALIFICATIONS MODEL OvERvIEw AND APPROACH The previous sections in this chapter have outlined what we are measuring progress towards (i.e. Leitch Skills targets) in the qualifications modelling work, why qualifications are used as a proxy for measuring these skills ambitions, which qualification levels are used in the work, and issues around measuring qualifications levels using the LFS. This section now moves on to look in more detail at the approach used to achieve our Ambition 2020 qualification forecasts.
Our UK qualifications model is constructed using the average annual rate of change in the qualifications held, by age, for the previous ten years and then rolls this forward to 2020. The approach explicitly allows for demographic changes such as an ageing population, changing retirement patterns and pension age changes and migration patterns. It should be noted that it is not designed to give a precise forecast of qualifications in 2020, but to give indicative projections of the UK’s likely skill profile if recent/current trends continue. It is also capable of testing the impact of different scenarios.
The sub-model used to derive the 2020 forecasts for the four individual UK nations is a simpler iteration of the UK qualifications model.
The qualifications projections are based on a series of linear extrapolations of changes in qualification levels and participation rates. This follows the methodology used by HM Treasury for the Leitch Review (although the model is organised in a somewhat different way for Ambition 2020).
Two sets of extrapolations are provided within the qualifications model:
Long term trends, based upon historical, fourth quarter LFS qualifications data from 1998 to 2007 inclusive;
Short term trends, based on historical, fourth quarter LFS qualifications data from 2002 to 2007 inclusive.
Both sets of projections (based on long and short term trends) were derived using exactly the same method; the only difference is the length of the time series upon which the forecasts are based. Both the long and short term extrapolations were produced in the same workbooks, however for brevity only the forecasts based on the long term trends are discussed in any depth in this chapter. The use of both short and long term trends is rooted in the earlier Treasury work which suggested that, at that time, the more recent trends gave a more pessimistic picture than the longer term trends. This study found relatively little difference between the two sets of projections and the projected 2020 attainment presented in Ambition 2020 is based on the long term trends.The emerging differences between the short and long term trend projections is something the UK Commission will continue to monitor, however, it is expected that recent investments in education and training should begin to show through as an upturn in the short term trends.5
5 Also note that there
will always be time lags between data and publication, and this may mean that any recent improvements (i.e. in Level 2 & Level 3 for example) will not be reflected in the data until future years.
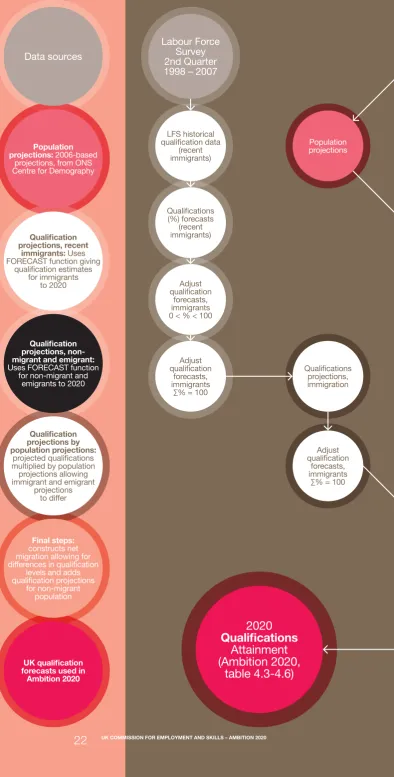
Figure 3.1 below summarises the data flowing into the UK qualifications model, and the relationships between the different worksheets used to derive the forecasts used in Ambition 2020.
The starting point for the qualifications model is the 2006-based population projections by the Centre for Demography at ONS. These were the latest available when undertaking the forecasting work, ONS will be releasing 2008-based population projections in October 2009, which will be used in our 2010 version of Ambition 2020.
2020
Qualifications
Attainment
(Ambition 2020,
[image:22.595.60.455.57.835.2]table 4.3-4.6)
Figure 3.1:The Ambition 2020 UK qualifications model (based on long term trends)
Qualification projections, net migration Labour Force Survey 2nd Quarter 1998 – 2007
Population
projections Immigration projections
Adjust qualification
forecasts, immigrants
∑% = 100 Adjust qualification
forecasts, immigrants 0 < % < 100 Qualifications (%) forecasts (recent immigrants) LFS historical qualification data (recent immigrants) GAD Population forecasts Qualifications projections, immigration Adjust qualification forecasts, immigrants
∑% = 100
UK qualification forecasts used in Ambition 2020
Data sources
Qualification projections, non- migrant and emigrant:
Uses FORECAST function for non-migrant and
emigrants to 2020
Population projections: 2006-based
projections, from ONS Centre for Demography
Final steps: constructs net migration allowing for differences in qualification
levels and adds qualification projections for non-migrant population Qualification projections by population projections: projected qualifications multiplied by population projections allowing immigrant and emigrant
projections to differ
Qualification projections, recent
immigrants: Uses FORECAST function giving
qualification estimates for immigrants
Net migration projectionsEmigration
LFS historical qualifications data
(non migrant and migrant) adjust to
sum to 100. LFS historical qualifications (non migrant and
emigrant)
Adjust qualification
forecasts ∑% = 100 Adjust qualification
forecasts 0 < % < 100 Qualifications (%) forecasts Labour Force
Survey 4th Quarter 1998 – 2007
Population projections (no migration)
Qualifications projections,
emigration
Qualifications projections, with
no immigration
Qualifications projections, cumulative net
migration
Qualification projections, total
population
Adjust qualification projections to sum to total
Adjust qualification
projections 0 < = 100
Adjust qualification
forecasts, emigrants ∑% = 100
Adjust qualification forecasts, with
Considering the migration effect in more detail, the qualifications of emigrants and immigrants may not be the same. As such, two separate projections giving the future qualifications profiles of each group are derived. It follows therefore that the immigrant population projections flow as an input into the qualifications projections for immigrants, and similarly the emigration estimates flow into subsequent qualifications forecasts for emigrants.
Net migration is also derived from the population projections (by subtracting emigration from immigration), this then feeds into a set of qualifications forecasts that model the qualifications profile in 2020 assuming no migration. This step is utilised later in the model to help adjust for the rationale that there may be differences in the qualifications levels of immigrants and emigrants.
The qualifications forecasts are sensitive to the underlying population forecasts, and the impact of the assumptions about migration is subject to some uncertainty for a number of reasons. The migration data are very volatile. Predicting future migration levels and qualification attainment using past trends may be a key element to consider in the achievement of the various targets. Each wave of inward migration in recent years has been characterised by different qualifications profiles. Although recent changes to the rules and regulations for inward migration will make it more difficult for unqualified and poorly qualified people to enter the UK from outside the EU, the impact of such changes remains to be seen. Also for those entering from European Union Member States, no constraints can be placed on their entry (SSDA, 2008).
To improve the migration element of the qualification forecasting work, we will be working with the updated population projections in the 2010 version of Ambition 2020. The UK Commission will also look in more detail at the sensitivity of the forecasts to migration assumptions, and consider whether there is any supplementary information about migration flows that might be used to augment the qualifications model. The LFS is the key source of information used for the qualifications data that are allied to the population projections in order to achieve the 2020 qualifications forecast. A historical series of fourth quarter LFS data is constructed for the period 1998 to 2007 containing the proportion of individuals at each qualification level (using the National Qualifications Framework as set out earlier) by age and sex.6 With the exception of immigrants (which have a separate time series constructed), fourth quarter LFS data is used to cover the population on the basis that most qualifications are awarded during the summer quarter.
The historical qualification information for immigrants (1998-2007) is also taken from the LFS, however this group’s data is taken from the second quarter of the LFS as this is the only quarter in which it is available. The results are based on those not resident in the UK one year prior to the survey; the data for the relevant year are used (e.g. immigrant qualification data for the second quarter of 2002 is used alongside UK population data from the final quarter of 2002).7 Even this is problematic as it is difficult, if not impossible, for the interviewers to code all types of foreign qualifications. Hence, a number of assumptions and approximations are made in coding the immigration qualification data.
6 The 60+ data for
females and the 65+ group for males are not used because of the problems with the LFS routing for the qualifications question above State pension age. In practice, to allow for the change in State pension age for females, qualification proportions have been projected in a separate workbook for ages 60-64. These projections are based on the changing patterns of qualification proportions with age over ages 50-59 for females.
7 A development for
future years work may be to match the spring immigrant data with the fourth quarter population data from the year before (e.g. immigrant qualification data for the second quarter of 2001 to be used alongside UK population data from the final quarter of 2000).
The historical qualifications data for
immigrants also exhibit problems because of small sample sizes. A series of interpolations and extrapolations were undertaken to overcome these issues. Details of precisely how this was done can be obtained from the authors on request.
Once the qualifications time series data have been constructed, the model first checks the historical qualifications proportions sum to 100 per cent to eliminate any rounding errors in the data. The (Excel-based) model then uses the FORECAST function with the data to carry out linear extrapolations of the historical trends over the period 2006-2020.8 This is done separately for non-migrant and immigrant groups, emigrant groups are assumed to have the same qualification profile as the UK population as a whole (therefore the ‘non-migrant’ qualifications proportions are used for emigrants in later calculations).
Where projections of qualification proportions are undertaken as part of the model these are constrained to lie in the range 0 to 100 per cent (i.e. any negative proportion is set equal to zero and any projected proportion over 100 is set to 100). In addition, where the qualifications proportions with different attributes should sum to 100 per cent, they are constrained to do so (e.g. the percentage with no qualifications through to the
percentage of those with NQF5 sum to 100). The forecasted qualifications proportions for each of the non-migrant, emigrant, and immigrant groups are then multiplied by their corresponding population forecasts. By subtracting the estimates for immigrants and emigrants (broken down by level of qualification) cumulative net migration forecasts are achieved. These are then added back with the forecast qualification figures for the population without migration.
In the final stage of the forecasts the model checks that there are no negative estimates for qualifications amongst the population, and ensures that the estimates of the numbers of individuals with different levels of qualifications sum to the population as a whole.
The resulting forecasts are those used for the UK’s 2020 anticipated qualification mix in the Ambition 2020 report (Ambition 2020, tables 4.3-4.6) for 19-64 year olds. As the model is disaggregated by age, the qualifications for adults aged 25-64 were also extracted and used in Ambition 2020
to rank the UK position against other OECD countries (Ambition 2020, table 4.1). The 2020 qualifications mix for the individual UK nations were derived using a simpler method, described briefly below in section 3.4.
8 Predicted values for
3.4 FOUR NATION FORECASTS As noted earlier the four nation forecasts for qualifications used within Ambition 2020 are derived on a simpler basis compared to the UK qualifications model. The basics however are the same as the UK-wide model, including:
Qualifications levels are used as a proxy for skills levels.
The same six qualifications levels are used (see table 3.1).
LFS quarter four data is used to construct the historical time series.
Qualifications levels are derived from the LFS using the same method as the UK-wide model.
The historical time period covered by the LFS data in the model is 1998 to 2007. The projections are based on a continuation of the long-term qualifications trend (1998– 2007) within each UK nation. The time series information relates to the share of each qualification level held by each nation state (e.g. the share of those with no qualifications located in England, the share located in Wales, etc.). Thus, the shares always sum to 100 per cent for the UK for each level of qualification. These shares are very stable over time, although there are some marginal changes over the ten year historical period as a whole.
These shares by qualifications level for individuals aged 19–64 are then projected forward to 2020. The model is based within Excel as with the qualifications model, and the FORECAST function used to achieve the linear extrapolations. The forecasts are repeated for individuals aged 25-64, this gives 2020 projections for a comparable age range to the OECD international forecasts. As with the UK-wide qualification model the 4-nation results for 25-64 year olds were used to compare against the 2020 skills mix of OECD countries (Ambition 2020, table 4.1).
The development work for the 2010 work will look at the feasibility of extending this model to make the 4-nation forecasts more sophisticated, and in-line with the UK-wide approach described earlier in this chapter.
3.5 FUTURE wORK
This chapter has outlined the background to the qualifications model, underlying assumptions, data considerations, and the approach used. Various areas for future development have been highlighted within this chapter to help mitigate some of the data issues with the qualification model and generally improve its functioning. Further developments we are looking to implement, not mentioned previously, include examining future economic activity rates by level of qualification, forecasts for males and females separately, and a regional disaggregation. The UK Commission hopes to implement developments as far as possible in time for the 2010 publication of Ambition 2020, the areas for progress are summarised below:
Labour Force Survey Update: The re-weighted LFS data will be used for forecasts derived for the 2010 Ambition 2020 report.
Population forecasts: The model will be updated to use the 2008-based ONS population projections.
Scenarios: The models could be extended to be used for scenario testing, for example exploring the sensitivity of the forecasts to alternative migration scenarios, and looking at what the impact would be if the assumptions about LFS under-reporting were realised.
Migration: Work to consider whether the models can be extended and improved with supplementary information on migration flows. And investigating whether it is more robust to match the second quarter LFS data with the previous year’s fourth quarter population data.
UK Nations: the development work for 2009–10 will explore whether a more in-depth approach could be taken to achieve the 4-nation 2020 qualification forecasts.
Regional disaggregation: resources permitting we hope in 2010 to develop 2020 qualification forecasts for the English regions.
Male and female qualification estimates: The workbook has the potential to provide different estimates for males and females to 2020, this element may be further developed for the 2010
Ambition 2020 report.
4
Functional literacy and numeracy are defined within the literature as:
Functional literacy is defined as Level 1 English; this is equivalent to GCSE English at Grade G. It represents the level of literacy needed to function in everyday life. Functional numeracy is defined as
Entry Level 3 Mathematics; this is less demanding than GCSE Mathematics at Grade G.
The level of literacy skills required to be “functional” is higher than that for numeracy, Moser (1999, p103-104) notes that higher levels of literacy are required more often than higher numeracy, both in everyday life and in the workplace. Those with low levels of literacy are less likely to be in full-time employment than those with higher levels, whilst only those with very low numeracy skills are thought to have difficulty maintaining employment. Box 4.1 notes how basic skills are measured.
The Basic Skills Model
BOx 4.1 DEFINING AND MEASURING BASIC SKILLS
The UK uses five levels to measure literacy and numeracy skills: Entry Levels 1, 2 and 3, Level 1 and Level 2. The Moser Report (1999) identified Level 1 literacy and Entry Level 3 numeracy as the standards necessary to function at work and in society in general. An example of an Entry Level 3 numeracy skill is being able to add or subtract money using decimal notation, or being able to work with fractions.
Surveys, like the Skills for Life Survey conducted in 2003, assess people’s basic skill levels using a variety of literacy and numeracy problems corresponding to the five levels described above. In 2003, 16% of the working-age population in England, over five million people, lacked Level 1 literacy skills and 21% (6.8 million) lacked Entry Level 3 numeracy skills. More than 15 million people in England lacked Level 1 numeracy skills, equivalent to a GCSE Maths pass at grades D–G.
International surveys, such as the OECD’s International Adult Literacy Survey and the more recent Adult Literacy and Life Skills Survey, use similar techniques to the Skills for Life Survey. They show that, while many other countries have a large number of adults with low basic skills, the UK lies in the bottom half of the OECD. Sweden had the lowest proportion of adults who had less than the equivalent of UK Level 1 literacy at just 7.5% in 1994, (compared with 21.8% in the UK in 1996) and just 5% of 26 to 35 year olds.
Source(s): Leitch (2006, Box 2.1, p.43) 4.1 INTRODUCTION
The qualifications model was based on the qualification framework and as such cannot easily incorporate changes in attainment of basic skills, therefore the modelling work for future basic skills attainment is done separately. The basic skills model projects trends in the proportions of working-age population without functional literacy (Level 1) and numeracy (Entry Level 3) in the UK by 2020. The model is designed to illustrate and compare different trajectories, given current trends and alternative policies, of the proportion of working-age people with poor literacy and numeracy skills.
There are two principal data sources available for measuring post-15 literacy and numeracy – GCSE Maths and English acquisition and the Skills for Life survey. However there are issues with these:
These two measures do not agree with each other on the level of basic skills. The Skills for Life survey has not been
updated since 2003, which limits the extent to which the projections can be updated to those used in Leitch. To lessen the impact of these issues, two variants of the model have been run giving the worst- and best-case scenarios. The Basic Skills Model makes projections of the future stock of people of working age who lack functional literacy or numeracy skills (Level 1 English, and Entry Level 3 Mathematics), the model used for the results published in the 2009 Ambition 2020 report is based upon the earlier version used by the Leitch Review.
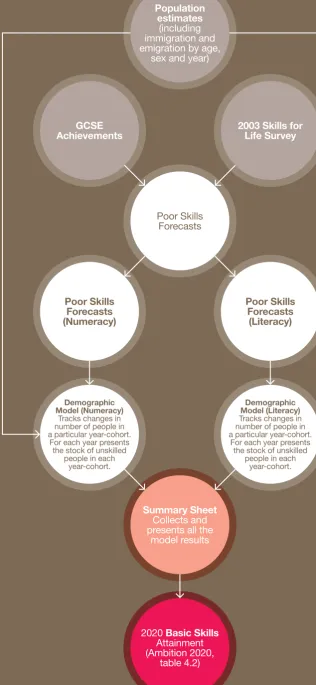
4.2 BASIC SKILLS MODEL OvERvIEw
Figure 4.1 below gives an overview of the current basic skills modelling work (the ‘baseline model’), The pictorial representation shows how the model and data used for the basic skills model link together to produce the basic skills forecast for this year’s
Ambition 2020 report.
Ambition 2020
Outcome
Data
Population estimates
(including immigration and emigration by age,
sex and year)
GCSE
Achievements 2003 Skills for Life Survey
2020 Basic Skills Attainment (Ambition 2020,
table 4.2)
Basic Skills
Forecasting
Model
Poor Skills Forecasts
(Literacy)
Demographic Model (Literacy)
Tracks changes in number of people in a particular year-cohort.
For each year presents the stock of unskilled
people in each year-cohort.
Poor Skills Forecasts
Poor Skills Forecasts (Numeracy)
Demographic Model (Numeracy)
Tracks changes in number of people in a particular year-cohort.
For each year presents the stock of unskilled
people in each year-cohort.
Summary Sheet Collects and presents all the
[image:30.595.171.488.52.739.2]model results
4.3 DATA SOURCES: BASIC SKILLS BASELINE MODEL
The current baseline model for projecting basic skills uses three main data sources:
ONS population projections; 2003 Skills for life survey data; GCSE attainments.
As with the qualifications model the basic skills model uses ONS 2006-based population projections. The projections are stratified by age at last birthday at mid-year for the working-age population (ages 16-64) and are inclusive of net migration. Further discussion relating to the population projections can be found in the qualifications model chapter.
The results of the Skills for Life Survey are also used as a data source in the basic skills modelling exercise to estimate the level of poor skills within the working-age population (DfES, 2003). These provide a breakdown of the proportion of functionally numerate and literate individuals in the UK population broken down by year of age in 2003. This survey took an empirical approach to assessing the skill set of the English population: a sample of the public was assessed using specially-designed tests for literacy and numeracy. These results were then mapped onto qualification levels (critically, for this purpose, Level 1 and Entry Level 3, respectively). This can be contrasted to an approach based on the use of qualifications data where possession of a particular qualification is assumed to equate to possession of a particular skill level. In a minority of cases, the Skills for Life Survey noted a mismatch between assessed skill levels and qualifications actually possessed by respondents (DfES, 2003, p.21). It was not possible to assess whether this was due to deskilling or to other factors9.
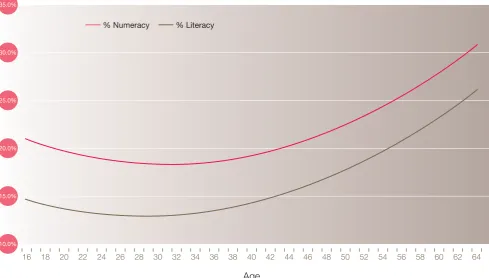
The level set for non-literacy is below Level 1 and for non-numeracy is below Entry Level 3, which correspond to the way in which the targets are set for 2020.10 It can be seen in figure 4.2 that, despite setting a lower level for numeracy the proportion of non-numerate exceeds that of non-literate for every year of age from 16 to 64.
It is also worth noting that the Skills for Life Survey only covers England, and results are scaled up to give UK estimates. In 2004, the Welsh Assembly Government conducted a similar survey to Skills for Life in Wales (Williams and Kinnaird, 2005). It was not possible to use these data to improve the estimates for 2003 because the published data were not available in sufficient detail. However, a key conclusion of the study was that skills levels in Wales were poorer than those in England (Williams and Kinnaird, 2005, p.19-20). This suggests that it is not entirely appropriate to apply English data (from the Skills for Life Survey) to the UK. We acknowledge that this approach to the data is a limitation of the current model but note also that: England makes up more than 80% of the UK population and, therefore, for the Welsh data to impact the English data significantly would require the level of poor skills to be very much higher than for England; and data for Scotland and Northern Ireland, were it available, may offset the Welsh data.
91 The survey’s
conclusions for literacy have since been the subject of a critique prepared for the Basic Skills Agency by Thomas Sticht (Sticht, 2003) which argued that it does not have construct validity because there was ‘considerable ambiguity about what skills and knowledge are actually being assessed’.
10 Details of the
4
In addition to the Skills for Life Survey, GCSE attainments are also used within the basic skills model. Having constructed data for the proportions with poor skills for each of the age cohorts that were working in 2003 using the Skills for Life Survey, it is then necessary to make estimates for cohorts that joined the working-age population between 2004 and 2008. This is done through the use of GCSE data for England.
GCSE achievement is used because it is a measure of the achievement of school leavers which is the cohort of interest. The disadvantage of this measure is that GCSE data does not formally measure functional numeracy and literacy on the same basis that Skills for Life did11; further, for numeracy GCSE is a measure at a higher level than functional numeracy.
11 As reflected in the fact
that the proportion failing to achieve a GCSE is much lower than the proportion of poor skilled derived from the Skills for Life Survey.
% Numeracy % Literacy
[image:32.595.76.566.199.477.2]Age
Figure 4.2: Proportion of population below functional literacy and numeracy levels, 2003
Source: Based upon data from the Skills for Life Survey (DfES, 2003)
35.0%
10.0% 30.0%
25.0%
20.0%
15.0%
12 The Scottish
Qualifications Authority (SQA) is a member of the JCQ but Scotland is the only part of the UK where GCSEs are not a part of the secondary education system (the equivalent qualification is Standard Grade).
13 Published under the
title GCSE, Entry Level and GNVQ Results. See for example JCQ (2007).
Other data sources were reviewed and assessed in earlier development work on the forecasting models undertaken by Cambridge Econometrics (SSDA, 2008). This work identified that one possible data source covering the GCSE attainment would have been data published by the Joint Council for Qualifications (JCQ) – a body which consists of the examining authorities from all parts of the UK12. It publishes GCSE pass rates by subject and grade for England, Wales and Northern Ireland13. The work identified the key problem with using these data is that they only provide information only for candidates who have sat the exam. A sizeable component of the proportion of the unskilled population is those who do not sit the exam. Improvements in skills levels will be captured in part by more students sitting the exam. Another problem is that the results are for students sitting the exam at any age (including, for example, young people retaking the exam in their late teens and early 20s). This will also tend to mask the true trend of interest: in the years for which JCQ data have been examined (2001-2007) there was no discernable trend in the success rate at Grade G in Mathematics and English. Thus the data used for the modelling exercise for the 2009 Ambition 2020 report are the GCSE results over the period 1994 to 2008, broken down by proportion of 15 year olds taking the examinations and their level of performance (i.e. A-C grade, D-G grade and below G) in the examination. It is assumed that those who do not take the exam would fail it and, thus, the number of individuals below Level 1 is the number who do not take the exam plus those who achieve below grade G. This is converted into a proportion of the whole 15 year old cohort.
4.4 THE BASIC SKILLS MODEL IN-DEPTH
4.4.1 DEMOGRAPHIC SUB-MODEL The baseline scenario for both numeracy and literacy is driven by a demographic sub-model, which tracks changes in the number of people in a particular year-cohort. The key assumption in the basic skills model is that a fixed proportion of each cohort lacks basic skills for the entire working life of the cohort. Changes in the total stock of those with basic skills can only arise therefore from the entry or exit of a cohort from the working population or a change in the size of a cohort.
The demographic sub-model uses the ONS population projections. It is possible using such projections to follow the projected size of a year-cohort through time. A year-cohort, for this purpose, is defined as a group of people in the population who were all 15 at last birthday at mid-year in the same year. For example, everyone born between mid-year 2007 and mid-mid-year 2008 will be in the same age cohort as they will all be 15 at last birthday at mid-year in 2022. Changes in the size of a year-cohort can only arise due to the following factors: death of members of the cohort before age 65; or net migration into or out of the cohort.
Over time some year-cohorts will leave the working-age population (as they reach age 65) and new cohorts will enter (as they reach age 15).
4
Sufficient conditions for this to be the case are: people are equally likely to die whether or not they are unskilled; people are equally likely to emigrate whether or not they are unskilled; and the inflow of migrants to a particular age cohort has the same proportion of unskilled as the year-cohort had on its entry to the working age population. An equally sufficient condition is that changes in the proportion from one of the three causes above are offset by one another (for example, the immigration of skilled migrants may be offset by the emigration of skilled residents).
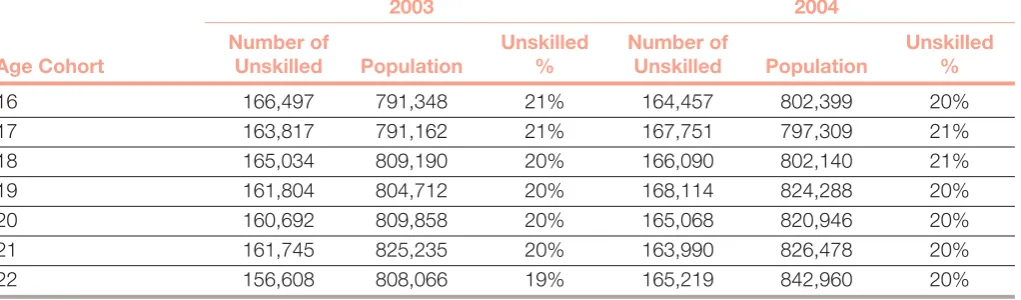
Table 4.1 shows a sample of the
demographic model for numeracy. For each year, the worksheet presents the stock of unskilled people in each year-cohort, the population and the unskilled proportion. The unskilled proportions (%) are derived separately (see section 4.4.2 on “Poor skills”). The stock is equal to the unskilled proportion multiplied by the population. At the bottom of the worksheet (not shown), stock and proportions figures are presented for each year; these results feed into the model results (‘summary’ worksheet).
2003 2004
Number of Unskilled Number of Unskilled
Age Cohort Unskilled Population % Unskilled Population %
16 166,497 791,348 21% 164,457 802,399 20%
17 163,817 791,162 21% 167,751 797,309 21%
18 165,034 809,190 20% 166,090 802,140 21%
19 161,804 804,712 20% 168,114 824,288 20%
20 160,692 809,858 20% 165,068 820,946 20%
21 161,745 825,235 20% 163,990 826,478 20%
22 156,608 808,066 19% 165,219 842,960 20%
[image:34.595.59.570.383.533.2]Source: GAD Population estimates, and Ambition 2020 poor skills forecasts (using the 2003 Skills for Life Survey and GCSE attainment data). Table 4.1: Extract from the demographic model (numeracy)
4.4.2 POOR SKILLS
As indicated above, the calculation of poor skills flows into the demographic model providing the proportion of each age cohort over time expected to have poor skills (i.e. unskilled % in table 4.1). These proportions are derived using results from the 2003 Skills for Life survey which give a baseline poor skills level for numeracy and literacy in each year-cohort for 2003.
14 If Appreciating Skills is set to 1, the following rule is applied: If the immediately older year-cohort has a lower proportion of unskilled in its white cell, that proportion is used; otherwise the ‘starting’ proportion entered for the year-cohort (in its white cell) is used. If Depreciating Skills is set to 1 (and Appreciating Skills is set to 0), the following rule is applied: If the immediately older year-cohort has a higher proportion of unskilled, that proportion is used; otherwise the ‘starting’ proportion for the year-% Unskilled (Numeracy)
Year Cohort 2003 2001 2005 2006 2007 2008
A B C D E F G
Extract from top of worksheet
1955 31%
1956 30% 30%
1957 29% 29% 29%
1958 29% 29% 29% 29%
1959 28% 28% 28% 28% 28%
1960 27% 27% 27% 27% 27% 27%
Extract from bottom of worksheet
2003 21% 21% 21% 21% 21% 21%
2004 20% 20% 20% 20% 20%
2005 20% 20% 20% 20%
2006 19% 19% 19%
2007 19% 19%
2008 18%
[image:35.595.35.539.202.466.2]2009
Table 4.2: Extract from poor skills forecasts (numeracy)
Source: Forecasts based upon 2003 baseline data from 2003 Skills for Life Survey, and DCSF GCSE attainment data.
At the bottom of the poor skills forecast table 4.2, new cohorts entering the working age population enter into the model. The orange cells need to be populated with the expected levels of innumeracy (or illiteracy). These cells can be based on projected GCSE attainment, or 2003 levels carried forward (see discussion in section 4.4.3).
The brown-shaded cells represent combinations of year-cohorts and years which are not valid as the cohort is not in the working-age population yet.
4
Boys Girls Total Linear (Boys) Poly. (Girls) Poly. (Total)
Per
[image:36.595.60.567.445.695.2]cent of 15 year old cohort
Figure 4.3: Trends in below Level 1 GCSE English, England
Source: The data were compiled from a series of GCSE result tables published by DCFS.
The latest is: www.dcsf.gov.uk/rsgateway/DB/SFR/s000768/revisedGCSE2008additionaltablesv2-2.xls
Note: Data relates only to those who have sat the GCSE English exam.
16.0
12.0 14.0
10.0
8.0
6.0
4.0
2.0
0.0
1994 1995 1996 1997 1998 1999 2000 2001 2002 2003 2004 2005 2006 2007 2008
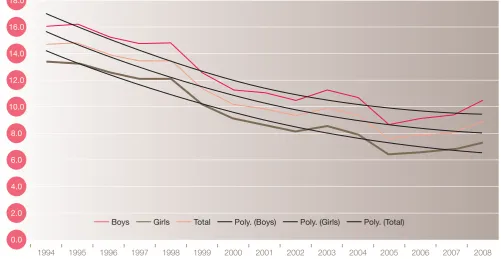
4.4.3 wORST AND BEST CASE SCENARIOS: USING GCSE DATA GCSE data can be used to populate the proportion of new year-cohorts expected to have below functional numeracy/literacy (inserted into the ‘poor skills’ worksheet demonstrated in table 4.2). However an important assumption in the current basic skills model is whether or not the literacy and numeracy levels of the new flow of individuals at age 16 will improve over the period to 2020. Recent trends in GCSE attainment do cast some doubt on this assumption as demonstrated in figures 4.3 and 4.4. As a result of these trends best and worst case scenarios were developed within the basic skills model.
Data for the proportion of the 15-year old cohort with below level 1 GCSE English (in England) between 1994 and 2008 are presented in figure 4.3. Quadratic trend lines have been fitted to the data. For literacy (GCSE English) the quadratic trend is very close to being linear, however at the end of the period (between 2007 and 2008) there is a slight increase in the proportions attaining below level 1 GCSE English. It is difficult to establish at this stage whether this is a “blip” in the data or the start of a new trend of increasing proportions attaining below Level 1 GCSE English (or in other words
decreasing proportions achieving above
A similar exercise for numeracy gives GCSE trends for below level 1 GCSE attainment in Mathematics between 1994 and 2008, fitting a quadratic trend line (figure 4.4). For Mathematics the upturn in the proportion with below level 1 attainment is more distinct, running from 2005 to 2008.15 That is, between 2003 and 2008 there were increasing propo