A National Statistics publication
National Statistics are produced to high professional standards set out in the National Statistics Code of Practice. They undergo regular quality assurance reviews
Statistical First Release
Special Educational Needs in England: January 2014
Reference SFR 26/2014 Date 4 September 2014 Coverage England
Theme Children, Education and Skills
Issued by Department for Education, Sanctuary Buildings, Great Smith Street, London SW1P 3BT Press office 020 7925 6789
Public enquiries 0370 000 2288 Statistician Adam Whitaker
Phone 0114 274 2458
Email [email protected] Internet Statistics: special educational needs (SEN)
17.9
The per cent of pupils in schools in England who have special educational needs (equating to 1,492,950 pupils). This has been decreasing since 2010 (21.1%) and is largely due to a decrease in SEN without a statement.2.8
The per cent of pupils in schools in England who have statements of SEN (equating to 232,190 pupils). This has remained at 2.8% since 2007 but the number of pupils with a statement decreased from 232,760 in 2007 to 223,945 in 2010 and then increased to 232,190 in 2014.20.6
The per cent of pupils with a statement of special educational needs, or at School Action Plus, who have the most common primary need - ‘Speech, Language and Communications Needs’.29,110
The number of statements made for first time in 2013. This has increased from 28,635 in 2012.
1.
Background and context
This statistical first release (SFR) brings together information on pupils with Special Educational Needs (SEN) and related information about special schools in England. The data was collected from schools and local authorities in January 2014 through the School Census and the SEN2 data return.
The SFR has data on the characteristics of pupils by their SEN provision together with information on the assessment and placement of pupils with new statements of SEN.
Pupils with SEN are currently categorised as follows:
School Action Extra or different help is given from that provided as part of the school’s usual curriculum
School Action Plus The class teacher and SEN Coordinator (SENCO) receive advice or support from outside specialists (a specialist teacher, an educational psychologist, a speech or language therapist or other health professionals)
Statement A pupil has a statement of SEN when a formal assessment has been made. A document is in place that sets out the child’s needs and the extra help they should receive
2.
Pupils with SEN in schools
(Tables 1A-1C) The number of pupilswith SEN continues to decline
The number of pupils with SEN decreased from 1.55 million pupils (18.7%) in 2013 to 1.49 million pupils (17.9%) in 2014. This is part of a continuing decline since 2010 when 21.1% of pupils had SEN.
Proportion of children with a statement of SEN remains at 2.8%
The proportion of pupils with a statement has remained around 2.8% since 2007. The number of children with statements of SEN slowly decreased from 2007 (232,760) to 2010 (223,945) and then slowly increased to 232,190 in 2014.
Number of pupils with SEN without a
statement have fallen
After a period increasing between 2007 and 2010, the percentage of pupils with SEN without statements has fallen for the fourth year in a row, from 18.3% in 2010 to 15.1% in 2014.
The continued decline in the number of children with SEN could be as the result of better identification of those children who have SEN and those who do not. This may have been as a consequence of the
Chart A: Proportion of pupils with SEN without a
statement falls whilst those with a statement shows no
change
3.
Type of Primary Need
(Table 10a)Coverage
Primary need is collected for those pupils at School Action Plus or with a statement of SEN. The figures below are for School Action Plus and statemented pupils but it should be noted that the distributions vary between these two groups.
State-funded primary schools
The three most frequent types of primary need were: Speech, Language and Communication needs with 31.6%; Moderate Learning Difficulty with 19.1%; and Behaviour, Emotional & Social Difficulties with 18.4%.
State-funded secondary schools
The three most frequent types of primary need were: Behaviour, Emotional & Social Difficulties with 26.7%; Moderate Learning Difficulty with 20.3%; and Specific Learning Difficulty with 15.6%,
Special schools The three most frequent types of primary need were: Severe Learning Difficulty with 24.8%; Autistic Spectrum Disorder with 22.5%; and Moderate Learning Difficulty with 17.2%
Chart B: Autistic Spectrum Disorder is the most common
primary need amongst pupils with Statements
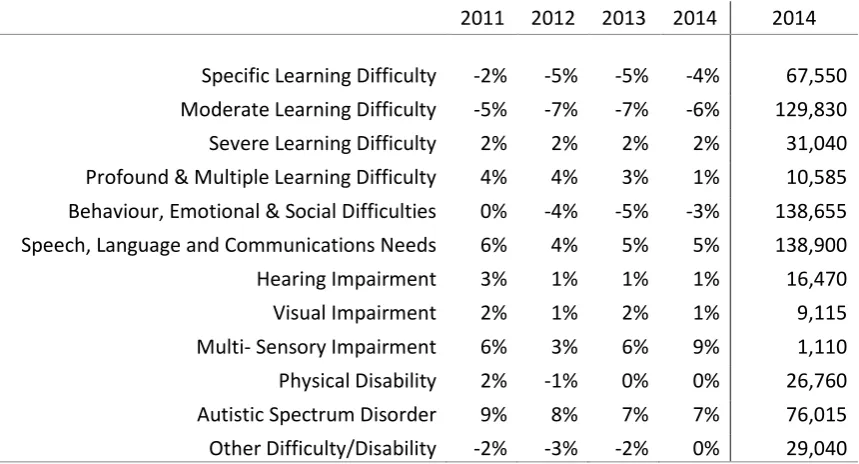
Table C: Number of SEN with specific and moderate
learning difficulties is decreasing
Year-on-year percentage change in number of pupils with a statement of SEN or school action plus by primary type of need
2011 2012 2013 2014 2014
Specific Learning Difficulty -2% -5% -5% -4% 67,550 Moderate Learning Difficulty -5% -7% -7% -6% 129,830 Severe Learning Difficulty 2% 2% 2% 2% 31,040 Profound & Multiple Learning Difficulty 4% 4% 3% 1% 10,585 Behaviour, Emotional & Social Difficulties 0% -4% -5% -3% 138,655 Speech, Language and Communications Needs 6% 4% 5% 5% 138,900 Hearing Impairment 3% 1% 1% 1% 16,470 Visual Impairment 2% 1% 2% 1% 9,115 Multi- Sensory Impairment 6% 3% 6% 9% 1,110 Physical Disability 2% -1% 0% 0% 26,760 Autistic Spectrum Disorder 9% 8% 7% 7% 76,015 Other Difficulty/Disability -2% -3% -2% 0% 29,040
Table C combines statistics from previous publications. The number of pupils with specific or moderate learning difficulties, and behaviour, emotional & social difficulties has been declining since 2010. The number of pupils with speech, language and communications needs and Autistic spectrum disorder has increased since 2010. Multi-sensory impairment has increased year-on-year but is still the smallest group.
[image:5.595.97.440.594.770.2]4.
Distribution of pupils with Statements of SEN
(Table 1a)Table D: Proportion of pupils with statements of SEN
attending maintained special schools continues to
increase
Pupils with statements of SEN by type of setting 2010 to 2014
SEN with Statements 2010 2011 2012 2013 2014
Maintained nursery 0.1% 0.1% 0.1% 0.1% 0.1% State-funded primary 25.8% 25.8% 25.9% 26.0% 26.2% State-funded secondary 28.8% 28.4% 27.7% 26.9% 25.7% Maintained special 38.2% 38.7% 39.0% 39.6% 40.5% Pupil Referral Units 0.9% 0.8% 0.7% 0.7% 0.7% Independent 4.2% 4.3% 4.7% 4.9% 5.1% Non-maintained special 2.0% 1.9% 1.9% 1.8% 1.7%
Table D shows previous trends are continuing in 2014. The proportion of pupils with statements of SEN attending maintained special schools and independent schools continue to increase slowly. The gradual increase in the proportion in state-funded primary schools and the gradual decrease in state-funded secondary schools is a reflection of general population trends.
5.
Age and Gender
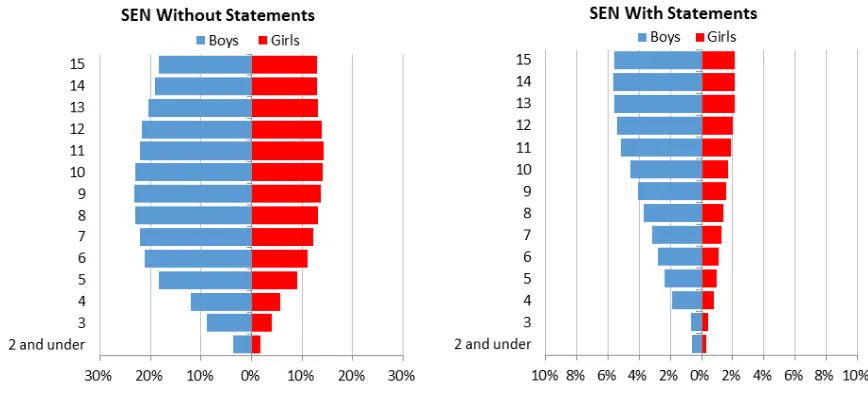
(Table 5d) SEN is more prevalentin boys
Across all age groups and school types: 19.2% of boys are SEN without statements compared to 11.4% for girls. This is down from last year when 20.2% of boys and 12.1% of girls had SEN without statements.
4.0% of boys have statements of SEN compared to 1.6% for girls. This remains unchanged from last year.
Older age groups are more likely to have statements of SEN
Pupils aged 2 and under are least likely to have a statement of SEN (0.5%) whilst those aged 15 at the 31 August 2013 are most likely to have a statement of SEN (3.9%).
Likelihood of having SEN without a
statement peaks in the mid age bands
The proportion of 9 and 10 year olds which have SEN without statements is 18.6%. This proportion decreases to 2.7% for the under-2-year-olds and decreases to 15.7% for 15-year-olds.
Chart E: Statements are more prevalent in older age
groups and SEN more prevalent in Boys
Proportion with SEN by age and gender in state-funded primary, state-funded secondary and special schools
[image:6.595.79.513.543.743.2]6.
Free school meal eligibility
(Table 7)Free school meals: who was entitled?
In England, children in state-funded schools were entitled to receive free schools meals if a parent or carer were in receipt of any of the following benefits:
• Income Support
• Income-based Jobseekers Allowance
• Income-related Employment and Support Allowance
• Support under Part VI of the Immigration and Asylum Act 1999
• the guaranteed element of State Pension Credit
• Child Tax Credit (provided they were not also entitled to Working Tax Credit and had an annual gross income of no more than £16,190, as assessed by Her Majesty’s Revenue and Customs)
• Working Tax Credit run-on - paid for 4 weeks after you stop qualifying for Working Tax Credit
• During the initial roll out of the benefit, Universal Credit (this category was added from 29 April 2013)
Chart F: Pupils with SEN more likely to be eligible for and
claim free school meals
7.
Ethnicity
(Table 8d) White-British pupils are more likely to have SEN than minority ethnic pupilsOverall, 3.2% of white-British pupils have statements of SEN compared to 2.8% of minority ethnic pupils. This remains unchanged from last year.
For SEN without statements, the figures are 16.5% and 16.1% respectively. This is down on last year as part of the general declined in SEN without statements.
However, there is significant variation between the minority ethnic groups
Table G1 below shows the variation across the ethnic groups.
Table G1: Most Asian groups are least likely to have SEN
Proportion and number with SEN by ethnic group (ordered lowest to highest on proportion)SEN with Statements % N SEN without Statements % N
Indian 1.8% 3,335 Chinese 8.9% 2,370 Any other White background 2.0% 6,340 Indian 9.5% 17,185 Chinese 2.1% 565 Any other Asian background 11.4% 12,750 Any other Asian background 2.3% 2,610 White and Asian 12.9% 9,445 White and Asian 2.4% 1,760 Bangladeshi 14.9% 16,480 Any other ethnic group 2.5% 2,595 Irish 15.4% 3,305 Bangladeshi 2.7% 2,995 Any other mixed background 15.5% 17,830 White and Black African 2.9% 1,175 Any other White background 15.8% 49,880 Pakistani 3.0% 8,295 White British 16.5% 797,335 Irish 3.1% 660 White and Black African 16.8% 6,710 White British 3.2% 154,660 Any other ethnic group 16.8% 17,740 Any other mixed background 3.2% 3,710 Black African 17.0% 39,400 Black African 3.2% 7,330 Pakistani 17.7% 48,230 Gypsy / Roma 3.6% 685 Any other Black background 19.5% 8,645 White and Black Caribbean 3.6% 3,410 White and Black Caribbean 20.6% 19,585 Black Caribbean 4.1% 3,660 Black Caribbean 23.4% 20,665 Any other Black background 4.1% 1,830 Gypsy / Roma 35.3% 6,625 Traveller of Irish heritage 4.9% 220 Traveller of Irish heritage 44.4% 1,995
Black pupils are more likely to have SEN
The proportion of black pupils with a statement of SEN is 3.5%, compared to 3.2% for white-British. Indian pupils are the least likely ethnic group to have a statement of SEN at 1.8%.
Indian and Chinese feature amongst the ethnic groups with the lowest prevalence of SEN
Indian and Chinese feature amongst the ethnic groups with the lowest prevalence of SEN. Amongst the ethnic groups with the highest prevalence of SEN are, Black Caribbean, Gypsy/Roma and Traveller of Irish heritage.
8.
First Language
(Table 9d) Prevalence of SENslightly lower for pupils whose first language is not English
Of the pupils whose first language is known to be, or believed to be English – 3.2% have a statement of SEN and 16.4% are SEN without a statement. This compares to 2.4% and 16.1% for pupils whose first language is known to be, or believed to be, other than English.
Prevalence of School Action is slightly higher for pupils whose first language is not English.
Of the pupils whose first language is known to be, or believed to be English – 10.1% are on school action. This compares to 10.8% for pupils whose first language is known to be, or believed to be, other than English.
Note:
9.
Newly made statements of SEN
(Tables 2, 3a)Note:
Information in the following sections is drawn from the SEN2 survey and is data collected from the local authorities who maintain the child’s statement of special educational needs. For this reason, the figures cannot be aggregated or directly compared with the previous sections.
In addition to children educated in schools, the SEN2 survey includes information on children with statements of special educational needs who are educated other than in school (for example where other arrangements have been made by the parents, the LA, the child may be permanently excluded or awaiting provision), or where a child living in England is educated across the border in Scotland or Wales.
1.6 per cent increase in children assessed
30,030 were assessed for special educational needs in 2013. This is up from 29,565 children in 2012 calendar year and 28,325 in 2011.
A similar 1.6 per cent increase in statements issued for the first time
29,110 (or 96.9% of those assessed) were issued with a statement for the first time. This is up from 28,635 children in 2012, but the proportion of those assessed remains the same at 96.9%
Most children with a newly issued statement are placed in
mainstream places in state-funded schools
Of the 29,110 children with a newly issued statement in 2013, most (61.2%) were placed in mainstream places in state-funded schools. This is down from 62.6% in 2012. The proportion in special schools has increased from 24.9% in 2012 to 26.4% in 2013.
Table H: Most children with a newly issued statement are
placed in mainstream schools
Children issued with a new statement issued in calendar year, by placement type.
2012 2013 All placements 100.0% 100.0%
10.
All children with statements of SEN
(Tables 2, 3b) Number of statementsmaintained by a LA is up 3,680 (1.6%) from last year
Figures for all children with statements of SEN (not just those in schools) show that the number of statements maintained by an authority has increased from 233,430 in January 2013 to 237,110 in January 2014.
Most children with a statement are in mainstream places in state-funded schools
Of the 237,110 children with statement s in January 2014, most (46.3%) are in mainstream places in state-funded schools. This is down from 47.3% in January 2013. The proportion in special schools has increased from 43.5% in January 2013 to 44.4% in January 2014.
Table I: Most children with a statement are in mainstream
schools
Children with a statement in January, by placement type.
2013 2014 All placements 100.0% 100.0%
11.
Discontinuation of statements of SEN
(Table 2)Definition: Child leaves compulsory education
Children with statements who stay on to school sixth forms have left compulsory education in the sense that they are over compulsory school age but most of them will continue to have statements and may not be counted as “Child left education”. Children with statements who transfer to further education establishments will still be in education but won’t have statements.
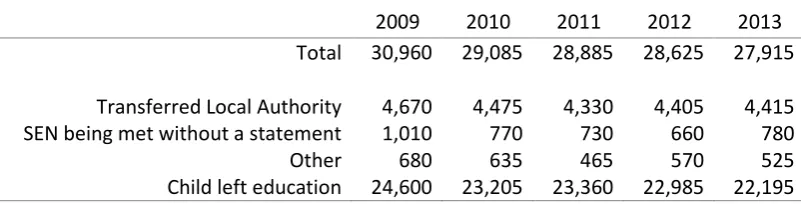
Most statements end because the child leaves compulsory education
22,195 statements ceased due to the child leaving compulsory education in 2013. This is around 9.5% of the 223,430 statements in place in January 2013.
Relatively few children have their statement discontinued following a review
Excluding local authority transfers and compulsory school leavers, around 1,305 (0.56%) of the 223,430 statements in place in January 2013 were reviewed and discontinued.
Table J: Most statements end due to child leaving
education
Statements discontinued in calendar year, by reason
2009 2010 2011 2012 2013 Total 30,960 29,085 28,885 28,625 27,915
[image:12.595.80.481.442.544.2]12.
Statements of SEN issued within 26 weeks
(Tables 27, 28)Time limits for issuing statements:
The whole process from when the local authority receives a request for an assessment or informs the parents that it is considering an assessment to issuing the final statement should take no longer than 26 weeks.
The 26 week period is made up of:
• 6 weeks from when the local authority receives the parental, school or setting request for an assessment, or informs the parent that it is thinking of carrying out an assessment, until the decision whether to assess or not;
• 10 weeks in which to carry out the assessment and decide whether to draw up a statement, including 6 weeks for the local authority to seek and receive advice;
• 2 weeks in which to draw up a proposed statement; and
• 8 weeks to finalise the statement.
The 2001 Regulations allow for the following exceptions to these time limits. These are set out at Regulations 12(5), 12(7), 12(9) and 17(4). This publication reports two measures: the proportion of statements issued in 2013 within the 26 week limit excluding exception cases; and the proportion of all statements issued in 2013 within the 26 week limit.
90% of statements issued in 2013 were within the 26 week limit (excluding exception cases)
Excluding exception cases there were 19,890 statements issued in 2013 and 17,845 (90%) of these were issued with 26 weeks.
The 90% is unchanged from last year’s figures which covered April 2012 to March 2013.
82% of all statements issued in 2013 were within the 26 week limit
Of all the statements issued (i.e. including exception cases) there were 29,085 in 2013 and 23,780 (82%) of these were issued with 26 weeks.
13.
List of tables
The following tables are available in excel format on the department’s statistics website:
Special Educational Needs Statistics.
All tables relate to England and are at January 2014 unless otherwise stated.
Pupils with SEN
1A All schools: Pupils with statements of SEN, January 2007 to 2014
1B All schools: Pupils with SEN without statements, January 2007 to 2014
1C All schools: Pupils with SEN, January 2007 to 2014
1D Academies: Pupils with SEN, January 2014
Statements maintained by the local authority
2 Education arrangements, assessment and
placement of children for whom local authorities maintain a statement of SEN. 3A Assessment and placement of children with
new statements of SEN, 2008 to 2012 3B Placement of children with a statement
maintained by the local authority, 2009 to 2013
SEN by school type
4A State-funded primary schools: Number of schools by percentage of pupils with SEN by region
4B State-funded secondary schools: Number of schools by percentage of pupils with SEN by region
SEN by age and gender
5A State-funded primary schools: Number of pupils with SEN by age and gender
5B State-funded secondary schools: Number of pupils with SEN by age and gender
5C Special schools: Number of pupils with SEN by age and gender
5D State-funded primary, state funded
secondary and special schools: Number of pupils with SEN by age and gender
Pupils with SEN by national curriculum year group 6A State-funded primary schools: Number of
pupils with SEN by national curriculum year group
6B State-funded secondary schools: Number of pupils with SEN by national curriculum year
6C Special schools: Number of pupils with SEN by national curriculum year group
6D State-funded primary, state funded
secondary and special schools: Number of pupils with SEN by national curriculum year group
Pupils with SEN claiming free school meals
7 State funded primary, state funded
secondary and special schools: Number and percentage of pupils known to be eligible for and claiming free school meals by SEN provision
Pupils with SEN by ethnic group
8A State-funded primary schools: Number of pupils with SEN by ethnic group
8B State-funded secondary schools: Number of pupils with SEN by ethnic group
8C Special schools: Number of pupils with SEN by ethnic group
8D State-funded primary, state-funded
secondary and special schools: Number of pupils with SEN by ethnic group
Pupils with SEN by first language
9A State-funded primary schools: Number of pupils with SEN by first language
9B State-funded secondary schools: Number of pupils with SEN by first language
9C Special schools: Number of pupils with SEN by first language
9D State-funded primary, state-funded
secondary and special schools: Number of pupils with SEN by first language
Number and percentage of pupils by primary need
10A State-funded primary, state-funded
secondary and special schools: Number of pupils by type of need
10B Academies: Number of pupils by type of need
11 Special schools: Number and percentage of pupils attending special schools, January 2009 – 2013
12 Special schools: Types of provision for which schools have been approved
13A Special schools: Number of schools by size 13B Special schools: Number of pupils by the size
of their school
List of additional tables – Local Authority data
All tables relate to England and are at January 2014 unless otherwise stated.
Pupils with SEN, based upon where the pupil attends school
14a All schools: Pupils with SEN, based on where
the pupil attends school, January 2007 to 2014
14b All schools: Pupils with SEN without a statement, based on where the pupil attends school, January 2009 to 2014 15 State-funded primary schools: Number of
pupils with SEN, based on where the pupil attends school
16 State-funded secondary schools: Number of pupils with SEN, based on where the pupil attends school
17 All schools: number of pupils with special educational needs (SEN), based on where the pupil attends school
Pupils with a statement maintained by the local authority
18 Number of pupils with a statement maintained by each local authority, 2009 to 2013
19 Assessment and placement of children with new statements of SEN during 2012
20 Maintained mainstream schools: Pupils for whom statements are newly made, 2008 to 2012
21 Placement of children with a statement maintained by each local authority
Pupils by type of need
22 State-funded primary schools: Number and percentage of pupils with statements of SEN or at School Action Plus by primary type of need
23 State-funded secondary schools: Number and percentage of pupils with statements of SEN or at School Action Plus by primary type of need
24 Special schools: Number and percentage of pupils with statements of SEN or at School Action Plus by primary type of need
Pupils with SEN attending SEN units or in resourced provision
25 State-funded primary schools: Number and percentage of pupils with SEN attending SEN units or placed in resourced provision 26 State-funded secondary schools: Number
and percentage of pupils with SEN attending SEN units or placed in resourced provision Statements issued within 26 weeks
27 Number of final statements of special educational needs issued within 26 weeks excluding exception cases.
List of additional tables – Figures by primary need
All tables relate to state funded primary, state funded secondary and special schools in England and are at January 2014.
Pupils with SEN, based upon where the pupil attends school
A Number and percentage of pupils with
special educational needs by gender and primary type of need
B1 Number and percentage of pupils with
special educational needs at school action plus by age and primary type of need
B2 Number and percentage of pupils with special educational needs with statements by age and primary type of need
C1 Number and percentage of pupils with special educational needs at school action plus by ethnic group and primary type of need
C2 Number and percentage of pupils with special educational needs with statements by ethnic group and primary type of need
D Number and percentage of pupils with
special educational needs by free school meal eligibility and primary type of need
E1 Number and percentage of pupils with special educational needs at school action plus by national curriculum year group and primary type of need
E2 Number and percentage of pupils with special educational needs with statements by national curriculum year group and primary type of need
F Number and percentage of pupils with
special educational needs with statements by first language and primary type of need G1 Number and percentage of pupils with
special educational needs at school action plus by primary type of need and secondary type of need
When reviewing the tables, please note the following:
We preserve confidentiality
The Code of Practice for Official Statistics requires we take reasonable steps to ensure that our published or disseminated statistics protect confidentiality.
So we round numbers Pupil numbers at national and regional levels have been rounded to the nearest 5. Pupil numbers of 1 or 2 have been suppressed. Where any number is shown as zero (0), the original figure was also zero. Where the numerator or denominator of any percentage calculated on pupil numbers is less than 3, this has been suppressed.
This suppression is consistent with the Departmental statistical policy which can be found at:
Departmental statistical policy.
And adopt symbols to help identify this
Symbols are used in the tables as follows:
. not applicable
14.
Data Sources
Information presented in this Statistical First Release is drawn from two sources: the school census and the SEN2 Survey.
School census The school census collects information from schools and records pupils with and without statements of SEN who are educated at the school, regardless of which local authority (LA) is responsible for the pupil. The SEN2 survey collects information from LAs on children with statements of SEN and new statements made in the previous calendar year. It records information on those children for whom the LA is responsible, regardless of whether they are educated in the LAs own maintained schools, in another LAs schools, in the non-maintained or independent sectors or educated outside of school. For this reason figures sourced from the school census and the SEN2 Survey are not directly comparable.
The school census has collected information from schools on pupils with special educational needs (SEN) on the census date in January since 1985. Figures for pupils with SEN without statements were collected from maintained primary and secondary schools for the first time in 1995.
Information for preparing and completing the school census, including the scope of the return, technical specifications and what data needs to be submitted to the Department for Education.
School census collection guide
SEN2 survey The SEN2 Survey has collected information on children with statements on the census date in January and new statements made in the previous calendar year from LAs since 1984.
15.
Want more?
Want previously published SEN figures?
They are still available via SFR links. The series of publications is available online at:
Statistics: special educational needs (SEN).
This web page also hosts the series Children with special educational needs: an analysis which contains key statistics on pupils with special educational needs including attainment, destinations, tribunal appeals, school absence and exclusions
Want to know more generally about schools and pupils and their characteristics?
We publish further information in the SFR Schools and pupils in England available at:
Statistics: school and pupil numbers.
Wales Welsh Assembly Government: Pupils with statements of Special Educational Needs (SEN):
Welsh Government: Pupils with statements of special educational needs (SEN)
Scotland Scottish Government: In Scotland there is different legislation and instead of having SEN they have pupils with Additional Support Needs (ASN). Information on this is included in the below publication.
Summary Statistics for Schools in Scotland.
School Education Statistics
Northern Ireland Department for Education, Northern Ireland: Special Educational Needs (SEN) pupils by Education and Library Board (ELB).
ELB
Special schools data.
School level data
Funded early years places for 2-, 3- and 4-year-olds
Additional tables have been added to the provision for children under 5 years of age statistical release which show the SEN provision breakdown for funded 2-year-olds and funded 3- and 4-year-olds.
16.
Got a query? Like to give feedback?
We would like to know more about our users and would encourage and welcome any feedback on how the data is used. Comments on any issues relating to this publication are also welcomed and encouraged. If you would like to be involved in future user engagement consultations then please do get in touch. Any enquiries should be addressed to the following:
If from the media Press Office News Desk, Department for Education, Sanctuary Buildings, Great Smith Street, London SW1P 3BT. 020 7925 6789
If non-media Please email us at: [email protected]
17.
Consultation
The DfE is considering splitting out the current SEN statistical first release into two separate releases so that we may report on the number of education, health and care plans (EHCPs) earlier in the year.
SEN2 statistical release The first part will contain information from the SEN2 survey and will report, for the first time, the number of education, health and care plans issued and maintained by local authorities.
The DfE expect to be in a position to publish from May 2015
School Census statistical release:
The second part will contain statistics from the school census and school level annual school census data.
The DfE expect to be in a position to publish from June or July 2015
Consultation questions
:1: Would you benefit from two separate publications as described above? 2: Would an earlier release of data on statements and EHCPs benefit you?
3: Would including basic SEN information in the schools and pupils characteristics statistical release (Statistics: school and pupil numbers ) benefit you?
4: Do you have any other comments or feedback which could help us improve these statistics in future?
How to respond:
Please send your answers to the consultation question to [email protected]
© Crown copyright 2014
You may re-use this information (excluding logos) free of charge in any format or medium, under the terms of the Open Government Licence. To
view this licence, visit Open Government Licence or e-mail:
Where we have identified any third party copyright information you will need to obtain permission from the copyright holders concerned.
This document is also available from our website at: