A network as a source of knowledge for the
education of an architect
Melis Baloglu Asut1, and Yüksel Demir1
1 Istanbul Technical University, Department of Architecture, 34367 Taşkışla, Şişli Istanbul, Turkey
Abstract. In a learning space, whether it is surrounded by digital tools or not, the way a tutor represents the information is usually in a linear fashion. However, e-learning platforms have already started to support the learner and a new paradigm for learning. In light of these thoughts and concerns, this paper is focused on the education of an architect and examines potential e-learning platforms including BlackBoard, Facebook in the case of an architectural course, EdX, and Khan Academy Knowledge Map based on the types of visual narrative, the aim of the platform, the information visualization quality, and data types. As an output, this study creates a comparative visualization to see and discuss the potentials of the tools for the education of an architect. After the analysis of e-learning platforms, this study concludes that (1) an education model based on a network can help architects to see the big picture, however it also causes data reduction and loss, (2) an education model based on a network allows architects to create their own learning paths and share it with their colleagues, (3) an education model based on a network may be a sustainable platform for architects from different experience levels and enhance the communication between them to support the youngers’ education, 4) an education model based on network decentralizes the process of learning and enriches it through the interaction between other learners, concepts, thoughts, and objects, (5) an education model based on network bridges the gap between what one already knows and what one needs to know to understand the whole picture, (6) an education model based on network gives the opportunity to compare previous years' feedbacks, concepts, and thought in one medium.
1 Introduction
In a learning space, whether it is surrounded by digital tools or not, the way a tutor represents the information is usually in a linear fashion. For example, a book is covered from the introduction to the conclusion, or a PowerPoint presentation can be shown from the first slide until the end. However, the instruction is becoming more learner-centered and nonlinear as a network where:
(a) the learner is aware of knowledge resources believed to be relevant for her/him, (b) the learner builds his/her knowledge together with the other members based on the
(c) the learner creates her/his personalized plan in the discussion groups.[1]
In such a network, the learner is the center of learning experience, not the teacher nor the institution. The environment is described as a networked learning environment. Networked learning refers to both network and learning. And also, networked learning tools refer to e-learning platforms, social media, forums, blogs, games and so on.
E-learning platforms and social media have already started to support the learner and a new paradigm for learning, working, studying and problem-solving is already defined by them. This new paradigm reflects the connectivity of people and learning sources [2] However, this new paradigm had also brought a new problem called “know-where”. Know-where basically means the understanding of Know-where to find data which data may be used as a knowledge source [3]. Although e-learning platforms support;
(a1) the awareness of knowledge sources like (a) Khan Academy Knowledge Map [4], but it can also create the situation called map shock since the map is big and if learners cannot filter or zoom the sources related [5] to their interest and relate one to another.
(b1) learners to build their knowledge with the interaction of other members like they do in EdX [6], but they cannot manipulate their research history with commands like undo, replay etc. [5]
(c1) learners to create their own personalized learning plan (c), like they do with the help of social media as Facebook. Social media allows users to learn, share and communicate with anytime and anywhere learning but learners cannot see the big picture or overview. [5] Social media platforms like Facebook, and an open source learning management software like Moodle, or a learning management software as BlackBoard may be stronger and more sustainable than e-learning platforms developed by formal education institutions. Having said that, social media was not designed to be an e-learning platform, it is used like a communication facilitator between learners. Each system has its own positive and negative effects for its users. But how do we know which kind of platform, what kind of visualization and narrative help an architect to learn continuously in a fast-changing world is the question of the digital world.
In light of these thoughts and concerns, this paper is focused on the education of an architect. How data should be structured and presented in e-learning platforms for the education of an architect is the question of this research. To be able to answer the research question, this study is examined potential e-learning platforms including social media for the education of an architect based on the types of visual narrative [7]; the aim; the information visualization mantra for interactivity [5]; data types as 1D, 2D, 3D, network, etc. [5]; and Edward Tufte’s writing about the visual communication of information under the topics of scale, color etc. [8] and finally it creates comparative visualizations. As a conclusion for this study, a network can be seen as an environment to support know-where. In a network, there is no center; there are just nodes and relations between them. And if the tools to produce information are readily available to any member of society, the question of “who is an expert” may yield entirely different responses than in more hierarchical, structured ones [9]. In such a society, an architect can tease out the data from the big picture/data and can find the data s/he needs where the network visualization assists her/him.
As an outcome, this study proposes a model for the education of an architect. After analysis of e-learning platforms and social media, this study concludes that (1) an education
model based on a network can help architects to see the big picture however it also causes data reduction and loss, (2) an education model based on the network allows architects to create their own learning paths and share it with their colleagues, (3) an education model based on the network may be a sustainable platform for architects form different experience levels and enhance the communication between them to support the youngers’ education. Since knowledge construction is a unique process and everyone has their own way to interpret information in relation to their personal experience, desires, and hopes [10], in a network anyone can see the one's unique learning process, (4) an education model based on network decentralizes the process of learning and enriches it through the interaction between other learners, concepts, thoughts, and objects, (5) an education model based on network bridges the gap between what one already knows and what one needs to know to understand the whole picture, (6) an education model based on network gives the opportunity to compare previous years' feedbacks, concepts, and thought in one medium.
2 Network, Network Society, and Networked Learning
When we refer to networked learning, we refer to both network and learning. For this reason, this section introduces the network society and the features of its network. Modes of production bring new tools that bring new ways of communication that bring new way of daily life. Nowadays, people can take their personal computers and go wherever they want to study or work. In a such a daily life, there is a network between people and people, tools and tools, tools and people and people and tools. This network is a set of interconnected nodes. A node is a point where the curve intersects itself. A network has no center, just nodes. All nodes are necessary for the network performance. When nodes become redundant or useless, networks tend to reconfigure themselves, deleting some nodes, and adding new ones. [9] Between the nodes in the network and those outside the network, distance is infinite, since there is no access unless the program of the network is changed. Networks became more efficient in terms of their organization as a result of three major features. They are flexibility, scalability, and survivability.
• Flexibility: they can reconfigure according to changing environments, keeping their goals while changing their components. They go around blocking points of communication channels to find new connections.
• Scalability: they can expand or shrink in size with little disruption.
• Survivability: because they have no center, and can operate in a wide range of configurations, they can resist attacks to their nodes and codes, because the codes of the network are contained in multiple nodes, that can reproduce the instructions and find new ways to perform. So, only the material ability to destroy the connecting points can eliminate the network [9].
design and during the design process, they use online libraries, they share their representations online. That is why, the hacker ethics is a way to discuss the rules of online communities, licenses and sharing however this topic is not the main issue of this paper.
Networked learning integrates both the new movements and is based on existent learning
theories as it consists of building blocks from (1) connectivism, highlighting the relevance of connections for learning, (2) social network analysis, pointing out the different types of
connections and their implications for learning, and (3) Collaborative Learning Theories, based on constructivism [12]. Networked learning is learning in which information and
communications technology (ICT) is used to promote connections: between one learner and other learners, between learners and tutors; between a learning community and its learning resources [13]. Networked learning has been described as involving learning situations in which collaboration and participation are mediated via technologies [14]. In this study, while
it is referred to networked knowledge, it is not only about connecting textual content but
connecting different media like video, and audio content, images, and documents. The term “networked knowledge” exemplifies several important facets of knowledge. First, in a “knowledge society”, knowledge needs to be connected in order to generate new knowledge or innovation, which can be realized by Semantic Web technologies. Second, knowledge also
needs to be shared among people in order to be used effectively, and much of this sharing is based on collaboration, social software, and social networks. And third, knowledge is never
isolated but always embedded in a context, connected with other Information [15]. It is
important to examine the features of tools used or to be used in networked learning since
network society and its demands have been changing according to fabrication and
communication technologies and the culture that they are affecting.
2.1 Networked Learning and Tools and Technologies
Mobile, personal, voice-enabled multifunctional devices such as laptops, tablets, and
smartphones have made it possible to participate in networked learning 24/7 from almost any location, including in workplaces, home, the bus and the street [14]. According to the
Networked learning 2018 report, it is visible that: (a) Learning management systems (i.e.
Blackboard, Firstclass, WebCT, Moodle, Fronter) decline, (b) MOOCs seem to follow a
wider cultural trend of becoming excessively popular after 2012, following the rise of platforms, such as Coursera, and EdX, (c) YouTube protects its place, but research needs to be done in the field of architecture since students usually watch tutorials from YouTube to learn how to use software, (d) The popular use of Twitter can be understandable in two ways.
[image:4.482.80.406.547.620.2]Firstly, most people use their smartphones with them during the day and Twitter is a simple tool to follow from a small screen, (e) Regarding the use of digital devices by learners, the term laptop is declining, however, the terms phone and mobile are increasing (See Figure 1.)
design and during the design process, they use online libraries, they share their representations online. That is why, the hacker ethics is a way to discuss the rules of online communities, licenses and sharing however this topic is not the main issue of this paper.
Networked learning integrates both the new movements and is based on existent learning
theories as it consists of building blocks from (1) connectivism, highlighting the relevance of connections for learning, (2) social network analysis, pointing out the different types of
connections and their implications for learning, and (3) Collaborative Learning Theories, based on constructivism [12]. Networked learning is learning in which information and
communications technology (ICT) is used to promote connections: between one learner and other learners, between learners and tutors; between a learning community and its learning resources [13]. Networked learning has been described as involving learning situations in which collaboration and participation are mediated via technologies [14]. In this study, while
it is referred to networked knowledge, it is not only about connecting textual content but
connecting different media like video, and audio content, images, and documents. The term “networked knowledge” exemplifies several important facets of knowledge. First, in a “knowledge society”, knowledge needs to be connected in order to generate new knowledge or innovation, which can be realized by Semantic Web technologies. Second, knowledge also
needs to be shared among people in order to be used effectively, and much of this sharing is based on collaboration, social software, and social networks. And third, knowledge is never
isolated but always embedded in a context, connected with other Information [15]. It is
important to examine the features of tools used or to be used in networked learning since
network society and its demands have been changing according to fabrication and
communication technologies and the culture that they are affecting.
2.1 Networked Learning and Tools and Technologies
Mobile, personal, voice-enabled multifunctional devices such as laptops, tablets, and
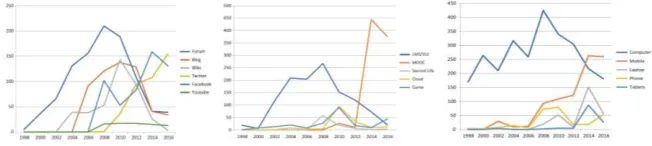
smartphones have made it possible to participate in networked learning 24/7 from almost any location, including in workplaces, home, the bus and the street [14]. According to the
Networked learning 2018 report, it is visible that: (a) Learning management systems (i.e.
Blackboard, Firstclass, WebCT, Moodle, Fronter) decline, (b) MOOCs seem to follow a
wider cultural trend of becoming excessively popular after 2012, following the rise of platforms, such as Coursera, and EdX, (c) YouTube protects its place, but research needs to be done in the field of architecture since students usually watch tutorials from YouTube to learn how to use software, (d) The popular use of Twitter can be understandable in two ways.
Firstly, most people use their smartphones with them during the day and Twitter is a simple tool to follow from a small screen, (e) Regarding the use of digital devices by learners, the term laptop is declining, however, the terms phone and mobile are increasing (See Figure 1.)
Figure 1. Based on the Networked Learning Report 2018
After a quick analysis of the Networked Learning Report 2018, this study also highlights
that the way to represent data is also crucial. In light of these thoughts and concerns, this study examines potential e-learning platforms including social media for the education of an architect based on:
• the types of visual narrativeas a static visual narrative like comics, a dynamic visual narrative like animation and an interactive visual narrative like interactive games [7] can give an idea on users' learning preferences;
• the aim, such as providing access to learning material or visualizing concepts can give an idea of the possible combinations of functions in one tool;
• the information visualization mantra for interactivity, such as the ability to overview, zoom, filter, relate, extract history [5] can give an idea on how one needs what kind of features to reflect content;
• data typesas 1D, 2D, 3D, network etc. [5] can give an idea of how one can pick
the relevant tool in relation to data type.
• Edward Tufte’s writing about the visual communication of information under
the topics of scale, color etc. [8] can give ideas on design concerns of a tool. The following sections introduce the mentioned concepts.
2.1.1 Networked Learning – Tools and Technologies – The Types of Visual Narrative Human beings have been telling stories in a written and oral way. One of the first examples is cave paintings in Lascaux. A visual is something that can be seen to a human eye. In a simple definition, a narrative is the representation of an event or a series of events [16]. It can be said that a narrative is the representation of a story while a story is a sequence of events. And visual narrative is synonymous with visual stories, narrative images, picture stories, narrative pictures [7]. A visual narrative could be represented in any medium. This study is focused on four case studies that are online platforms by their nature. These case studies are examined through whether they contain static visual narratives, dynamic visual narratives or interactive visual narratives. Simply put, in the case of the static visual narratives, the visual is frozen, but the viewer’s eyes and mind move on [17] like cave paintings; in the case of
dynamic narrative, the viewer is in a fixed spot, but visuals are replaced by visuals at the
same display space like animation and puppet shows; in the case of interactive visual
narrative, the viewer and the visual can be both mobile or static as interactive games [7]. In the field of architecture, the static visual narrative is used to show technical drawings and photographs of buildings to students. The dynamic narrative is used both by students to represent their projects via digital tools and also by their tutors to show the spatial quality of a building virtually.
2.1.2 Networked Learning – Tools and Technologies – Aim of the tools
Learning content is often complex, ill-structured and not pre-designed. That is why there are
tools for knowledge management, which make use of the human cognitive processing system in order to create and convey content more efficiently. Recently, there has been an increasing
interest in visualization for knowledge management systems in academia like Khan Academy Knowledge Map [4]. It is understandable since the conventional knowledge management or
content management tools do not allow academics freedom and flexibility in the course design to develop pedagogically effective learning activities, nor do they allow easy resourcing, reusing or re-sharing. The existing body of research on the knowledge and
content management systems for the educational use suggests that combining every feature
complex task however the visualization can help. There is a need for tools aiming at supporting cognitive processing in generating, representing, structuring and restructuring, retrieving, sharing, and using knowledge.
Helping students to organize their knowledge is as important as the knowledge itself since knowledge organization is likely to affect student’s intellectual performance too. There are studies supporting knowledge organization both as linear learning plans which cannot be traced by learners such as Khan Academy Knowledge Map [4]; and as platforms which offer online courses like EdX [6]. Despite all, social media help both instructors and students to increase their motivation, using mobile devices in conjunction with social media, free web tools that allow for communication and enhance learning [18]. Although each tool has its own potential, it is still not known how to combine the most effective features like sharing, content archiving, showing links between concepts in one tool to foster the meaningful learning. To sum up, the aim of the tools can be stated as follows: (a) visualizing concept map, (b) searching for concepts, (c) providing access to learning materials, (d) creating and exploring learning plans, (e) creating concept maps, and (f) adding course materials.
2.1.3 Networked Learning – Tools and Technologies – The Information Visualization mantra and Data Types
“Visualization” is an activity in which human beings are engaged as an internal construction in the mind [19]. It is something that cannot be printed on paper or displayed on a computer screen. This paper refers to the term “visualization” as visually representing data that can be generated and calculated. According to Mazza, Information Visualization lays between data and information [20]. We visualize data to produce information where that information is transformed into knowledge with the help of the user's experience. Visual representations help us to ease that process. However, a human can understand a visual representation when it is well designed. Shneiderman [5] enumerated seven tasks users could perform on the data that can also help to design an efficient tool which are: (a) Overview: Gain an overview of the entire collection, (b) Zoom: Enlarge items of interest, (c) Filter: Filter out uninteresting items, (d) Details on demand: Select an item or group and get details when needed, (e) Relate: View relationships among items, (f) History: Keep a history of actions to support undo, replay, and progressive refinement, (g) Extract: Take out sub-collections of data or history to save and communication.
To be able to select the correct technique of data visualization, one should define the data type first. Shneiderman [5] distinguished seven data types and assumes that all data in information space are collections of items, where items have multiple attributes. These data types are; a one-dimensional like text files and alphanumeric list of names, a two-dimensional like geographic map or book layout, a three-dimensional like real-world objects and chemical molecules, a temporal like time-series and scientific measurement rows, a multidimensional like relational database content, a tree-like structured data collections with hierarchy constraints, and a network which is a structured object sets which do not apply to tree constraints [5].
During the architectural education, a student of an architect come across a 1D data in most of the theory courses, a 2D data in most of the theory courses and in a studio like an urban map, a 3D data such as physical models, a temporal data can be continuous courses in the curriculum, a tree can be seen as the whole education system like each course is designed by a coordinator, taught by a tutor, and the coordinator is assigned by the vice dean, and a
networked data is visually not "visible" for everyone since the learners cannot link the ideas easily during a course and create a network for them.
2.1.4 Networked Learning – Tools and Technologies – Tufte's perspective
Edward Tufte's writing about the visual communication of information helps anyone who wants to structure the information they want to present and identify suitable visualization strategies. Edward Tufte points out some criteria to ensure that a visual representation is effective in his books named Envisioning Information, and The Visual Display of Quantitative [8]. There are five chapters from the book to analyze as Small Multiples, Narrative of Space and Time, Macro/Micro Readings (as seen in number 1 below), Layering and Separation, and Escaping Flatland (as seen in number 2 below) [8]. Using scale and sequence can illustrate the concept of time. And also, combining maps (2D) and perspective drawings help people to understand their way if they do not think in 3D.
Figure 2. Examples of good visualization [8]
As Tufte puts in words, we can discuss whether a representation is good or bad under four captions:
• graphical excellence: A good representation aims to provide the viewer with “the greatest number of ideas, in the shortest time, using the least amount of ink, in the smallest space”.
• graphical integrity: The representation of numerical data, just as they are physically designed on the surface of the graphic, should be directly proportional to the numerical quantity represented.
• data-ink ratio: It is important not to overload the reader with too many elements, which could end up being unnecessary, if not positively damaging, to the final learning.
• aesthetics: It is good to avoid decorations [5]
In the coming sections, case studies are compared to these features listed and discussed during the body of this study.
3 Case Studies
[image:7.482.65.377.257.337.2] Learning Management System: Blackboard
According to the criteria of this study, it is visible that Blackboard meets half of the requirements (as seen in Figure 3).
Social Media: Facebook in the case of ADT
The case study took place in the Spring semester of 2017-18 in Istanbul Technical University. The course named Theories of Architectural Design was developed and instructed by Assoc. Prof. Dr. Yüksel Demir. The course aims to examine all the dimensions of architecture, through essential “concepts”, “questions”, “problems”, “texts”, “works”, “individuals” in unity. In this context, the interdisciplinary nature of architecture, the relations of architecture with “nature – culture”, “art – science” will have the highest priority. All these studies will be realized considering the inseparable relation of theory and practice. The students are expected to propose their personal agendas and compose the collective agenda within this frame. Since the beginning – the term year 2003-2004, the course enables students to be aware of the various theories, which direct the architectural design. Each term student discussions form an interactive platform, where specific topics come up.Every session the volunteer reporters took notes, prepared a report, and these reports have been shared online after the moderation of the course leader. Although the course is a theoretical course, the assignments are presented usually in a visual format like posters, flyers, GIFs, short videos, and mind maps. The course has different types of communication medium between students and instructors such as blogs, e-mail groups, and Facebook groups.
In the mentioned semester, the course had a closed Facebook group. I am a virtual assistant of the course and I made four Skype meetings with the class, and each week I shared projects, assignments and made comments. The content of the course became richer with the participation of other faculty members. The course content is recreated each semester according to students' agenda. Students started the semester with a proposal consisting of their interest such as concepts, individuals, texts, works and questions. Each student must submit five concepts, five individuals, five texts, five works, and five questions. Then, they need to form a group according to their shared interest. According to a short questionnaire, findings are;Problem 01: Interface (Facebook) has a poor resolution and limited bandwidth. The solution would be: Putting stress to a verbal channel, presenting words as narration and moving some essential from the visual channel [21].
Problem 02: Reduction of information. The solution would be: zoom in & out and also click the text to see the explanation.
Problem 03: Using readymade templates and layouts (FB) creates standardization. The solution would be: A tool to create a room for personalization.
Problem 04: showing the content is easy but to be able to understand the relations between concepts, it becomes complicated. The solution would be: A network visualization as a concept map.
Learning Management System: Blackboard
According to the criteria of this study, it is visible that Blackboard meets half of the
requirements (as seen in Figure 3).
Social Media: Facebook in the case of ADT
The case study took place in the Springsemester of 2017-18 in Istanbul Technical University.
The course named Theories of Architectural Design was developed and instructed by Assoc.
Prof. Dr. Yüksel Demir. The course aims to examine all the dimensions of architecture, through essential “concepts”, “questions”, “problems”, “texts”, “works”, “individuals” in
unity. In this context, the interdisciplinary nature of architecture, the relations of architecture with “nature – culture”, “art – science” will have the highest priority. All these studies will be realized considering the inseparable relation of theory and practice. The students are expected to propose their personal agendas and compose the collective agenda within this frame. Since the beginning – the term year 2003-2004, the course enables students to be aware of the various theories, which direct the architectural design. Each term student discussions form an interactive platform, where specific topics come up.Every session the
volunteer reporters took notes, prepared a report, and these reports have been shared online after the moderation of the course leader. Although the course is a theoretical course, the
assignments are presented usually in a visual format like posters, flyers, GIFs, short videos,
and mind maps. The course has different types of communication medium between students and instructors such as blogs, e-mail groups, and Facebook groups.
In the mentioned semester, the course had a closed Facebook group. I am a virtual
assistant of the course and I made four Skype meetings with the class, and each week I shared
projects, assignments and made comments. The content of the course became richer with the participation of other faculty members. The course content is recreated each semester according to students' agenda. Students started the semester with a proposal consisting of
their interest such as concepts, individuals, texts, works and questions. Each student must
submit five concepts, five individuals, five texts, five works, and five questions. Then, they need to form a group according to their shared interest. According to a short questionnaire, findings are;Problem 01:Interface (Facebook) has a poor resolution and limited bandwidth.
The solution would be: Putting stress to a verbal channel, presenting words as narration and moving some essential from the visual channel [21].
Problem 02: Reduction of information. The solution would be: zoom in & out and also
click the text to see the explanation.
Problem 03:Using readymade templates and layouts (FB) creates standardization. The solution would be: A tool to create a room for personalization.
Problem 04: showing the content is easy but to be able to understand the relations between concepts, it becomes complicated. The solution would be: A network visualization as a concept map.
The feedback was mainly positive according to the survey done by students however it is also visible that Facebook does not meet a high percentage of the criteria. It is obvious that
the aim plays a vital role while choosing the tool.
Learning Platform: EdX
EdX founded by Harvard University and MIT in 2012, edX is an online learning destination
and MOOC provider, offering high-quality courses from universities and institutions to learners everywhere [6]. It is also visible that EdX does not meet a high percentage of the criteria (as seen in Figure 3).
Learning Platform: Khan Academy Knowledge Map is like a big picture of what a
person wants to learn. It shows the concepts and their relations to other concepts so that if a learner has an interest in topic A, s(he) can follow topic C which has a relation with topic A.
Since it also reflects a network, the platform meets the criteria at a high percent (as seen in
Figure 3).
4 Conclusion and Discussion
Figure 3. All the case studies are compared according to [5], [7] and [8], illustrated by Baloglu Asut, M. with RawGraphs
All serious projects should start with a rigorous specification of the requirements, collected from potential users of the system through interviews, questionnaires, etc. [20]. To answer :
Functionality: Does the visual representation provide all of the functionalities requested by the instructors and identified during the requirements elicitation?
The answer: All the cases have positive and negative sides on functionality that is the
problem to solve. For some of the platforms, it is easy to embed 3D data and videos as EdX,
but for some of them there is capacity as Blackboard and the speed of downloading is
changing per country.
Effectiveness: Does the visual representation provide the instructors with a better
knowledge of the number of messages read and written in a discussion forum than the traditional interfaces provided by the tool? In particular, does the use of visual representations allow the instructors to have information on the number of messages sent and read with better accuracy and precision than other tools? Or, is there additional information that is made available exclusively by the visual representations?
The answer: Rather than Blackboard, Facebook has more advantages on effectiveness since it has a feature that shows who and how many people sees the comments.
Efficiency: Can the visual representation provide the instructors with information more rapidly than the tools provided by the system?
The answer: Efficiency also depends onthe speed and quota of the internet in different countries.
Usability: Is the interaction with the graphical interface simple and intuitive enough for the instructors?
The answer:Khan Academy Knowledge Map may create a map shock. On the other hand,
Facebook is relatively easy since people use it in their daily lives.
Usefulness: In what way, and in what context, is the information provided by the graphical representation useful to the instructors?
The answer: The visual narrative effects the usefulness of the tools. Each people has a
way to learn so that if a tool or a platform serves different kinds of visual narratives, then it
has a high chance to reach learners.
As an outcome, this study proposes a model for the education of an architect. After analysis of e-learning platforms, this study concludes that (1) an education model based on a
network can help architects to see the big picture however it also causes data reduction and
loss, (2) an education model based on network allows architects to create their own learning
paths and share it with their colleagues, (3) an education model based on a network may be
a sustainable platform for architects form different experience levels and enhance the communication between them to support the youngers’ education. Since knowledge construction is a unique process, in a network anyone can see the one's unique learning
process, (4) an education model based on a network decentralizes the process of learning and
enriches it through the interaction between other learners, concepts, thoughts and objects, (5)
an education model based on a network bridges the gap between what one already knows and what one needs to know to understand the whole picture, (6) an education model based on
network gives the opportunity to compare previous years' feedbacks, concepts, and thought
in one medium.
References
1. G. Ayala, Intelligent Agents Supporting the Social Construction of Knowledge in a
Lifelong Learning Environment, Proceedings of the International Workshop on New Technologies for Collaborative Learning NTCL’ 2000, November 2000, Hyogo, Japan, 79
-88 (2000)
3. G. Siemens, Connectivism: A learning theory for the digital, International Journal of Instructional Technology Distance Learning, 2,1, 3-10 (2005)
4. https://tr.khanacademy.org/welcome>; accessed on 20.10.2018
5. B. Shneiderman, The Eyes Have It: A Task by Data Type Taxonomy for Information Visualizations.” Proc. IEEE Visual Languages, 336-343. (1996)
6. <https://www.edx.org/>>; accessed on 20.10.2018
7. R. Pimenta, R. Poovaiah, On Defining Visual Narratives. Design Thoughts, 25-46, (2010) 8. E. Tufte, Envisioning Information, Graphics Press, Cheshire, 58 (1990)
9. M. Castell, The rise of the network society, Blackwell, Oxford, 3,6 (1996)
10. E. K. Ackermann, Experiences of artefacts: people’s appropriations / objects’ affordances, in Larochelle M. (ed.) Ernst von Glasersfeld, Key Works on Radical Constructivism, Sense Publishers, (2007)
11. P. Himanen, et al., The Hacker Ethic: and the Spirit of the Information Age. (2002) 12. U-D. Ehlers, A. Seinert, Networked Learning in a Networked World, (2010)
13. P. Goodyear, Pedagogical frameworks and action research in open and distance learning,
European Journal of Open and Distance Learning,
http://www.eurodl.org/materials/contrib/1999/goodyear/index.html (1999)
14. P. Goodyear, L. Carvalho, Framing the analysis of learning network architectures, in: L.Carvalho & P. Goodyear (Eds) The architecture of productive learning networks, New York, Routledge. (2014)
15. S. Schaffert et al. (Eds.): Networked Knowledge - Networked Media, SCI 221, 1–6, (2009)
16. P. Abbott, The Cambridge Introduction to Narrative,13,(2000)
17. E. Souriau, Time in the Plastic Arts, The Journal of Aesthetics and Art Criticism, 294307, (1949)
18. Rodriguez, (2011)
19. B. Espiau, et al., A new approach to visual serving in robotics, in Geometric Reasoning for Perception and Action, 106–136, (1991)
20. R. Mazza, Introduction to Information Visualization, Springer, 126, (2009)
![Figure 2. Examples of good visualization [8]](https://thumb-us.123doks.com/thumbv2/123dok_us/8220607.265825/7.482.65.377.257.337/figure-examples-good-visualization.webp)
![Figure 3. All the case studies are compared according to [5], [7] and [8], illustrated by Baloglu Asut, M](https://thumb-us.123doks.com/thumbv2/123dok_us/8220607.265825/10.482.52.346.81.440/figure-case-studies-compared-according-illustrated-baloglu-asut.webp)
