International Journal of Innovative Technology and Exploring Engineering (IJITEE) ISSN: 2278-3075, Volume-9 Issue-2, December 2019
Abstract: DDOS attacks are most found attack in real world which would cause the data drop/loss. DDOS attack prevention and detection is more concentrated research issue which is done in our previous work by introducing Burst Transmission aware DDOS Attack Detection (BT-DDOSAD) method. However, in this research method processing overhead will be high where traffic analysis processes would be carried out by primary server itself where there is a chance of server collapse. It is resolved in the proposed research method by introducing the Modified Firecol System (MFS) in which attack detection can be done accurately. In this work, secondary server is introduced to perform traffic flow analyses before allowing traffic data into the primary server, so that network collusion can be avoided considerably. Secondary server election is done based on trust values and resource availability such as energy and bandwidth. Here Modified genetic algorithm is applied to select the secondary server. In the modified genetic algorithm, crossover is performed by combining it with the mutation process. Here the genes to undergone cross over are selected by using diversity based mutation scheme where the variances of genes are measured. Modified Firecol is introduced by integrating the malicious traffic flow detection metrics such as “traffic flow metric, throughput metric, bandwidth allocation metrics, bandwidth deviation metric, Generalized Entropy (GE), Generalized Information Divergence (GID) metrics, Projected Entropy”. If Normalized Entropy is smaller than threshold entropy then, the received packet is from illegal user else comparison is done against another threshold value. The overall implementation of the research work is done in the Ns2 simulation environment from which it can be proved that the proposed research method can produce better result than the existing work.
Keywords: Processing overhead, DDOS attack, Secondary server, Modified Firecol, Entropy metrics
.
I. INTRODUCTION
Scattered disputes of organization (DDoS) ambushes are a subclass of refusal of organization (DoS) attacks. A DDoS ambush incorporates various related online contraptions, aggregately known as a botnet, which are used to overwhelm a target website with fake traffic [1]. Not in any way like various sorts of computerized attacks, DDoS ambushes don't attempt to break your security edge [2]. Or on the other hand perhaps, they hope to make your site and servers blocked off
Revised Manuscript Received on December 22, 2019.
* Correspondence Author
R.Rathika M.Sc., MCA, M.Phil., (Ph.D)., Research Scholar, PG and Research Department of Computer Science, Government Arts College, Coimbatore, Tamilnadu.India
Dr.A. Marimuthu MCA., MBA., M.Phil, Ph.D., Associate Professor & HOD, PG and Research Department of Computer Science, Government Arts College, Coimbatore, Tamilnadu.
to bona fide customers. DDoS can in like manner be used as a smokescreen for various malicious activities and to cut down security contraptions, breaking the target's security edge [3]. A productive DDoS ambush is an extraordinarily perceptible event influencing an entire online customer base. This chooses it an outstanding weapon of choice for hacktivists, computerized vandals, blackmailers and some other individual wanting to arrive at a significant determination or champion an explanation [4]. DDoS ambushes routinely prop up for a significant long time, weeks and even quite a while on the double, making them incredibly ruinous to any online affiliation. Notwithstanding different things, DDoS ambushes can incite loss of livelihoods, break down purchaser trust, influence associations to spend fortunes in compensations and cause whole deal reputation hurt [5]. Various restrictive and open-source arrangements exist for DDoS assault recognition and moderation. Be that as it may, these assaults keep on developing in recurrence, complexity, and seriousness [6]. Fast discovery and alleviation of DDoS assaults has turned out to be seriously testing as aggressors keep on utilizing novel strategies to dispatch DDoS assaults [7]. The rising number of DDoS assaults, combined with developing decent variety in their sorts, causing appalling effect, has made DDoS assault location, relief, and counteractive action the top generally need.
The current DDoS ambush recognizable proof estimations can be isolated into two classes: signature-based estimations and variation from the norm based estimations [8]. The imprint set up together estimations depend as for the organizing of remarkable guides to the attempted traffic. In low-rate DDoS ambush acknowledgment, for example, an ordinary imprint used in the imprint based estimation is the impacted (beat) period. The burst time period is commonly used by low-rate DDoS aggressors to examine the homogeneity of the base retransmission break (RTO), and a comprehensively applied estimation of the burst time span is 1 second in such disclosure estimations [9]. Regardless, a continuous report displayed that this value isn't right, as it doesn't consider the framework condition, for example, traffic blockage, especially when an ambush is advancing [10]. Thus, generally speaking, the essential distortion of imprint based estimations is weakness when the imprint model is dark.
Processing Overhead Reduced Effficient
Malicious Traffic Flow Detection using
Modified Firecol
Then again, the peculiarity put together location techniques depend with respect to distinguishing clear measurable abnormalities by examination against the real traffic. Entropy, for example, is ordinarily utilized in abnormality based measurements [11]. The entropy variety between typical traffic and tried traffic may show that the entropy estimation of the tried traffic is abnormal and, in this manner, a low rate DDoS assault is happening. Nonetheless, the impediment is that the estimation of the entropy hole is very little, which could raise a great deal of false alerts.
In this work, secondary server is introduced to perform traffic flow analyses before allowing traffic data into the primary server, so that network collusion can be avoided considerably. Secondary server election is done based on trust values and resource availability such as energy and bandwidth. Here Modified genetic algorithm is applied to select the secondary server. In the modified genetic algorithm, crossover is performed by combining it with the mutation process. Here the genes to undergone cross over are selected by using diversity based mutation scheme where the variances of genes are measured. Modified Firecol is introduced by integrating the malicious traffic flow detection metrics such as “traffic flow metric, throughput metric, bandwidth allocation metrics, bandwidth deviation metric, Generalized Entropy (GE), Generalized Information Divergence (GID) metrics, Projected Entropy”. If Normalized Entropy is smaller than threshold entropy then, the received packet is from illegal user else comparison is done against another threshold value.
The general association of the examination work is given as pursues: In this area, point by point presentation about the DDOS assaults and the requirement for their recognition plan has been given. In area 2, different research strategies proposed by different scientists has been examined in point by point. In segment 3, point by point exchange about the proposed research system and their working methodology is given. Area 4 gives the exchange about the trial situation. At long last in area 5, by and large finish of the exploration work dependent on reproduction results has been given.
II. RELATEDWORKS
The ongoing work around there can be separated into two classes: abnormality based location techniques and mark based identification strategies.
In inconsistency based discovery, Zhang et al. [12] proposed a clog support rate (CPR) metric and a CPR-based way to deal with identify and channel low-rate DDoS assaults. They found that low-rate DDoS streams effectively incite arrange clog, though typical TCP streams effectively stay away from organize blockage. The proposed technique was intended to recognize assault streams from genuine streams. In any case, more examinations and investigations utilizing genuine datasets are expected to test its viability.
Jadhav and Patil [13] proposed an ideal target entropy based strategy to recognize low-rate DDoS assaults. This methodology is an extensive improvement over the conventional entropy metric. In any case, the separation esteem between ordinary traffic and assault traffic is very little and in this manner, the bogus positive rate is huge. Xiang et al. [14] proposed summed up entropy and data separation to recognize and traceback low-rate DDoS
assaults. In view of the summed up entropy separation between the real traffic and the low-rate DDoS assaults, the proposed estimation beats the convention Shannon entropy as far as false-positive rate and separation hole. Despite the fact that the separation hole can be balanced by evolving 𝛼, the separation hole is still little.
Bhuyan et al. [15] proposed a lightweight expanded entropy metric-based framework for DDoS assault location and IP traceback. The all-inclusive entropy metric is an improvement of the summed up entropy to accomplish a generally more prominent separation than Yang's measurement. Be that as it may, the separation is still little because of the innate impediment of entropy.
Du and Abe [16] proposed an IP bundle size entropy metric to identify both long haul low-rate DDoS assaults and momentary high-rate DDoS assaults. In view of the presumption that numerous applications have common parcel sizes as for demands for and reactions to information and affirmations, they asserted that the circulation of the bundle size changes under assaults; this can be utilized to recognize assaults somewhat. Be that as it may, as the proposed strategy intensely depends on the parcels in the perception window, this methodology is constrained in its adaptability, and a long location time is expected to accomplish a high recognition likelihood when experiencing a low-rate DDoS assault. In the mark based location,
Sun et al. [17] introduced a circulated discovery instrument that uses the dynamic time traveling technique to distinguish low-rate DDoS assaults. In view of the mark of the low-rate DDoS assault of an occasional short burst, they determined the aggregate separation of the dynamic time traveling between examined streams and the layout streams. The combined separation of the dynamic time traveling demonstrates the similitude degree between the two streams. Be that as it may, as it depends on the periodicity of the assault stream, in principle, it might be powerless in genuine systems and under obscure mark designs.
Luo et al. [18] proposed a scientific model to assess the joined effect of assault example and system condition. They examined the powerlessness of a framework to advanced assault and the model of the base transmission pace of assault bundles to tune the assault impact. In spite of the fact that the proposed model reveals some novel properties of low rate DDoS assaults, more analyses utilizing genuine datasets are expected to test their model.
International Journal of Innovative Technology and Exploring Engineering (IJITEE) ISSN: 2278-3075, Volume-9 Issue-2, December 2019
III. MODIFIEDFIRECOLBASEDDDOSATTACK DETECTION
A Distributed Denial of Service (DDoS) assault is an endeavor to make an online assistance inaccessible by overpowering it with traffic from various sources. They focus on a wide assortment of significant assets, from banks to news sites, and present a significant test to ensuring individuals can distribute and get to significant data. Thus it is required to analyze the traffic received from the multiple sources in the efficiency way to detect the DDOS attacks. By doing so, server can be protected by avoiding the reception of overwhelmed incoming traffic. However this detection process would be done on the primary server which will increase the computation burden. Thus in this work, traffic analysis process is separated from the primary server and it is performed on secondary server. In this research work, node with sufficient resources will be considered as secondary server. The secondary server is elected by using Modified Genetic algorithm. And then Firecol is upgraded as modified Firecol by integrating the additional traffic flow metrics measure process to increased attack detection probability. If these values are smaller than the threshold value then it will be concluded as DDOS attack. The detailed explanation of the proposed research methodology is given in the following sub sections.
3.1. SECONDARY SERVER SELECTION
Secondary server is introduced to perform these analyses before allowing traffic data into the primary server, so that network collusion can be avoided considerably. Secondary server election is done based on trust values and resource availability such as energy and bandwidth. Here Modified genetic algorithm is applied to select the secondary server. In the modified genetic algorithm, modification is performed on the crossover by combining it with the mutation process. Here the gene to undergone cross over is selected by using diversity based mutation scheme where the variance of genes is measured. The detailed explanation of the secondary server election procedure using modified genetic algorithm is given in the following sub sections.
3.1.1. GENETIC ALGORITHM
A hereditary calculation is a hunt heuristic that is enlivened by Charles Darwin's hypothesis of common development. This calculation mirrors the procedure of characteristic choice where the fittest people are chosen for proliferation so as to deliver posterity of the people to come. The procedure of normal choice beginnings with the determination of fittest people from a populace. They produce posterity which acquire the qualities of the guardians and will be added to the people to come. On the off chance that guardians have better wellness, their posterity will be superior to guardians and have a superior possibility at enduring. This procedure continues repeating and toward the end, an age with the fittest people will be found. Five stages are considered in a hereditary calculation.
1. Initial populace
2. Fitness capacity
3. Selection
4. Crossover
5. Mutation
Starting Population: The procedure starts with a lot of people which is known as a Population. Every individual is an answer for the issue to understand. An individual is described by a lot of parameters (factors) known as Genes. Qualities are joined into a string to frame a Chromosome (arrangement). In a hereditary calculation, the arrangement of qualities of an individual is spoken to utilizing a string, as far as a letters in order. Generally, paired qualities are utilized (series of 1s and 0s). We state that we encode the qualities in a chromosome. Wellness Function: The wellness capacity decides how fit an individual is (the capacity of a person to contend with different people). It gives a wellness score to every person. The likelihood that an individual will be chosen for generation depends on its wellness score.
Choice: The possibility of choice stage is to choose the fittest people and let them pass their qualities to the people to come. Two sets of people (guardians) are chosen dependent on their wellness scores. People with high wellness have increasingly opportunity to be chosen for propagation.
Hybrid: Crossover is the most noteworthy stage in a hereditary calculation. For each pair of guardians to be mated, a hybrid point is picked aimlessly from inside the qualities. Posterity are made by trading the qualities of guardians among themselves until the hybrid point is come to. The new posterity are added to the populace.
Transformation
In certain new posterity shaped, a portion of their qualities can be exposed to a transformation with a low irregular likelihood. This infers a portion of the bits in the bit string can be flipped. Transformations jumps out at keep up assorted variety inside the populace and forestall untimely assembly. End: The calculation ends if the populace has met (doesn't create posterity which are altogether not the same as the past age). At that point it is said that the hereditary calculation has given a lot of answers for our concern. The above procedure gives the overview of working procedure of genetic algorithm. In conventional genetic algorithm cross over points are selected randomly which might reduce the performance. This is improved in this research method by introducing the modified genetic algorithm in which instead of selecting crossover points randomly, in this work diversity based mutation is integrated to select the cross over points optimally. In the following sub section, detailed explanation about the diversity based mutation is provided.
3.1.2. DIVERSITY BASED MUTATION
To make the over a likelihood conveyance , λ ̅ is utilized by finding the foundation of the accompanying condition for a fixed n:
λ exp(−nλ) − exp(−λ) − λ + 1 = 0
Thereafter, for a random number u ∈ [0, 1], the variable (l + 1) that should be mutated is given:
l = 1
λlog 1 − u 1 − exp −nλ
For n = 15, λ = 0.168 is found.
3.1.3. MODIFIED GENETIC ALGORITHM
Altered Genetic Algorithm is utilized for the choice of auxiliary server dependent on Residual Energy, Bandwidth and memory. When the optional server was chosen, information sending utilizing least transmission capacity to the sink hub is finished. Likelihood to turn into a server is more for a hub with greatest RE, and most extreme unused BW and most extreme unused memory. In the event that any two of the parameters stay with most extreme worth and other one with least worth, at that point likelihood of that hub to move toward becoming CH relies upon the loads given for that parameter.
Calculation for Cluster Head determination utilizing GA
1. Produce an underlying populace of people with irregular chromosomes
2. Assess the wellness everything being equal and rank them
3. Select best people with greatest wellness work for proliferation
4. Expel some terrible arrangements from set 5. Recombine between best people
Take any two people c1 and c2
Apply assorted variety based transformation of c1 Return gene g1 (node) with more variance
Apply cross over between c1 and c2 on position g1 6. Evaluate the fitness of the modified individuals 7. Generate a new population
3.2. MODIFIED FIRECOL
Modified Firecol is introduced by integrating the malicious traffic flow detection metrics such as “traffic flow metric, throughput metric, bandwidth allocation metrics, bandwidth deviation metric, Generalized Entropy (GE), Generalized Information Divergence (GID) metrics, Projected Entropy”. If Normalized Entropy is smaller than threshold entropy then, the received packet is from illegal user else comparison is done against another threshold value.
The Modified firecol system (Figure 1) uses a semi-centralized architecture maintaining a group of local IPDS that is installed near the local routers and a global IPDS that is installed near the gateway router. This work focuses on spoof-based collaborative detection of collaborative flooding DDoS attacks. The modified firecol system consists of three main components which mutually involve in mitigating collaborative flooding DDoS attacks.
The Figure 1 demonstrates the design perspective on the changed firecol framework. The Modified fireCol segments
International Journal of Innovative Technology and Exploring Engineering (IJITEE) ISSN: 2278-3075, Volume-9 Issue-2, December 2019
Figure1. Modified Firecol architecture The Figure 1 demonstrates the design perspective on the
changed firecol framework. The Modified fireCol segments are portrayed as pursues: The confirmation controller is answerable for allotting introductory transmission capacity for every hub utilizing a transfer speed designation calculation. The affirmation controller acknowledges the hub that finishes the enrollment procedure effectively. The hubs need to at first register with the system by sending couple of secret data. Toward the finish of enlistment process, the affirmation controller distributes a data transfer capacity bn and a transmission capacity legitimacy time, i.e., TTL for every hub. The traffic analyzer segment involves two parts to be specific the clock screen and the transmission capacity screen. The clock screen keeps up the clock esteems being
Notwithstanding, since the whole traffic can't be observed out and out by a solitary worldwide IPDS segment, advance the use of numerous IPDS parts for proficient identification and sifting of the assault.
The worldwide IPDS keeps up a hub profile which comprise of the accompanying data in particular the customer hub's IP address, the customer hub's MAC address, the customer hub's clock esteem, the customer hub's area confirmation data, the customer hub's designated transfer speed and the TTL esteem. The worldwide IPDS additionally keeps up a nearby profile which comprises of the IP address of the nearby IPDS, the all out number of customer hubs associated with it and its neighboring nearby IPDS. The neighborhood IPDS keeps up a profile which comprises of the clock estimations of every customer hub, the quantity of streams inside every customer hub, its comparing port number and the relating customer hub to which the stream is being transmitted or got. The entropy metrics that are considered in this work are, “traffic flow metric, throughput metric, bandwidth allocation metrics, bandwidth deviation metric, Generalized Entropy (GE), Generalized Information Divergence (GID) metrics, Projected Entropy”.
Traffic flow metric: This metric helps to calculate the total number of communications taken place in the network when we install the modified firecol system in the network. The total traffic flow at the global IPDS is given by,
f Gm = fout(Lm) i
m=1
where fout(Lm) is the sum of all outgoing traffic flow coming out from all the local IPDS. All mesh client nodes has to pass through the local IPDS to send and receive messages. Therefore, the total traffic flow at the local IPDS is obtained by adding the total incoming and outgoing traffic flow at each mesh client node. The total traffic flow at the local IPDS is given by,
f Lm = fin n + fout(n) n∈N n∈N
where fin(n) is the client node’s incoming traffic and fout(n) is the client node’s outgoing traffic. The total traffic flow at the mesh client nodes is given by,
f n = fc n + fd(n) i
d=1 i
c=1
where fc(n) is the client node’s control flow traffic and fd(n) is the client node’s are the control flow traffic and data flow traffic at the mesh client nodes. The control flow traffic at the mesh client node n is given by,
fc(n) = fcin (n) + fcout (n)
where fcin(n) is the client node’s incoming control flow traffic and fcout(n) is the client node’s outgoing control flow traffic. The data flow traffic at the mesh client node n is given by,
fd (n) = fdin (n) + fdout (n)
where fdin(n) is the incoming data flow traffic at the client node and fdout(n) is the outgoing data flow traffic at the client node. The total number of control messages exchanged between the mesh clients, the local IPDS and the global IPDS are required to calculate the communication overhead.
Throughput metric: The proposed framework ensures a base throughput of λ and all customer hubs ought to follow inside
this throughput. i.e.,
∑_(n∈N)▒〖b_n≤λ〗
The throughput is influenced by the division of transmission capacity assigned to every customer hub. The customer hubs for which the data transfer capacity is apportioned through the transmission capacity distribution convention are considered for accomplishing remote work organize throughput.
Data transmission designation measurements: bn is the part of transfer speed apportioned to every customer hub n∈N and Br = B − Bmb where B is the complete transmission capacity distributed to the system, Bmb is the data transmission allocated for the nearby and worldwide IPDS and Br is the transmission capacity dispensed to each work customer hubs who joins the system. The data transfer capacity requirement is given by,
bn ≤ Br/N
Bandwidth deviation metric: The bandwidth deviation metric is given by,
dev (bn, bn’) ≤ϖ
Each client node is allotted a bandwidth bn within the network and they are permitted to utilize only their allotted bandwidth. Nodes failing to use bn might have been deviated to bn'. The deviation of bn and bn’ must not exceed ϖ whose value is 0.1. If the deviation exceeds ϖ then it leads to rejection of that client node.
Generalized Entropy (GE): Entropy was introduced to measure the uncertainty of an event associated with a given probability distribution X. The formal definition of entropy in terms of a discrete variable X, with possible outcomes x1, x2, ..., xn can be defined as:
H x = p xi log2 1 p(xi) n
i=1
= − p xi log2 p (xi) n
i=1
where p(xi) = Prob(X = xi) is the probability of the ith outcome of X. A generalized entropy (GE) can be defined as:
Hα X = 1
1 − α log2 pi(α) N
i=n
International Journal of Innovative Technology and Exploring Engineering (IJITEE) ISSN: 2278-3075, Volume-9 Issue-2, December 2019
By varying the α order, different types of entropy values can be obtained. When α = 0, it indicates the maximum value of the generated information. But, when α = 1, it can be expressed as: H1 x = − ni=1p xi log2p(xi), which is termed as Shannon Entropy (Esh).
The value of α increase the deviation between different probability distribution as compared to (Esh) when α > 1. In high probability events the GE can produce better and accurate result than (Esh).
Generalized Information Divergence (GID) metrics: Let’s two different probability distribution are P = (p1, p2, ..., pn) and Q = (q1, q2, ..., qn). A generalized information divergence (GID) can be derived as:
Dα P Q = 1
1 − αlog2 pi αq
i 1−α N
i=1
, where α ≥ 0
Projected Entropy: According to for a stochastic processes the entropy rate H (x) of two random processes are same
H X = lim n→∞
1
nH x1, x2, . . , xn
If H(x) <=th2, th2 is the threshold value2, Mark the flow as attacked, raise a final alert, discard the attack flow.
Interruption recognition System chairman relegates an edge an incentive for parcels. Gather traffic stream in schedule vacancy.
Ascertain Entropy H(x) for parcels, by methods for IP address, ports and stream size as information. From this, standardized entropy is found. At last contrast standardized entropy and that of relegated limit esteem. Whenever Normalized Entropy is littler than limit entropy at that point, the got bundle is from unlawful client else correlation is done against another edge esteem. For this situation bigger worth presumes that parcel is gotten from lawful client. Setting a limit worth isn't a simple undertaking. Edge esteem principally relies upon false positive rate.
IV. RESULTS AND DISCUSSION
In this work, we make use of NS-2 simulator to compute the performance of the proposed Modified Firecol System (MFS). Our simulations model a network comprises of 100 sensor nodes placed randomly within a 100 × 100 meters area. The two varieties of sensor nodes in the simulations are determined as: well-behaved nodes and malicious nodes. The malicious nodes can start DDOS attacks in the simulated cases. The BS has unlimited energy. The number of selected CH is fixed to 10% for one interval. The proposed system MFS performance is computed by distinguishing it with the current system BT-DDOSAD and Feature Learning based DDOS Attack Detection (FL-DDOS-AD). The parameters utilized in this research for computing the trust system are provided in the Table 1. The performance of MFS model was computed by the following metrics like packet loss, packet delivery ratio, energy consumption, end-to-end delay, and mean packet latency.
Table 1 Simulation parameters
Simulation Parameters Values
Channel Wireless Channel
Mac 802.11
Antenna Type Omni antenna
Routing Protocol AODV
Initial Energy 100 joules
Traffic type CBR
Agent UDP
Simulation area 100X100 meters
Number of nodes 100
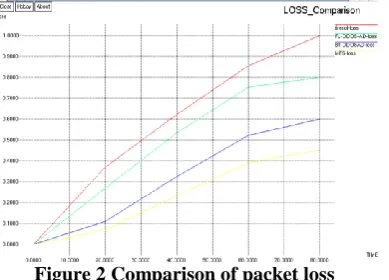
Parcel Loss: The all out number of information bundles lost honestly or through pernicious activity with no notice. Figure 2 gives the graphical sign of parcel misfortune rate, it gives that the MFS technique has lower bundle misfortune rate when recognized with the present frameworks BT-DDOSAD and FL-DDOS-AD.
Parcel Delivery Ratio (PDR): It is the extent of the general measure of information bundles got to the all out number of information bundles transmitted. This clarifies the degree of conveyed information to the goal.
Vitality Consumption: The normal vitality devoured by each hub at the hour of the gave reproduction time is communicated in Joules (J).
Start to finish Delay: End-to-end focuses to the postpone experienced by the information bundle at the hour of the transmission from source to BS, which includes preparing, lining and proliferation delay. Figure 5 gives that the graphical sign of start to finish delay for different trust models in remote sensor system of military applications. On the off chance that bounce to jump check separation worth is high, it gives very good quality to end Delay at the hour of way correspondence. As indicated by this jump to bounce tally separation information transmission is executed from source to goal in MFS framework, so it demonstrates less start to finish Delay. As the proposed MFS framework, high jump to bounce tally separation ways isn't considered as information transmission.
Mean Packet Latency: The mean parcel idleness for those bundles that achieved the goal is lower for MFS so it is skillful of picking the most limited course with the least number of bounces. And also mean packet latency is minimized in the proposed methodology due to minimize the malicious attacks. The graphical chart of the mean packet latency is provided in the following Figure 6.
Routing Overhead: Routing overhead is defined as the computational overhead during routing process due presence of DDOS attacks. Routing overhead of the proposed research
method would be lesser. The assessment of the research method in regard to routing overhead is depicted in the figure
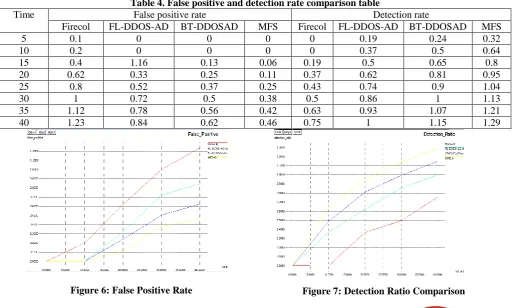
Detection Ratio: Detection ratio is the proportion of correctly predicting the DDOS attacks present in the environment without fail. DDOS attack detection ration should higher for the proposed research method for the ensured secured environment without DDOS attacks presence. The assessment of the DDOS attack is depicted in the figure 9.
Figure 2 Comparison of packet loss
Figure 3 Comparison of packet delivery ratio The current system doesn’t concentrate much on difference among the genuine nodes and the malicious as it assumes every sensor node with high traffic deviation as the malicious. The proposed algorithm detects the individual malicious nodes according to the bias and variance value; hence the packet drop by the genuine nodes can be eliminated. The experimental output provides that proposed MFS have lesser packet loss rate when distinguished with the current BT-DDOSAD and FL-DDOS-AD. Figure 3 provides the performance of the proposed MFS when distinguished with BT-DDOSAD and FL-DDOS-AD in terms of number of rounds and Packet Delivery Ratio (PDR). The number of packets which is efficiently received at the destination without the loss of any packets or failure for the proposed MFS is high which provides higher PDR results.
Table 2. Energy consumption and end to end delay comparison table
Time Packet loss Packet delivery ratio
Firecol FL-DDOS-AD BT-DDOSAD MFS Firecol FL-DDOS-AD BT-DDOSAD MFS
10 0.18 0.14 0.06 0.03 0.25 0.3 0.35 0.42
20 0.37 0.27 0.11 0.07 0.5 0.6 0.7 0.85
30 0.5 0.4 0.21 0.16 0.66 0.75 0.9 1.03
40 0.62 0.54 0.33 0.28 0.8 0.9 1.1 1.2
50 0.74 0.64 0.42 0.31 0.9 1.04 1.2 1.31
60 0.85 0.75 0.52 0.4 1 1.16 1.3 1.41
70 0.93 0.78 0.56 0.42 1.15 1.27 1.4 1.69
80 1 0.8 0.6 0.45 1.26 1.4 1.5 1.74
[image:8.595.81.276.131.271.2]International Journal of Innovative Technology and Exploring Engineering (IJITEE) ISSN: 2278-3075, Volume-9 Issue-2, December 2019
Table 3. Detection Time and routing overhead comparison table Number
of nodes
Detection time Routing overhead
Firecol FL-DDOS-AD BT-DDOSAD MFS Firecol FL-DDOS-AD BT-DDOSAD MFS
5 0.3 0.25 0.2 0.12 0.14 0.1 0.07 0.06
10 0.62 0.5 0.4 0.26 0.27 0.2 0.13 0.1
15 0.74 0.66 0.47 0.35 0.6 0.5 0.4 0.3
20 0.87 0.8 0.56 0.44 0.92 0.78 0.64 0.5
25 1.03 0.9 0.73 0.58 1.1 0.94 0.77 0.58
30 1.2 1.01 0.9 0.7 1.28 1.1 0.9 0.65
35 1.3 1.15 0.95 0.8 1.42 1.25 0.97 0.73
[image:9.595.65.285.72.407.2]40 1.39 1.25 1 0.9 1.56 1.39 1.03 0.8
Figure 5: Routing Overhead Comparison
The MFS method has low packet latency when distinguished with the current system BT-DDOSAD and FL-DDOS-AD. Proposed MFS system, high hop to hop count distance paths isn’t considered for data transmission and that path is assumed as attack path. From the figure 4, it is confirmed that the proposed technique namely MFS technique brings about provide better outcome matched up with the existing research methods in keeping with reduced routing overhead. This routing overhead increased linearly as the time increases but lesser than the existing research method.
Table 4. False positive and detection rate comparison table
Time False positive rate Detection rate
Firecol FL-DDOS-AD BT-DDOSAD MFS Firecol FL-DDOS-AD BT-DDOSAD MFS
5 0.1 0 0 0 0 0.19 0.24 0.32
10 0.2 0 0 0 0 0.37 0.5 0.64
15 0.4 1.16 0.13 0.06 0.19 0.5 0.65 0.8
20 0.62 0.33 0.25 0.11 0.37 0.62 0.81 0.95
25 0.8 0.52 0.37 0.25 0.43 0.74 0.9 1.04
30 1 0.72 0.5 0.38 0.5 0.86 1 1.13
35 1.12 0.78 0.56 0.42 0.63 0.93 1.07 1.21
[image:9.595.74.266.228.407.2]40 1.23 0.84 0.62 0.46 0.75 1 1.15 1.29
[image:9.595.42.558.445.753.2]From this figure 6, it could be specified that the research technique brings about provide the better classification performance matched up with the existing technique in regard to correctly predicting the DDOS attacks behaviour present in the network environment. The proposed method MFS proves to provide more accurate performance matched up with the existing technique.
V. CONCLUSION
In this work, secondary server is introduced to perform traffic flow analyses before allowing traffic data into the primary server, so that network collusion can be avoided considerably. Secondary server election is done based on trust values and resource availability such as energy and bandwidth. Here Modified genetic algorithm is applied to select the secondary server. In the modified genetic algorithm, crossover is performed by combining it with the mutation process. Here the genes to undergone cross over are selected by using diversity based mutation scheme where the variances of genes are measured. Modified Firecol is introduced by integrating the malicious traffic flow detection metrics such as “traffic flow metric, throughput metric, bandwidth allocation metrics, bandwidth deviation metric, Generalized Entropy (GE), Generalized Information Divergence (GID) metrics, Projected Entropy”. If Normalized Entropy is smaller than threshold entropy then, the received packet is from illegal user else comparison is done against another threshold value. The overall implementation of the research work is done in the Ns2 simulation environment from which it can be proved that the proposed research method can produce better result than the existing work.
REFERENCE
1. Yan, Q., Yu, F. R., Gong, Q., & Li, J. (2016). Software-defined networking (SDN) and distributed denial of service (DDoS) attacks in cloud computing environments: A survey, some research issues, and challenges. IEEE Communications Surveys & Tutorials, 18(1), 602-622.
2. Harkins, M. W. (2016). Managing Risk and Information Security: Protect to Enable. Apress.
3. Mansfield-Devine, S. (2015). The growth and evolution of DDoS. Network Security, 2015(10), 13-20.
4. Tse, A., & Carley, K. M. (2017, July). Event-Based Model Simulating the Change in DDoS Attack Trends After P/DIME Events. In International Conference on Social Computing, Behavioral-Cultural Modeling and Prediction and Behavior Representation in Modeling and Simulation (pp. 120-126). Springer, Cham.
5. Waziri Jr, I. M. (2016). Packet filter performance monitor (anti-DDOS algorithm for hybrid topologies) (Doctoral dissertation, Purdue University).
6. Bonilla, R. I., & Abad, C. L. (2017, November). Towards a Real Time Framework for Monitoring IoT Devices for Attack Detection: Vision Paper. In Dependable, Autonomic and Secure Computing, 15th Intl Conf on Pervasive Intelligence & Computing, 3rd Intl Conf on Big Data Intelligence and Computing and Cyber Science and Technology Congress (DASC/PiCom/DataCom/CyberSciTech), 2017 IEEE 15th Intl(pp. 699-703). IEEE.
7. Mousavi, S. M., & St-Hilaire, M. (2015, February). Early detection of DDoS attacks against SDN controllers. In Computing, Networking and Communications (ICNC), 2015 International Conference on (pp. 77-81). IEEE.
8. Bhuyan, M. H., Bhattacharyya, D. K., & Kalita, J. K. (2015). An empirical evaluation of information metrics for low-rate and high-rate DDoS attack detection. Pattern Recognition Letters, 51, 1-7.
9. Zhou, L., Liao, M., Yuan, C., & Zhang, H. (2017). Low-Rate DDoS Attack Detection Using Expectation of Packet Size. Security and Communication Networks, 2017.
10. Kreutz, D., Ramos, F. M., Verissimo, P. E., Rothenberg, C. E., Azodolmolky, S., & Uhlig, S. (2015). Software-defined networking: A comprehensive survey. Proceedings of the IEEE, 103(1), 14-76. 11. Tsiatsikas, Z., Fakis, A., Papamartzivanos, D., Geneiatakis, D.,
Kambourakis, G., & Kolias, C. (2015, July). Battling against DDoS in SIP: Is Machine Learning-based detection an effective weapon?. In e-Business and Telecommunications (ICETE), 2015 12th International Joint Conference on (Vol. 4, pp. 301-308). IEEE. 12. C. Zhang, Z. Cai, W. Chen, X. Luo, and J. Yin, “Flow level detection
and filtering of low-rate DDoS,” Computer Networks, vol. 56, no. 15, pp. 3417–3431, 2012.
13. P. N.Jadhav and B. M. Patil, “Low-rate DDOS Attack Detection using Optimal Objective Entropy Method,” International Journal of Computer Applications, vol. 78, no. 3, pp. 33–38, 2013
14. Y. Xiang, K. Li, and W. Zhou, “Low-rate DDoS attacks detection and traceback by using new information metrics,” IEEE Transactions on Information Forensics and Security, vol. 6, no. 2, pp. 426–437, 2011 15. M. H. Bhuyan, D. K. Bhattacharyya, and J. K. Kalita, “ELDAT: a
lightweight system for DDoS flooding attack detection and IP traceback using extended entropy metric,” Security and Communication Networks, vol. 9, no. 16, pp. 3251–3270, 2016.
16. P. Du and S. Abe, “IP packet size entropy-based scheme for detection of DoS/DDoS attacks,” IEICE Transaction on Information and Systems, vol. E91-D, no. 5, pp. 1274–1281, 2008.
17. H. Sun, J. C. S. Lu, and D. K. Y. Yau, “Defending against low-rate TCP attacks: Dynamic detection and protection,” in Proceedings of the 12th IEEE International Conference on Network Protocols, ICNP 2004, pp. 196–205, October 2004
18. J. Luo, X. Yang, J. Wang, J. Xu, J. Sun, and K. Long, “On a mathematical model for low-rate shrew DDoS,” IEEE Transactions on Information Forensics and Security, vol. 9, no. 7, pp. 1069–1083, 2014 19. A. Shevtekar, K. Anantharam, and N. Ansari, “Low rate TCP
denial-of-service attack detection at edge routers,” IEEE Communications Letters, vol. 9, no. 4, pp. 363–365, 2005.
.AUTHORS PROFILE
R.Rathika M.Sc., MCA, M.Phil., (Ph.D)., Research Scholar, PG and Research Department of Computer Science, Government Arts College, Coimbatore, Tamilnadu.India