This is a repository copy of
Path-dependent initialization of a single quantum dot exciton
spin in a nanophotonic waveguide
.
White Rose Research Online URL for this paper:
http://eprints.whiterose.ac.uk/114170/
Version: Supplemental Material
Article:
Coles, R.J., Price, D.M., Royall, B. et al. (4 more authors) (2017) Path-dependent
initialization of a single quantum dot exciton spin in a nanophotonic waveguide. Physical
Review B, 95 (12). 121401(R) . ISSN 2469-9950
https://doi.org/10.1103/PhysRevB.95.121401
© 2017 American Physical Society. This is an author produced version of a paper
subsequently published in Physical Review B, 95, 121401(R). Uploaded in accordance
with the publisher's self-archiving policy.
[email protected] https://eprints.whiterose.ac.uk/
Reuse
Unless indicated otherwise, fulltext items are protected by copyright with all rights reserved. The copyright exception in section 29 of the Copyright, Designs and Patents Act 1988 allows the making of a single copy solely for the purpose of non-commercial research or private study within the limits of fair dealing. The publisher or other rights-holder may allow further reproduction and re-use of this version - refer to the White Rose Research Online record for this item. Where records identify the publisher as the copyright holder, users can verify any specific terms of use on the publisher’s website.
Takedown
If you consider content in White Rose Research Online to be in breach of UK law, please notify us by
exciton spin in a nanophotonic waveguide
R.J. Coles,1 D.M. Price,1 B. Royall,1 E. Clarke,2 M.S. Skolnick,1 A.M. Fox,1,∗ and M.N. Makhonin1,†
1Department of Physics and Astronomy, University of Sheffield, Sheffield, S3 7RH, UK. 2EPSRC National Centre for III-V Technologies,
Department of Electronic and Electrical Engineering, University of Sheffield, Sheffield S1 3JD, UK
Tu
n
a
b
le
Di
o
d
e
L
a
se
r
(8
8
6
n
m
)
8
0
8
n
m
Di
o
d
e
L
a
se
r
Spectrometer CCD
SPAD
S
P
A
D
Scanning Mirror
Scanning Mirror LP
Piezo Stages
LHe Bath Cryostat
Device Sample
Aspheric Lens
PC with SPCM
Superconducting Magnet Coil SBC
Bz Slit
Slit
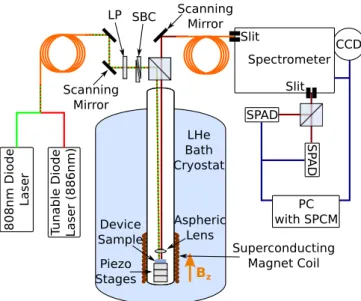
FIG. S1. Schematic diagram of the experimental appa-ratus. LP=Linear polarizer, SBC=Soleil-Babinet Compen-sator, CCD=Charge Coupled Device Camera, SPAD= Sin-gle Photon Avalanche Diode, SPCM=SinSin-gle Photon Count-ing Module.
SAMPLE DETAILS AND EXPERIMENTAL SETUP
The samples were grown by molecular beam epi-taxy on an undoped GaAs (100) wafer, comprising a 140 nm GaAs membrane with a single layer of InGaAs Quantum dot (QDs) at its centre, above a 1 µm sac-rificial Al0.6Ga0.4As layer on an undoped GaAs
sub-strate. The waveguide devices were fabricated by elec-tron beam lithography followed by an inductively coupled plasma etch through the GaAs membrane. The sacrificial Al0.6Ga0.4As layer was removed by an isotropic HF acid
etch to leave a free-standing waveguide. To confine only the single, fundamental TE-like mode to the waveguide the lateral dimensions used were 140×280 nm which correspond to λ/2n×λ/n. This rectangular cross sec-tion breaks the degeneracy between TE and TM modes, and ensures maximal confinement of the TE mode. The waveguides were 15µm long withλ/2nsemicircular grat-ing couplers at each end [1].
A schematic of the experimental setup is shown in Fig. S1. The sample is held at 4.2 K in a liquid
he-lium bath cryostat and a magnetic field Bz is applied normal to the device plane using a superconducting mag-net coil. QD photoluminescence (PL) was excited using an above GaAs bandgap 808 nm diode laser and/or a single mode diode laser tuned to a p-shell resonance of the QD. The polarization of the tunable laser was con-trolled using a motorized linear polarizer and a Soleil-Babinet compensator (SBC). A confocal microscopy sys-tem with two motorized scanning mirrors allows for in-dependent spatial control of quasiresonant and nonres-onant excitation lasers, and of PL detection. Both ex-citation and PL detection were through the same 0.5 NA focussing aspheric lens. A 0.75 m spectrometer with 1800 lines/mm grating diffracts the light onto a charge coupled device camera (CCD) to record PL spec-tra, whilst the same spectrometer also filters PL emis-sion for detection with single-photon avalanche photo-diodes (SPADs). Hanbury-Brown Twiss measurements were performed using a beamsplitter after the spectrom-eter with a SPAD in each output path, where a com-puter containing a single photon counting module inter-faced with the SPADs records the time-correlated single-photon detection events.
IDENTIFICATION OF QD WITH HIGH CHIRAL CONTRAST
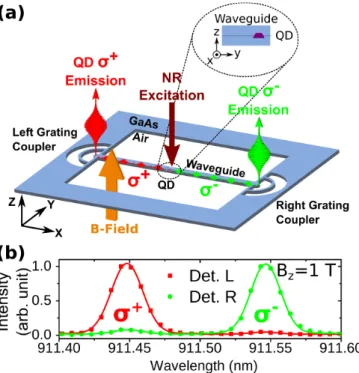
Selection of a QD, from a randomly positioned en-semble, which exhibits undirectional emission was first conducted using PL spectroscopy with nonresonant (NR) laser diode excitation at 808 nm under an applied mag-netic field of Bz = 1 T. This is shown schemati-cally in Fig. S2(a). The magnetic field lifts the degeneracy of the spin eigenstates of the QD exci-ton through the Zeeman effect and facilitates their identification via emission of circularly polarized pho-tons of different wavelength. Figure S2(b) shows PL spectra of a chirally-coupled QD when detecting PL emission from the grating couplers. Strong emission from respective Zeeman components (σ+/σ−) is
2
σ
+σ
-B
z=1 T
911.40 911.45 911.50 911.55 911.60 0.0
0.5 1.0
Wavelength (nm)
Det. L
Det. R
In
te
n
si
ty
(a
rb
.
u
n
it
)
B-Field
FIG. S2. (color online). (a) Schematic of the device structure and experimental arrangement for QD exciton spin readout. A cross section of the waveguide indicating the QD location within the waveguide. (b) PL spectra of the chirally coupled QD taken atBz= 1 T when detecting emission from each of
the two grating couplers (left,right labelled and shown with corresponding color).
intensity of the Zeeman componentsIσ+ andIσ− using
Cread det.l/r =
Il/rσ+−Il/rσ−
Il/rσ++Il/rσ−, (S1)
where the subscripts l/r refer to the left and right coupler from which PL emission is detected. Readout contrasts of Cread
det.l = 0.95±0.05 and Cdet.rread = −0.88±0.06 are observed from the left and right couplers respectively. These reduced readout contrasts compared to the ini-tialisation contrasts presented in the main text are at-tributed to longer duration spin memory under QR exci-tation. The small discrepancy in contrasts between left and right detection may arise from a slight asymmetry in the reflectivity of the grating couplers due to fabrication imperfections. From FDTD simulations we estimate that the coupling efficiency of circularly polarized PL emission from the QD to the waveguide mode propagating in one direction is 68% and 0% in the reverse direction at a C-point [2].
IDENTIFICATION OF X+ EMISSION
The PL spectrum of the QD studied in the main text under nonresonant (NR) excitation is shown in Fig. S3,
-7 -6 -5 -4 -3 -2 -1 0 1000
10000
X
-(-5.2 meV)
XX (-3.3 meV)
X
+
(-0.4 meV)
P
L
I
n
t
e
n
s
i
t
y
(
c
o
u
n
t
s
/
1
0
s
)
E
det.
- E
X 0 (meV)
X
0
FIG. S3. PL spectrum of the QD under NR excitation of powerPN R= 500 nW. Excitonic species are labelled
accord-ing to their energy separation from the neutral exciton,X0. Other spectral lines arise either from spatially adjacent QDs in the waveguide or additional unidentified transitions within the same QD. The horizontal axis plots the difference between the detection andX0emission energy.
where theX0 and XX states were identified from their
relative power dependences. The emission line under study in the main text is attributed to positively charged exciton recombination (X+ → h+) since it has no
de-tectable fine structure splitting and occurs 0.4 meV be-low theX0recombination energy, consistent with the
en-ergy range forX+ recombination [3,4] (X− is typically
5-7 meV to lower energy [5]). Indeed, the relative ener-gies of the various excitonic species in Fig. S3are in very good agreement with those presented in [3,4]. Further-more, for p-shell excitation, theX+line is only observed in the presence of additional NR excitation which creates the resident hole in the QD, further consistent with its attribution.
The spin states of X+ are |↓⇑⇓i and |↑⇑⇓i, where
↑,↓ and ⇑,⇓ denote electron and heavy hole spins re-spectively. These states correspond to residual hole spin states|⇓iand|⇑iwhereσ+andσ−photons are emitted,
on exciton recombination, to the left and right waveguide directions correspondingly.
IDENTIFICATION OF P-SHELL RESONANCE
Identification of the p-shell resonance was conducted using a photoluminescence excitation (PLE) experiment. A weak (∼10 nW) 808 nm laser was applied to the QD in the waveguide to create the additional hole for the X+→h+ transition and to stabilize the charge state of
32 34 36 38 40 42 44 46 48 50 5000
6000 7000 8000 9000
∆
E (meV)
E ~ 39 meV
FWHM~1.53 meV
1LO
GaAs
PL
E
I
n
te
n
si
ty
(
C
o
u
n
ts
/
1
0
s)
FIG. S4. PLE spectrum of the QD at the chiral point in the waveguide. The horizontal axis plots the energy difference between the laser excitation energy and detection at theX+
emission energy. A strong p-shell resonance is observed at ∆E=Eexc.−Edet.= 39 meV with linewidth∼1.53 meV.
of the QD PL peak at 911.5 nm recorded at each wave-length step. The PLE spectrum is shown in Fig. S4(a), where a strong absorption peak is seen at a detuning from the ground stateX+ emission of 39 meV, in
addi-tion to the weaker bulk GaAs 1LO phonon resonance at 36.6 meV. By comparison with very similar results pre-sented in [4], we attribute the intense peak at 39 meV to the p-shell resonance of theX+ in which both the
pho-togenerated electron and hole are in the p-shell excited states. The exciton then decays via fast LO phonon re-laxation to the X+ ground state, which accounts for its
broad PLE linewidth of 1.53 meV. The phonon emission process conserves spin, so p-shell excitation preserves the initial spin of the excited state [4]. The linewidth of the p-shell absorption exceeds the Zeeman energy splitting of the X+ transition at 1 T, E
z= 147µeV. This en-ables both spin components to be efficiently prepared by appropriately polarized p-shell excitation.
HANBURY-BROWN TWISS MEASUREMENTS
The single photon characteristic of the QD emission under the QR excitation scheme presented in the main text was confirmed by Hanbury-Brown Twiss (HBT) measurements. We compare second order autocorrela-tion funcautocorrela-tions of the QD emission for both excitaautocorrela-tion schemes, NR and QR in Fig. S5(a) and Fig. S5(b) re-spectively. For NR excitation, the autocorrelation func-tiong(2)(τ) showsg(2)(0) = 0.06±0.04. The
autocorre-(a)
-10 -5 0 5 10 0.0
0.2 0.4 0.6 0.8 1.0 1.2
g
(2
) (
τ
)
τ(ns)
(b)
-10 -5 0 5 10 0.0
0.2 0.4 0.6 0.8 1.0 1.2 1.4
g
(2
) (
τ
)
τ(ns)
FIG. S5. (a) Autocorrelation functiong(2)(τ) for NR exci-tation, which exhibitsg(2)(0) = 0.06±0.04 and (b)
autocor-relation function for QR excitation from the grating coupler yieldingg(2)(0) = 0.21±0.03. Raw data are plotted as
dis-crete black points whilst fits to the data are shown as solid red lines.
lation function for QR excitation demonstrates a slightly higher value ofg(2)(0) = 0.21±0.03. The increased value
ing(2)(0) under QR excitation is attributed to bunching
due to charge fluctuation under QR excitation conditions, similar to that seen previously under resonant excitation [6]. These results confirm that the single photon charac-ter of the QD emission is maintained under QR excita-tion.
POLARIZATION INDEPENDENCE OF SPIN INITIALISATION
ex-4
(a)
(b)
(c)
(d)
(e)
(f)
(g)
(h)
(i)
(i)
V
H
D
AD
σ
-σ
+
(k)
(l)
V
H
D
AD
σ
-σ
+
Detection L t
Detection Right
Min Max
PL Intensity
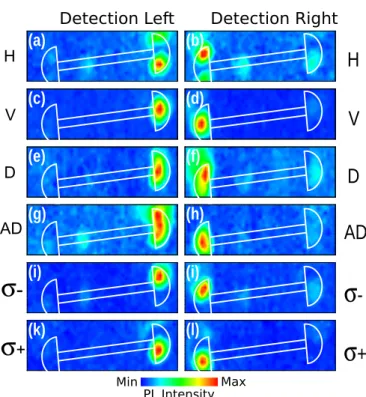
FIG. S6. Excitation maps obtained at Bz = 0 T using a
raster scan of the quasiresonant laser over the device, filtered at the QD emission wavelength of 911.5 nm. The same laser powers were used in all scans. In the left and right columns the position of detection is fixed at the left and right grating coupler respectively, when the QR laser polarization is (a)-(b) horizontal, (c)-(d) vertical, (e)-(f) diagonal, (g)-(h) antidiag-onal, (i)-(j) left circular, and (k)-(l) right circular. The po-larizations are defined relative to the horizontal axis of the apparatus. A schematic outline of the waveguide and coupler is added in white. The apparent rotation of the devices is due to a small rotation induced by the detection optics.
pected since the grating principally couples transversely polarized fields to the waveguide mode [6], so when the in-coming laser is also transversely polarized the field over-lap is maximized and the waveguide mode is excited with maximum efficiency. The polarization of the QR laser therefore determines the absolute intensity of the σ+/−
PL emission peaks, but not their relative intensity. FDTD simulations were performed to map the cou-pling efficiency of the grating couplers. A cross sectional modal field source in the waveguide emits into the waveg-uide mode, which is scattered out of the device plane by the coupler. A field monitor was positioned above the coupler which records the near fields. Analysis of the far field profiles was achieved using a near to far field trans-formation of the monitor field data within the software [7]. The comparison between experimental and simu-lation data is presented in Fig. S7 which shows the far field profiles of the grating couplers for experimental (left column) and simulated (right column) data. Good agree-ment is seen between the data which confirms the origin of the profiles of the PL map in Fig. S6. A slight
de-Experiment Simulation
H
V
D
AD
+
-H
V
D
AD
+
-Min Max
Intensity
FIG. S7. (left column) Excitation maps over the right grat-ing coupler when collectgrat-ing PL emission from the left gratgrat-ing coupler for a range of laser polarizations. (right column) Sim-ulated farfield profiles of scattered light from a grating coupler for a range of polarizations. In the simulated data, a convo-lution of the far fields of the grating coupler and a Gaussian beam is applied.
viation from simulation is observed for H polarization in experiment arises from poorer PL collection efficiency at large mirror deflections near the edge of the scan-ning window. polarization analysis was conducted, using Jones calculus, by calculating the transmitted intensity |Pθ,φE|2, whereEis the electric far field vector andPθ,φ is a polarization matrix given by:
Pθ,φ=
cos2θ sinθcosθe−iφ sinθcosθeiφ sin2θ
. (S2)
Here,θis the relative angle between the waveguide and the horizontal axis andφis the circularity of the polarizer (φ= 0 for linear andφ=±π/2 for circular). To enable a realistic comparison between experiment and simulation, these data were convolved with a 2D spatial Gaussian function which approximates the laser beam profile with FWHM∼1 µm.
the farfield profiles for y-polarization show a single peak near the centre of the coupler whereas x-polarized fields show two distinct peaks either side of the coupler. For diagonal and antidiagonal polarization, a broader spot is seen which overlaps the y-polarized peak and one of the two x-polarized peaks. For circular polarization a peak is seen only above or below the centre of the grating cou-pler. This observation is due to the opposing phase of the longitudinal electric field components of the waveg-uide mode above and below the wavegwaveg-uide axis.
∗ [email protected] † [email protected]
[1] A. Faraon, I. Fushman, D. Englund, N. Stoltz, P. Petroff,
and J. Vuckovic,Opt. Express16, 622 (2008).
[2] R. J. Coles, D. M. Price, J. E. Dixon, B. Royall, E. Clarke, P. Kok, M. S. Skolnick, A. M. Fox, and M. N. Makhonin,
Nat. Commun.7, 11183 (2016).
[3] E. Poem, Y. Kodriano, C. Tradonsky, B. D. Gerardot, P. M. Petroff, and D. Gershoni,Phys. Rev. B81, 85306 (2010).
[4] Y. Benny, Y. Kodriano, E. Poem, D. Gershoni, T. A. Truong, and P. M. Petroff, Phys. Rev. B 86, 085306 (2012).
[5] R. Warburton, C. Schaflein, D. Haft, F. Bickel, a. Lorke, K. Karrai, J. Garcia, W. Schoenfeld, and P. Petroff, Na-ture405, 926 (2000).
[6] M. N. Makhonin, J. E. Dixon, R. J. Coles, B. Royall, I. J. Luxmoore, E. Clarke, M. Hugues, M. S. Skolnick, and A. M. Fox,Nano Lett.14, 6997 (2014).
[7] Lumerical Solutions Inc.,“Lumerical FDTD solutions,”