This is a repository copy of How effective are interventions in improving dietary behaviour
in Low and Middle Income countries? A systematic review and meta-analysis..
White Rose Research Online URL for this paper: http://eprints.whiterose.ac.uk/131796/
Version: Accepted Version
Article:
Caperon, L orcid.org/0000-0001-5204-170X, Sykes-Muskett, B, Clancy, F et al. (3 more authors) (2018) How effective are interventions in improving dietary behaviour in Low and Middle Income countries? A systematic review and meta-analysis. Health Psychology Review, 12 (3). pp. 312-331. ISSN 1743-7199
https://doi.org/10.1080/17437199.2018.1481763
© 2018 Informa UK Limited, trading as Taylor & Francis Group. This is an Accepted Manuscript of an article published by Taylor & Francis in Health Psychology Review on 29th May 2018, available online: https://doi.org/10.1080/17437199.2018.1481763.
[email protected] https://eprints.whiterose.ac.uk/
Reuse
Items deposited in White Rose Research Online are protected by copyright, with all rights reserved unless indicated otherwise. They may be downloaded and/or printed for private study, or other acts as permitted by national copyright laws. The publisher or other rights holders may allow further reproduction and re-use of the full text version. This is indicated by the licence information on the White Rose Research Online record for the item.
Takedown
If you consider content in White Rose Research Online to be in breach of UK law, please notify us by
Running Head: Diet in LMICs Review
How effective are interventions in improving dietary behaviour in Low and Middle Income countries? A systematic review and meta-analysis
Lizzie Caperon1
Leeds Institute of Health Sciences, University of Leeds, Leeds, LS2 9JT, UK. +44(0)113 343 1688 [email protected]
Bianca Sykes-Muskett
School of Psychology, University of Leeds, Leeds, LS2 9JT, UK +44(0)113 343 9196 [email protected]
Faye Clancy
School of Psychology, University of Leeds, Leeds, LS2 9JT, UK +44(0) 07969493869 [email protected]
James Newell
Leeds Institute of Health Sciences, University of Leeds, Leeds, LS2 9JT, UK. +44(0)113 343 6950 [email protected]
Rebecca King
Leeds Institute of Health Sciences, University of Leeds, Leeds, LS2 9JT, UK. +44(0)113 343 6948 [email protected]
Andrew Prestwich
School of Psychology, University of Leeds, Leeds, LS2 9JT, UK. +44(0)113 343 8559 [email protected]
Abstract
Several interventions encouraging people to change their diet have been tested in low- and middle-income countries (LMICs) but these have not been meta-synthesised and it is not known which elements of these interventions contribute to their effectiveness. The current review addressed these issues. Randomized controlled trials of dietary interventions in LMICs were eligible and identified via 8 publication databases. Elements of both the intervention and comparison groups (e.g., behaviour change techniques (BCTs), delivery mode), participant characteristics and risk of bias were coded. Random effects meta-analysis of 76 RCTs found, on average, small- to medium-sized but highly heterogeneous
improvement in dietary behaviour following intervention. Small and homogeneous improvements were found for BMI/weight, waist- and hip-circumference, with medium-sized, but heterogeneous, improvements in blood pressure and cholesterol. Although many BCTs have yet to be tested in this context, meta-regressions suggested some BCTs (action planning, self-monitoring of outcome(s) of behaviour; demonstration of behaviour) as well as individually-randomized trials, adult- or hypertensive-samples and lack of blinding were associated with larger dietary behaviour effect sizes. Interventions to encourage people from LMICs to change their diet produce, on average, small-to-medium-sized effects. These effects may possibly be increased through the inclusion of specific BCTs and other study elements.
Non-communicable diseases (NCDs) are a leading cause of death globally, and deaths from NCDs are projected to increase significantly (WHO, 2011). The burden of NCDs is highest in low- and middle-income countries (LMICs) where over three quarters of global NCD deaths [30.7 million] occurred in 2015 (WHO, 2017). Unhealthy diet (high in salt, sugar and fat and low in fruits and vegetables) is one of the established behavioural risk factors for LMICs (Bhandari, Angdembe, Dhimal, Neupane & Bhusal, 2014; WHO, 2015).
While numerous interventions to improve dietary behaviour have been assessed in LMICs (Aira, Wang, Riedel & Witte, 2013; Bhurosy & Jeewon, 2013; Cakir & Pinar, 2006; Paes-Barreto et al., 2013; Pan et al., 1997; Wang, Stewart, Chang & Shi, 2015), they have not been meta-synthesised and it is not known which element(s) of the intervention have the greatest impact on behaviour. This is not the case for high come countries (HICs) where reviews have identified potentially effective dietary behaviour-change techniques such as self-monitoring of behaviour, problem solving, social support and goal setting (Brannon & Cushing, 2015; Lara et al., 2014; Michie, Abraham, Whittington, McAteer & Gupta, 2009).
One previous review has synthesised evidence regarding the effects of interventions to improve healthy eating, physical activity and smoking behaviours amongst low-income groups, finding a positive but small effect on all three behaviours (Bull, Dombrowski, McCleary & Johnston, 2014). Although this review is useful in highlighting that such behaviours can be changed in low-income groups, it did not elucidate the elements of the interventions or studies that influenced the magnitude of the effects. Furthermore, of the sixteen interventions assessed, the majority were in the USA and only one was in a LMIC [Chile].
may not be appropriate (Airhihenbuwa, 1995). However, there have been increasing attempts to make interventions contextually sensitive, such as in Nepal (KC et al., 2011; Shrestha et al., 2011), and in interventions designed to improve dietary behaviour within HICs (James, 2004; Resnicow et al., 2009).
In sum, previous reviews have not looked specifically at the effectiveness of behaviour change techniques in improving dietary behaviour of individuals residing in LMICs, or identified other elements of the study associated with effect sizes. Such elements include the intensity or duration of the intervention and characteristics of the sample, setting, comparison group or outcome measures used (Dombrowski, O'Carroll & Williams, 2016; Prestwich, Kenworthy & Conner, 2017). Some elements have been shown previously to be associated with the magnitude of health behaviour intervention effects such as the length or intensity of the intervention (e.g., Greaves et al., 2011), who delivers the intervention and the mode of delivery (e.g., Prestwich et al., 2017). Identifying such elements should enable the production of more successful interventions.
A further issue, as noted by Peters, de Bruin and Crutzen (2015), is that few reviews have taken into account the potential confounding between the elements of the intervention that appear to influence the treatment effect. Thus, certain elements of the intervention, such as specific behaviour change techniques, may only be related to treatment effect sizes
because the element is delivered consistently with other elements. However, a small number of recent reviews of BCTs (e.g., Prestwich et al. 2014, 2016) have identified potentially effective study elements (e.g., specific BCTs or modes of delivery), assessed their
co-occurrence and, when they co-occur, statistically controlled for each variable when testing the association between study elements and intervention effect sizes. If the elements remain significant predictors of effect sizes when controlling for one another, the elements are unlikely to be confounded. If the elements are rendered non-significant, the element(s) may be confounded. Taking these additional steps presents a more rigorous test of study and intervention elements and addresses in some way the issue of potential confounds. Objectives
(versus comparison conditions) on dietary behaviours of people living in LMICs; (2) to identify the behaviour change techniques and other elements that influence the effect of interventions on dietary behaviour; (3) to conduct a series of sensitivity analyses to test the impact of (a) the category of outcome variables used as a basis for effect size calculations; (b) outliers; (c) potential confounds between seemingly effective intervention elements; (d) risk of bias (including publication bias).
Method
This review was pre-registered in PROSPERO (registration number removed for blind review).
Search Strategy
A systematic search of the following eight databases was initially run in November 2015 and re-run in October 2017: Medline (Ovid), Embase (Ovid), PsycINFO (Ovid), Web of Science, The Cochrane Central Register of Controlled Trials (CENTRAL), CINAHL,
Popline, Global Health (Ovid) (see Online Supplementary Material, Web Table 1). The search terms were based on established filters used in Ovid databases to identify RCTs (Higgins & Green, 2011; Scottish Intercollegiate Guidelines Network, 2014; The Cochrane Collaboration, 2016) and studies conducted in LMICs (Brown, van Urk, Waller & Mayo-Wilson, 2014; The Cochrane Collaboration, 2012). Additional search terms were used for healthy eating. Keyword searches were transferred between databases where possible, though we adapted search strategies to the specific controlled vocabularies used in every database. Subject heading searching was used in every database where this was possible. Techniques such as truncation were also used to maximise search results. The search was not limited by English language to provide the widest coverage possible and all databases were searched as far back as they allowed (start dates ranged from 1971 to 1996).
Eligibility criteria
To be included in the review, studies had to: (1) use a Randomised Controlled Trial (RCT) design; (2) test the effects of an intervention to promote healthy eating or dietary behaviour even if this was not listed as the primary outcome; (3) assess dietary or healthy eating behaviour after at least some of the intervention had been delivered; (4) be tested in a LMIC [as defined by the World Bank economy classifications (The World Bank, 2017)] . Studies were excluded if they: (1) were not peer reviewed; (2) were protocols; (3) compared one type of diet against another; (4) promoted dietary supplements, vitamins, fasting, drugs or medical interventions; (5) included women who were pregnant or trying to conceive; or (6) were related to undernutrition.
Data Extraction
Studies were coded based on the published main trial paper and associated papers (e.g., protocol papers). The BCTs used in the interventions were coded by one reviewer using Michie et al.’s taxonomy of behaviour change techniques (2013) and checked by a second reviewer, with discrepancies discussed between the two reviewers to meet consensus. Both reviewers had completed the online BCT taxonomy training (BCT Taxonomy, 2015). Checks of statistical information (e.g., effect size calculations; corrections for clustering) were conducted by a co-author. Extracted data on bias were checked by a second reviewer and any discrepancies in decisions resolved by discussion and consensus. All coders were experienced in extracting data for systematic reviews. Statistical information were checked for all 76 studies; checks of other information were conducted on the first 55 studies (i.e., all studies identified in the initial search).
Characteristics of Interventions
characteristics of the sample (including any pre-existing condition of the sample population). This data was extracted for intervention and control groups.
Assessment of risk of bias in included studies
The Cochrane Collaboration’s tool for assessing risk of bias (Higgins & Green, 2011)
was used. Data were extracted on randomisation, blinding, allocation concealment, selective outcome reporting and other bias concerns. Randomisation sequence generation was coded as low risk when randomisation methods such coin toss were recorded (otherwise, high risk). Blinding was assessed as adequate when a suitable method of blinding was employed. If blinding was not claimed, or it was judged that it could be easily broken, it was rated inadequate (high risk). Allocation concealment was coded as low risk of bias when it was judged that participants and researchers were unable to predict their allocation to a particular intervention. If an unconcealed procedure was used, it was coded as high risk. Selective outcome reporting was judged as low risk where the study protocols (or related papers) were available and expected outcomes were documented. Selective outcome reporting was
classified as high risk where there were differences between measures specified
pre-intervention and those reported after the pre-intervention. For all of these risk of bias variables, a
code of ‘unclear’ was assigned when relevant methods were not adequately described. Other
bias concerns related to steps taken to reduce contamination, not obtaining informed consent or ethical approval, not using inclusion/exclusion criteria and attrition rates.
Data Synthesis
Comprehensive Meta-Analysis (Borenstein, Hedges, Higgins, Rothstein &
sample size by the design effect) were employed (the means and standard deviations
remained the same). For proportion data, the standard errors for effect sizes were corrected (by multiplying the original standard error by the square root of the design effect) to avoid issues linked with rounding participants to whole numbers. In these calculations, the design effect was calculated using the formula: 1 + (M - 1) ICC, where M = the average cluster size (total sample size divided by the number of clusters) and ICC represents the intracluster correlation coefficients (Higgins & Green, 2011 p.16.3.4). When reported, the original ICCs were used, otherwise ICCs were estimated to be 0.05 (see Michie et al., 2009).
Effect sizes were calculated based on five types of dietary behaviour outcome: (1) self-reported behaviour and physiological measures closely linked with behaviour (e.g., blood sugar; cholesterol) which we treated as the primary outcome; (2) self-reported behaviour only; (3) self-reported behaviour, physiological measures closely linked with behaviour and more general outcomes linked with dietary behaviour (e.g., weight, fat mass); (4) self-reported fruit and vegetable intake; (5) self-self-reported fat intake. Physical outcomes (BMI/weight; waist and hip sizes; blood pressure; cholesterol) were also assessed as additional secondary outcomes.
Random-effects meta-analyses and random effects meta-regressions were conducted in STATA version 13.1 to ascertain overall effects and the association between
study/intervention elements and effect sizes. In the meta-analyses, Hedges’s g was used as
the index of effect size as it is more appropriate than Cohen’s d for small sample sizes.
positive changes in diet effect sizes than studies not using this BCT uniquely in their intervention condition.
A series of sensitivity analyses were conducted to test the impact of (a) the choice of dependent variables used as a basis for effect size calculations (listed above) (b) removing outliers based on the Sample-Adjusted Meta-Analytic Deviancy (SAMD) Statistic (Huffcutt & Arthur, 1995) (c) potential confounding between seemingly effective elements; (d) risk of
bias (including publication bias assessed using Egger’s regression, Egger, Smith, Schneider
& Minder, 1997).
Results
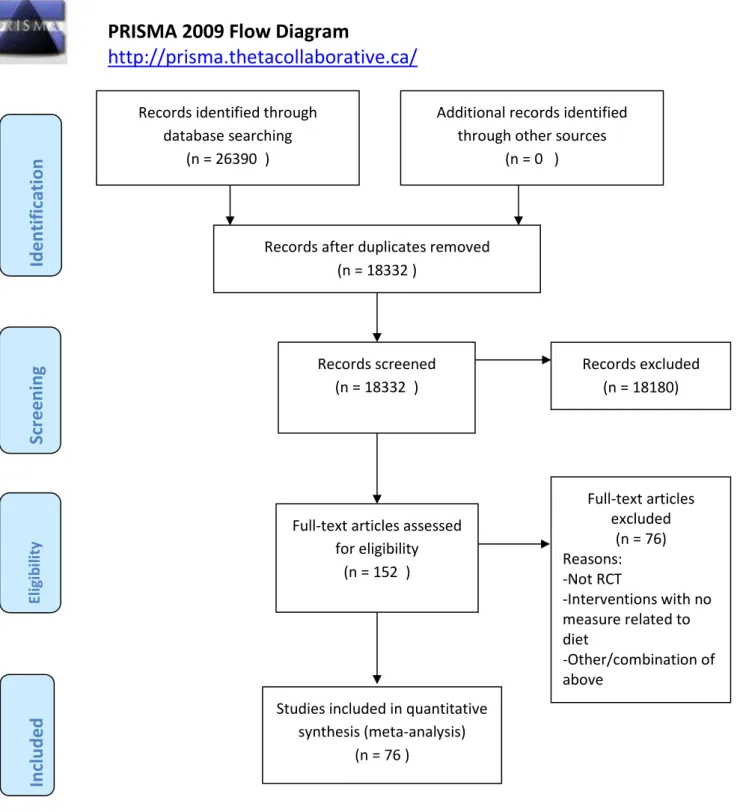
The numbers of studies considered at each stage of the review are shown in Figure 1. Study characteristics
Across the 76 included studies, in roughly half participants had a pre-existing condition (k = 39). Most commonly, participants were overweight or obese (k = 17), had diabetes or impaired glucose intolerance (k = 10), or hypertension (k = 6). Thirty-seven studies were conducted on individual adults, 29 on individual children, 9 on family groups and one on a group of children. Educational (k = 37), medical (k = 20) and community (k = 15) settings were used most often. The studies were conducted in Asia (k = 26), South
America (k = 21), the Middle East (k = 16), Africa (k = 10), Europe (k = 2) and the Caribbean (k = 1). The country with the most interventions was Brazil (k = 12), followed by Iran (k = 11) and China (k = 9). The average sample size of the studies was 267. The methodological quality of the studies was mixed. In 49 studies, randomisation was adequate. Furthermore, only 6 studies clearly reported that they used allocation concealment, 19 reported any form of blinding and 3 studies took measures to protect against contamination. The Online
Supplementary Material Web Table 2 summarises the major characteristics of each study.
Syntheses of results
henceforth referred to as the ‘primary outcome’ (k = 67). Of these studies, most comprised
general measures of diet quality or combinations of multiple facets of diet (41 studies, 61.2%). The remaining studies comprised physiological measures directly linked with diet only (9 studies, 13.4%), self-reported measures of fruit and vegetable intake only (11 studies, 16.4%) or other (e.g., salt intake only, 6 studies, 9.0%). This index was chosen as the
primary outcome as it reflects dietary behaviour defined broadly which maximises the number of studies included in the analyses. Moreover, comparing the sub-groups of measures in random effects meta-analysis suggested the effect sizes were similar across the measures (g = .35, g = .33, g = .35, g = .33, respectively). Meta-regressions formally
revealed no association between the use of these 4 sub-types of dietary outcome (which were combined to create the primary outcome) and study effect size (all p’s > .81; with outliers excluded all p’s > .38). Overall, meta-analyses of 67 studies revealed small-to-medium sized improvement in the primary outcome attributable to the intervention (g = .35, 95% CI = .27, .42), and high heterogeneity in effect sizes (I2 = 76.6%, 2(66) = 281.63, p < .001) (see Figure 2). When outliers were removed, the effect size was smaller (g = .31, 95% CI = .24, .37) with moderate-to-high heterogeneity (I2= 62.0%, 2(63) = 165.72, p < .001).
Effect of BCTs on dietary behaviour
Across all studies, 50 out of the 93 BCTs listed in the BCT Taxonomy v1 were not differentially employed across the experimental and comparison groups; thus these BCTs were not testable. For reasons of power, reducing multiplicity and ease of interpretation, the reported analyses are based only on BCTs used differentially across the experimental and comparison groups in at least 4 studies (> 5% of all studies). Regarding ease of
interpretation, for example, social support (emotional) emerged as being associated with larger effect sizes in some of the analyses. However, this BCT was used solely in the intervention in one study. Evidence supporting the use of this BCT to promote healthy dietary intake in LMICs, therefore, remains particularly limited. The full dataset is provided online should readers wish to explore the BCTs used less often. Applying the 5% criterion left 20 testable BCTs.
such that studies that incorporated these BCTs within their intervention conditions (and not in the comparison conditions) produced greater improvement in dietary behaviour than those which did not (see Table 1).
Effect of other intervention elements/study characteristics on dietary behaviour
On the primary outcome, larger effect sizes were generated in studies targeting adults rather than children, individually randomized trials (versus cluster trials) and in studies not reporting any form of blinding and in those specifically failing to blind the data analyst. Larger effect sizes were also reported in studies conducted in the Middle East and in
hypertensives, with smaller effects in face-to-face interventions but none of these predictors were robust when outliers were removed (see Table 2).
Sensitivity analyses 1 and 2: Effect of category of dependent variable and Outliers
Outliers were identified using scree plots (see Online Supplementary Material, Web Figure 1). Removing these outliers impacted the findings in several ways (the results with the outliers removed are presented in parentheses). Compared to the effect sizes based on the primary outcome, the overall improvements in dietary behaviour arising from intervention were similar when based only on self-reported dietary outcomes, g = .36, 95% CI = .27, .44 (g = .31, 95% CI = .24, .38). When the outcomes were expanded to the broadest index (self-reported dietary outcomes, physiological outcomes directly linked to diet (e.g., blood sugar and cholesterol) and more distal outcomes (e.g., weight, shape and blood pressure)
combined), g = .32, 95% CI = .25, .39 (g = .26, 95% CI = .21, .31) or focused on self-reported fruit and vegetable intake only, g = .30, 95% CI = .20, .41 (g = .24, 95% CI = .16, .32), the effect sizes representing the extent to which dietary behaviour improved following intervention were slightly smaller. These effect sizes were smallest when based on self-reported fat intake, g = .21, 95% CI = .07, .35 (g = .13, 95% CI = .03, .24). In all instances, heterogeneity was high prior to outlier removal: broadest index of diet, I2= 75.9%, 2(75) = 310.70, p < .001; self-reported diet, I2= 78.7%, 2(57) = 267.39, p < .001, fruit and vegetable intake, I2= 75.4%, 2(28) = 113.87, p < .001; fat intake, I2= 81.5%, 2(23) = 124.04, p < .001, and more moderate when outliers were removed: broadest index of diet (I2 = 47.6%,
vegetable intake (I2= 49.4%, 2(27) = 53.34, p = .002), and fat intake (I2= 61.9%, 2(21) = 55.08, p < .001).
The effects of action planning (BCT 1.4) were robust across all secondary behavioural outcomes except fat intake for which there were fewest tests (see Table 2). Self-monitoring of outcome(s) of behaviour (BCT 2.4), which was positively associated with the primary outcome, became non-significant across all of the other outcomes. However, demonstration of behaviour (BCT 6.1) was at least marginally positively associated with effect size for three of the secondary outcomes. A few other BCTs were positively associated with effect size (e.g., goal setting, BCT 1.1) but these effects were driven by a small number of outlier studies on the secondary outcomes (with their effects becoming non-significant when the outliers were removed). Two BCTs (social support (practical) BCT 3.2; re-structuring the physical environment, BCT 12.1) were negatively associated with fruit and vegetable outcomes suggesting interventions that comprised these BCTs for this particular type of outcome yielded smaller effects than interventions not comprising these BCTs.
Aside from the fat intake outcome (which consisted of the fewest tests), the effects of non-BCT study characteristics on the secondary outcomes were similar to those on the primary outcome. Specifically, the effects of the intervention target (adults versus children) and randomization type (cluster versus individual) were robust across the three remaining secondary outcomes (self-reported diet, combining all outcomes, self-reported fruit and vegetable intake). Studies targeting hypertensives also generated larger effect sizes on two secondary outcomes (the combined outcome and fruit and vegetable intake). Blinding (data analyst; intervention deliverer) reduced two secondary outcome effect sizes (combined outcome; self-reported diet). Studies conducted in the Middle East again produced larger effect sizes only when outliers were included (and only on the self-reported fruit and vegetable intake outcome).
Sensitivity analysis 3: Confounding between potentially effective elements
Action planning (BCT 1.4) was more likely to be applied uniquely in the intervention condition within individually randomized trials than cluster trials. When accounting for this in multivariate meta-regressions, action planning was a marginally significant predictor (the primary outcome: B = .14, SE = .08, p = .09; self-reported diet: B = .14, SE = .08, p = .09; fruit and vegetable intake: B = .25, SE = .13, p = .07). Self-monitoring of outcomes of behaviour (BCT 2.4) and demonstration of the behaviour (BCT 6.1) were unrelated with other significant elements and thus were at limited risk of confounding.
In addition, children were more likely to participate in cluster trials than adults. When these variables were entered together, the pattern of results varied across measures. They rendered each other non-significant (for the primary outcome and self-reported diet) or only intervention target (for the ‘all outcomes’ index, B = .07, SE = .03, p = .03) or type of randomization (for fruit and vegetable intake, B = .19, SE = .09, p = .03) were significant.
Sensitivity Analysis 4: Risk of bias (including publication bias)
Studies that claimed blinding (any form, of the data analyst or of the person delivering the intervention) yielded smaller effect sizes in at least some of the analyses. However, these risk of bias elements were unrelated to other elements of the studies that were found to be positively related with study effect size (see Table 3). Thus, risk of bias was not co-varied alongside other study elements that influenced effect sizes.
Egger’s regression suggested that there was a risk of publication bias (p = .004) (see
Figure 3). When accounting for this using trim-and-fill analysis, the effect of dietary
interventions on dietary behaviour was reduced to a small but still significant effect size (g = .19, 95% CI = .10, .27).
Physical outcomes
Several studies examined intervention effects on a number of physical outcomes. These revealed largely small effects. Where the effect sizes were heterogeneous we checked for outliers (results with outliers removed are presented in parentheses).
size, g = .20, 95% CI = .11, .29, k = 17, I2= 0%, 2(16) = 13.92, p = .61, and hip size, g = .20, 95% CI = .02, .37, k = 6, I2= 45.7%, 2(5) = 9.21, p = .10. Larger but highly heterogeneous effect sizes were detected for blood pressure, g = .52, 95% CI = .28, .75, k = 16, I2 = 92.0%,
2(15) = 187.87, p < .001 (g = .31, 95% CI = .16, .46, k = 15) and cholesterol, g = .40, 95%
CI = .22, .58, k = 17, I2= 80.9%, 2(16) = 83.7, p < .001 (g = .43, 95% CI = .25, .61, k = 16).
Discussion
Approximately half of the studies (33/67) produced effects of interventions on the primary dietary behaviour outcome that were reasonably small (g < .30), rising to more than half of the studies (44/76) based on the broader index of dietary behaviour. While suggesting it can be difficult to promote healthy dietary behaviour in LMICs, the overall effect size was small-to-medium on average and the effects were significantly heterogeneous. As such, under certain circumstances, larger (and smaller) effects can be achieved. Significant heterogeneity could be partly attributable to variations in the behavioural outcomes across studies but the average effect sizes for the four different types of behavioural outcomes were remarkably similar (g = .33 - .35). The heterogeneity could also be reflective of meaningful differences in intervention content, participant or other study characteristics. Indeed, our findings suggest action planning (BCT 1.4), self-monitoring of outcome(s) of behaviour (BCT 2.4) and demonstration of the behaviour (BCT 6.1) may increase the effects of the interventions on dietary behaviour. Other BCTs emerged as significant predictors in some analyses but were driven by outliers. Studies that did not use blinding, randomized individuals or targeted adults also produced larger intervention effects. However, these elements were unrelated or had little impact on the three potentially effective BCTs (1.4, 2.4 and 6.1) suggesting the effects of the BCTs on dietary outcomes were not confounded with other (non-BCT) study elements. The effects of the interventions on specific physical outcomes (BMI/weight, waist- and hip-size) were consistently small, displaying non-significant heterogeneity.
While it is difficult to compare across studies given variations in inclusion/exclusion and other characteristics, the findings of this review are somewhat consistent with the findings from reviews which have looked at the effectiveness of BCTs in dietary
behaviour reviews focused primarily in HICs (self-monitoring: Harkin et al., 2016; Michie et al., 2009; demonstration of the behaviour: French et al., 2014; Hartmann-Boyce et al., 2014; action planning: Adriaanse, Vinkers, De Ridder, Hox & De Wit, 2011; Prestwich, Sheeran, Webb & Gollwitzer, 2015).
In some of our analyses, larger effects were seen in hypertensives, which may suggest a more urgent desire for such populations to improve their dietary behaviour. Intensity, duration, mode of delivery or the type of personnel delivering the intervention had little impact on the magnitude of dietary intervention effects. Although caution is necessary when interpreting null effects, similar effects across different modes of delivery and levels of intensity suggest governments and health departments could consider implementing the effective BCTs identified in our review even when resources are scarce, selecting
contextually and culturally appropriate modes or methods that meet feasibility criteria for public health interventions in LMICs (Walley et al., 2010). Similarly, as effect sizes were equivocal when the intervention targeted multiple health behaviours or just diet, it may be more beneficial to target dietary behaviours alongside other health behaviours, especially were doing so requires little or no extra cost.
BCTs were utilized uniquely in either the intervention or comparison condition in at least 4 studies. Thus, most BCTs were used very infrequently, if at all.
In the absence of systematic coding of the theoretical basis of the dietary interventions and its application using a suitable method (e.g., the Theory Coding Scheme, Michie & Prestwich, 2010), and the potential difficulties of analysing such data such as poor reporting in the primary studies (see Prestwich, Webb, & Conner, 2015), we can only offer tentative suggestions about the utility of specific types of theory. Theories which are consistent with the use of action planning (as a specific form of goal-setting) and monitoring of goal progress
such as Carver and Scheier’s (1982) Control Theory may provide a useful basis for dietary
interventions in LMICs. However, experimental tests of such theories are needed to confirm its potential in LMICs, taking account of other Control Theory-consistent BCTs including feedback on current performance versus set goals which can catalyse improved performance.
The review has further limitations. First, there is a possibility that coding errors were made as coding BCTs according to Michie et al.’s taxonomy (2013) can be subject to errors due to the subjectivity of coders (Wood et al., 2015). However, this review took measures to minimise potential coding and/or interpretative errors by ensuring all coding was checked by a second reviewer and that components within comparison conditions were also coded and accounted for within the analyses. Taking account of the content of the comparison condition has not always been done in other reviews looking at whether BCTs can positively affect health behaviours (Dombrowski et al., 2012; Michie et al., 2009). There is also the
assumption that what is reported in the articles accurately represents what actually happened in each RCT. This may not be the case because of inadequate fidelity and/or reporting which would serve to potentially reduce the strength of the detected associations between study elements and effect size. We attempted to minimise the impact of inadequate reporting by also taking into account in our coding any materials (e.g., protocols, secondary outcome papers) reporting additional methodological or statistical details.
non-published articles lack peer review and, when incorporated into BCT reviews, may be more likely to contain incomplete or insufficient information which reduces the reliability of coding. Furthermore, despite evidence of some publication bias in this review, the effect of interventions on dietary behaviour remained significant when publication bias was accounted for in the effect size estimate.
Third, varied outcome measures were used to assess the wide-ranging interventions. To control for this issue, we categorised the outcomes in five ways (self-reported measures only (e.g., portions of fruit consumed daily); self-reported measures plus physiological measures closely linked with dietary behaviour (such as blood glucose levels); self-reported measures, dietary behaviour-related physiological measures and other physiological measures (such as blood pressure) combined; reported fruit and vegetable intake only;
self-reported fat intake only) and considered the impact of these categorisations in sensitivity analyses. Moreover, the sub-types of outcome which were combined for the primary outcome did not differ in their effect size according to meta-regression analyses.
Finally, we did not examine the effects of combinations of BCTs. Statistical
approaches (e.g., meta-CART; Li, Dusseldorp & Meulman, 2017) can consider interactions but require large number of studies that include interventions that combine the desired BCTs.
This review is, to the best of our knowledge, the first to consider the effectiveness of BCTs and other intervention elements for dietary behaviour changes in LMICs and has several key findings. First, the interventions produce, on average, small-to-medium sized improvements in dietary behaviour. Second, how the intervention is delivered (the BCTs utilized, the type of randomization) can influence the degree of dietary behaviour change; future dietary interventions conducted in LMICs may benefit from utilising action planning, demonstrating the behaviour and self-monitoring of the outcome(s) of behaviour. Third, the effects may vary depending on to whom the intervention was delivered (with larger effects for hypertensives and adults). Fourth, other intervention or study characteristics (such as mode of delivery) were largely unrelated with dietary intervention effects. Fifth, the majority of BCTs
from Michie et al.’s (2009) taxonomy were not testable within the meta-analyses and thus
HICs may be similarly effective in LMICs. This review, therefore, may aid those who wish to develop more effective dietary change interventions in LMICs and highlights evidence gaps.
References
Adriaanse, M., Vinkers, C., De Ridder, D., Hox, J. & De Wit, J. (2011). Do implementation intentions help to eat a healthy diet? A systematic review and meta-analysis of the empirical evidence. Appetite, 56(1), 183-193.
doi:http://dx.doi.org/10.1016/j.appet.2010.10.012
Aira, T., Wang, W., Riedel, M. & Witte, S. S. (2013). Reducing risk behaviors linked to noncommunicable diseases in Mongolia: A randomized controlled trial. American Journal of Public Health, 103(9), 1666-1674.
Airhihenbuwa, C. O. (1995). Health and culture: Beyond the Western paradigm: Sage. Bhandari, G. P., Angdembe, M. R., Dhimal, M., Neupane, S. & Bhusal, C. (2014). State of
non-communicable diseases in Nepal. BMC Public Health, 14(1), 1-9. doi:10.1186/1471-2458-14-23
Bhurosy, T. & Jeewon, R. (2013). Effectiveness of a Theory-Driven Nutritional Education Program in Improving Calcium Intake among Older Mauritian Adults. Scientific World Journal. doi:10.1155/2013/750128
Borenstein, M., Hedges, L., Higgins, J., Rothstein, H. & Englewood, N. (2005). Comprehensive Meta-Analysis Version 2,. NJ, Englewood: Biostat.
Brannon, E. E. & Cushing, C. C. (2015). A Systematic Review: Is There an App for That? Translational Science of Pediatric Behavior Change for Physical Activity and Dietary Interventions. Journal of Pediatric Psychology, 40(4), 373-384.
doi:10.1093/jpepsy/jsu108
Brown, T. W., van Urk, F. C., Waller, R. & Mayo-Wilson, E. (2014). Centre-based day care for children younger than five years of age in low- and middle-income countries. Cochrane Database of Systematic Reviews(9).
doi:10.1002/14651858.CD010543.pub2
smoking behaviours? A systematic review and meta-analysis. BMJ Open, 4(11). doi:10.1136/bmjopen-2014-006046
Cakir, H. & Pinar, R. (2006). Randomized controlled trial on lifestyle modification in hypertensive patients...including commentary by: Clark AM and response by Pinar and Cakir. Western Journal of Nursing Research, 28(2), 190-215 126p.
Carver, C. S., &Scheier, M. F. (1982). Control theory: A useful conceptual framework for personality, social,clinical and health psychology. Psychological Bulletin, 92, 111– 135.
Cohen, J. (1988). Statistical Power Analysis for the Behavioral Sciences, 2nd edition. New Jersey: Erlbaum.
Dombrowski, S. U., O'Carroll, R. E. & Williams, B. (2016). Form of delivery as a key ‘active
ingredient’ in behaviour change interventions. British Journal of Health Psychology,
21(4), 733-740. doi:10.1111/bjhp.12203
Dombrowski, S. U., Sniehotta, F. F., Avenell, A., Johnston, M., MacLennan, G. & Araújo-Soares, V. (2012). Identifying active ingredients in complex behavioural interventions for obese adults with obesity-related morbidities or additional risk factors for co-morbidities: a systematic review. Health Psychology Review, 6(1), 7-32.
doi:10.1080/17437199.2010.513298
Egger, M., Smith, G. D., Schneider, M. & Minder, C. (1997). Bias in meta-analysis detected by a simple, graphical test. BMJ, 315(7109), 629-634. doi:10.1136/bmj.315.7109.629 French, D.P., Olander, E.K., Chisholm, A., & McSharry, J. (2014). Which behaviour change
techniques are the most effective at increasing older adults’ self-efficacy and physical
activity behaviour? A systematic review. Annals of Behavioral Medicine, 48, 225-234.
Harkin, B., Webb, T.L., Chang, B.P.I., Prestwich, A., Conner, M., Kellar, I., Benn, Y., & Sheeran, P. (2016). Does monitoring goal progress promote goal attainment? A meta-analysis of the experimental evidence. Psychological Bulletin, 142(2), 198-229. Hartmann-Boyce, J., Johns, D.J., Jebb, S., & Aveyard, P. (2014). Effect of behavioural
techniques and delivery mode on effectiveness of weight management: systematic review, meta-analysis and meta-regression. Obesity Reviews, 15, 598-609.
Higgins, J. & Green, S. (2011). Cochrane Handbook for Systematic Reviews of Interventions Version 5.1.0. Retrieved from www.cochrane-handbook.org
Higgins, J. P. T., Thompson, S. G., Deeks, J. J., & Altman, D. G. (2003) Measuring inconsistency in meta-analyses. British Medical Journal, 327, 557-560.
Huffcutt, A. I. & Arthur, W. (1995). Development of a new outlier statistic for meta-analytic data. Journal of Applied Psychology, 80(2), 327-334.
doi:10.1037/0021-9010.80.2.327
James, D. (2004). Factors influencing food choices, dietary intake, and nutrition-related attitudes among African Americans: Application of a culturally sensitive model. Ethnicity & Health, 9(4), 349-367. doi:10.1080/1355785042000285375
KC, N., KC, A., Sharma, N., Malla, H., Thapa, N., Aryal, K., . . . Bhandari, R. (2011). Community participation and mobilization in community-based maternal, newborn and child health programmes in Nepal. Journal of Nepal Health Research Council. Lara, J., Evans, E. H., O’Brien, N., Moynihan, P. J., Meyer, T. D., Adamson, A. J., . . .
Mathers, J. C. (2014). Association of behaviour change techniques with effectiveness of dietary interventions among adults of retirement age: a systematic review and meta-analysis of randomised controlled trials. BMC Medicine, 12(1), 177. doi:10.1186/s12916-014-0177-3
Li, X., Dusseldorp, E. & Meulman, J. J. (2017). Meta-CART: A tool to identify interactions between moderators in meta-analysis. British Journal of Mathematical and Statistical Psychology, 70(1), 118-136. doi:10.1111/bmsp.12088
Michie, S., & Prestwich, A. (2010). Are interventions theory-based? Development of a Theory Coding Scheme. Health Psychology, 29, 1-8.
Michie, S., Richardson, M., Johnston, M., Abraham, C., Francis, J., Hardeman, W., . . . Wood, C. E. (2013). The Behavior Change Technique Taxonomy (v1) of 93 Hierarchically Clustered Techniques: Building an International Consensus for the Reporting of Behavior Change Interventions. Annals of Behavioral Medicine, 46(1), 81-95. doi:10.1007/s12160-013-9486-6
Paes-Barreto, J. G., Barreto Silva, M. I., Qureshi, A. R., Bregman, R., Cervante, V. F., Carrero, J. J. & Avesani, C. M. (2013). Can renal nutrition education improve adherence to a low-protein diet in patients with stages 3 to 5 chronic kidney disease? Journal of Renal Nutrition, 23(3), 164-171 168p. doi:10.1053/j.jrn.2012.10.004 Pan, X.-R., Li, G.-W., Hu, Y.-H., Wang, J.-X., Yang, W.-Y., An, Z.-X., . . . Howard, B. V.
(1997). Effects of Diet and Exercise in Preventing NIDDM in People With Impaired Glucose Tolerance: The Da Qing IGT and Diabetes Study. Diabetes Care, 20(4), 537-544. doi:10.2337/diacare.20.4.537
Prestwich, A., Kellar, I., Conner, M., Lawton, R., Gardner, P. & Turgut, L. (2016). Does changing social influence engender changes in alcohol intake? A meta-analysis. Journal of Consulting and Clinical Psychology, 84(10), 845-860.
doi:10.1037/ccp0000112
Prestwich, A., Kellar, I., Parker, R., MacRae, S., Learmonth, M., Sykes, B., . . . Castle, H. (2014). How can self-efficacy be increased? Meta-analysis of dietary interventions. Health Psychology Review, 8(3), 270-285. doi:10.1080/17437199.2013.813729 Prestwich, A., Kenworthy, J. & Conner, M. (2017). Health Behavior Change: Theories,
Methods and Interventions. Abingdon: Routledge.
Prestwich, A., Moore, S., Kotze, A., Budworth, L., Lawton, R., & Kellar, I. (2017). How can smoking cessation be induced before surgery? A systematic review and meta-analysis of behaviour change techniques and other intervention characteristics. Frontiers in Psychology, 8, 915.
Research and practice with social cognition models (3rd ed., pp. pp. 321-357). Maidenhead: Open University Press.
Prestwich, A., Webb, T.L., & Conner, M. (2015). Using theory to develop and test interventions to promote changes in health behaviour: evidence, issues and recommendations. Current Opinion in Psychology, 5, 1-5.
Resnicow, K., Davis, R., Zhang, N., Strecher, V., Tolsma, D., Calvi, J., . . . Cross Jr, W. E. (2009). Tailoring a fruit and vegetable intervention on ethnic identity: Results of a randomized study. Health Psychology, 28(4), 394-403. doi:10.1037/a0015217 Scottish Intercollegiate Guidelines Network. (2014). Sign Search filters for Systematic
Reviews. Retrieved from http://www.sign.ac.uk/methodology/filters.html#random Shrestha, B. P., Bhandari, B., Manandhar, D. S., Osrin, D., Costello, A. & Saville, N. (2011).
Community interventions to reduce child mortality in Dhanusha, Nepal: study protocol for a cluster randomized controlled trial. Trials, 12(1), 136.
The Cochrane Collaboration. (2012). Low and middle income countries—LMIC filters. Retrieved from http://epoc.cochrane.org/lmic-filters
The Cochrane Collaboration. (2016). RCT filters for different databases. Retrieved from http://work.cochrane.org/rct-filters-different-databases
The World Bank. (2017). World Bank Country and Lending Groups. Retrieved from https://datahelpdesk.worldbank.org/knowledgebase/articles/906519-world-bank-country-and-lending-groups
Wan, X., Wang, W., Liu, J. & Tong, T. (2014). Estimating the sample mean and standard deviation from the sample size, median, range and/or interquartile range. BMC Medical Research Methodology, 14(1), 135. doi:10.1186/1471-2288-14-135 Wang, D., Stewart, D., Chang, C. & Shi, Y. (2015). Effect of a school-based nutrition
education program on adolescents' nutrition-related knowledge, attitudes and behaviour in rural areas of China. Environmental Health and Preventive Medicine, 20(4), 271-278.
WHO. (2015). Noncommunicable diseases: Fact sheet. Retrieved from http://www.who.int/mediacentre/factsheets/fs355/en/
WHO. (2017). NCD mortality and morbidity. Global Health Observatory (GHO) data. Retrieved from http://www.who.int/gho/ncd/mortality_morbidity/en/
Wood, C. E., Richardson, M., Johnston, M., Abraham, C., Francis, J., Hardeman, W. & Michie, S. (2015). Applying the behaviour change technique (BCT) taxonomy v1: a study of coder training. Translational Behavioral Medicine, 5(2), 134-148.
doi:10.1007/s13142-014-0290-z
Dietary Behaviour in LMICs Review
24 Table 1: Meta-regressions. BCTs regressed on dietary behaviour effect sizes
___________________________________________________________________________________________________________________
Use of each BCT across all studies included in the review (k = 76)
Self-report & physiological outcomes directly linked with behaviour
Inc. outliers (k = 67) Exc. outliers (k = 64)
Self-reported diet only
Inc. outliers (k = 58) Exc. outliers (k = 55)
Intervention
only (+1)
Neither condition or both (0)
Control only
(-1)
beta Std. error
p-value
beta Std. error
p-value
beta Std. error
p-value
beta Std. error
p-value
1.1 Goal setting (behaviour) 17 58 1 .13 .09 .16 .10 .08 .21 .05 .12 .65 .00 .10 .98 1.2 Problem solving 12 64 0 -.01 .12 .96 .03 .09 .72 -.02 .12 .86 .03 .10 .73 1.4 Action planning 13 63 0 .16 .10 .12 .20 .08 .02* .17 .13 .18 .21 .10 .03* 2.3 Self-monitoring of behaviour 9 66 1 .10 .14 .49 .12 .11 .29 .07 .16 .65 .11 .13 .38 2.4 Self-monitoring of outcome(s) of
behaviour
6 70 0 .31 .18 .096† .38 .15 .01* .05 .21 .80 .13 .16 .44
2.7 Feedback on outcomes of behaviour 7 69 0 -.03 .16 .84 .02 .13 .90 -.06 .16 .70 .00 .13 .98 3.1 Social support (unspecified) 30 46 0 .07 .09 .45 .05 .07 .45 .11 .10 .26 .09 .08 .25 3.2 Social support (practical) 9 67 0 -.12 .11 .28 -.09 .09 .31 -.17 .12 .17 -.13 .09 .18 4.1 Instruction on how to perform a
behaviour
54 21 1 -.08 .08 .35 -.08 .07 .25 -.04 .09 .67 -.04 .08 .65
5.1 Information about health consequences
22 54 0 .06 .09 .47 -.04 .07 .63 .06 .10 .53 -.05 .08 .56
5.2 Salience of consequences 4 72 0 .19 .16 .24 .03 .14 .85 .18 .17 .30 .02 .15 .88 5.3 Information about social and
environmental consequences
7 69 0 .19 .14 .18 .09 .13 .48 .30 .16 .06† .19 .14 .21
6.1 Demonstration of the behaviour 10 66 0 .12 .12 .34 .15 .10 .13 .11 .13 .40 .16 .10 .14 7.1 Prompts/cues 20 56 0 .03 .09 .78 -.03 .08 .68 .05 .10 .60 -.01 .08 .90 8.1 Behavioural practice/rehearsal 15 61 0 -.04 .10 .71 -.01 .08 .92 -.05 .11 .64 -.01 .09 .87 8.2 Behaviour substitution 4 72 0 .05 .18 .80 .06 .14 ,66 .04 .19 .84 .06 .15 .68 9.1 Credible source 32 44 0 -.10 .08 .22 -.06 .07 .41 -.13 .09 .18 -.07 .08 .33 10.3 Non-specific reward 4 72 0 .20 .19 .29 -.06 .19 .74 .18 .20 .36 -.07 .20 .72 12.1 Restructuring the physical
environment
13 63 0 -.07 .11 .49 -.05 .08 .58 -.08 .12 .48 -.05 .09 .60
12.5 Adding objects to the environment 4 72 0 -.21 .16 .20 -.18 .12 .14 -.22 .17 .20 -.19 .13 .14
Dietary Behaviour in LMICs Review
25 Table 1 (Continued): Meta-regressions. BCTs regressed on dietary behaviour effect sizes
___________________________________________________________________________________________________________________
All outcomes
Inc. outliers (k = 76) Exc. outliers (k = 72)
Self-reported fruit and vegetables intake Inc. outliers (k = 29) Exc. outliers (k = 28)
Self-reported fat intake
Inc. outliers (k = 24) Exc. outliers (k = 22)
beta Std.
error p-value
beta Std. error
p-value
Beta Std. error
p-value
beta Std. error
p-value
beta Std. error
p-value
beta Std. error
p-value
1.1 Goal setting (behaviour) .16 .11 .13 .05 .07 .47 .24 .11 .048* .13 .10 .21 .03 .18 .86 -.08 .14 .58 1.2 Problem solving .09 .13 .49 .00 .08 1 -.16 .13 .24 -.10 .10 .36 .00 .19 .99 -.16 .17 .35 1.4 Action planning .23 .12 .06† .14 .07 .06† .27 .17 .11 .35 .12 .01* .18 .25 .48 -.18 .23 .44 2.3 Self-monitoring of behaviour .04 .13 .74 .08 .07 .28 .08 .22 .74 .14 .17 .41 -.02 .23 .94 .06 .17 .71 2.4 Self-monitoring of outcome(s)
of behaviour
.05 .18 .77 .14 .10 .16 -.21 .23 .37 -.15 .19 .42 -.02 .31 .95 .07 .25 .78
2.7 Feedback on outcomes of behaviour
-.11 .16 .51 -.03 .09 .79 .04 .19 .85 .11 .15 .48 -.30 .24 .22 -.22 .19 .26
3.1 Social support (unspecified) .07 .10 .47 .01 .06 .88 .23 .11 .048* .13 .09 .16 -.08 .16 .64 .04 .13 .74 3.2 Social support (practical) -.14 .13 .29 -.09 .07 .19 -.24 .12 .05† -.18 .08 .04* .16 .22 .47 -.06 .20 .78 4.1 Instruction on how to perform a
behaviour
-.10 .09 .29 -.05 .06 .35 -.11 .11 .29 -.04 .09 .66 .12 .17 .47 .00 .13 .98
5.1 Information about health consequences
.05 .10 .66 -.02 .06 .77 .01 .12 .90 -.05 .09 .55 -.19 .17 .27 -.08 .13 .56
5.2 Salience of consequences .13 .19 .50 -.03 .11 .79 .26 .16 .11 -.01 .15 .97 .35 .42 .42 .43 .33 .22 5.3 Information about social and
environmental consequences
.11 .16 .51 .02 .10 .81 .72 .16 .000* .51 .30 .10 .38 ..30 .21 -.18 .33 .60
6.1 Demonstration of the behaviour .27 .14 .07† .12 .09 .17 .14 .14 .31 .18 .10 .09† .36 .23 .14 .45 .17 .01* 7.1 Prompts/cues -.01 .11 .93 -.04 .06 .49 .00 .12 .97 .07 .09 .43 -.19 .16 .25 -.09 .13 .50 8.1 Behavioural practice/rehearsal .00 .12 1 -.07 .06 .29 -.11 .12 .36 -.07 .09 .42 .04 .18 .85 .14 .14 .32 8.2 Behaviour substitution .04 .21 .85 .07 .12 .55 -.07 .18 .69 -.03 .13 .82 .21 .22 .36 -.05 .22 .84 9.1 Credible source -.02 .09 .82 -.02 .05 .73 -.11 .12 .38 -.05 .09 .56 -.24 .15 .13 -.13 .12 .31 10.3 Non-specific reward .08 .20 .67 -.07 .13 .58 .53 .19 .01* -.18 .36 .61 .10 .35 .77 .19 .24 .44 12.1 Restructuring the physical
environment
-.10 .12 .40 -.04 .06 .51 -.23 .11 .05† -.17 .08 .047 *
.24 .18 .20 .16 .16 .33
12.5 Adding objects to the environment
-.21 .19 .26 -.16 .09 .08† -.18 .15 .23 -.13 .10 .22 -.01 .28 .98 .04 .21 .84
Dietary Behaviour in LMICs Review
26 Table 2: Effect of other intervention characteristics
Intervention characteristic Frequency of characteristic (k =
76)
Self-report & physiological outcomes directly linked with behaviour Inc. outliers (k = 67) Exc. outliers (k = 64)
Self-reported diet only
Inc. outliers (k = 58) Exc. outliers (k = 55)
TYPE OF PARTICIPANT 1 0 -1 Beta Std.
err. p-value
beta Std. error
p-value
Beta Std. error
p-value
Beta Std. err.
p-value
Pre-existing condition (yes/no) 39 37 - .11 .08 .18 .03 .07 .64 .14 .09 .14 .03 .08 .63 Overweight (yes = 1/no = 0) 17 56 - -.01 .12 .91 -.11 .11 .31 .01 .14 .93 -.09 .12 .47 Hypertension (yes = 1/no = 0) 6 67 - .41 .16 .01* .16 .16 .31 .65 .21 .002* .28 .23 .22 Diabetes (yes = 1/no = 0) 7 66 - .11 .14 .45 .18 .11 .12 .18 .19 .35 .25 .15 .10 Individual vs. group (1=individual,
0=group)
66 10 - .10 .13 .44 .07 .10 .49 .03 .14 .84 -.01 .12 .91
Adult vs. child (1=adult, 0=both, -1=child) 37 9 30 .14 .04 .001* .10 .03 .004* .15 .05 .003* .10 .04 .01* Family (yes = 1/no = 0) 9 67 - -.12 .13 .36 -.10 .11 .37 -.05 .15 .75 -.01 .12 .96 SETTING
Asia (yes = 1/no = 0) 26 50 - -.11 .09 .23 -.02 .07 .76 -.11 .10 .26 -.01 .08 .89 Africa (yes = 1/no = 0) 10 66 - -.04 .12 .72 -.02 .09 .86 .00 .14 1 .03 .11 .81 Middle East (yes = 1/no = 0) 16 60 - .22 .10 .04* .03 .10 .78 .29 .11 .02* .07 .11 .50 South America (yes = 1/no = 0) 21 55 - -.05 .10 .62 -.01 .08 .90 -.07 .11 .51 -.03 .09 .71 INTERVENTION/other study CHARACTERISTICS
Preparation (yes = 1/no = 0) 15 61 0 .00 .11 .97 -.09 .09 .30 .06 .12 .64 -.06 .10 .58 Targeted multiple behaviours
(1=multi-behaviour; 0=diet only)
45 29 - .01 .09 .91 .01 .07 .91 .01 .10 .94 .00 .08 .99
Follow-up without BCTs (yes = 1/no = 0) 18 58 - -.10 .10 .30 -.06 .08 .49 -.09 .11 .42 -.04 .09 .69 Period of intervention days [experimental] - - - -.00 .00 .40 .00 .00 .53 .00 .00 .38 .00 .00 .51 Face to face [experimental] (yes = 1/no =
0]
70 6 - -.33 .15 .03* -.11 .14 .41 -.32 .17 .06† -.07 .15 .66
Computer-based [experimental] (yes = 1/no = 0)
6 70 - .03 .17 .86 .07 .14 .62 -.02 .17 89 .02 .13 .87
Telephone-based [experimental] (yes = 1/no = 0)
10 66 - .09 .11 .43 .00 .09 1 .17 .14 .21 .02 .11 .84
Print-based [experimental] (yes = 1/no = 0)
63 13 - -.10 .11 .38 .00 .09 .98 -.08 .13 .56 .07 .10 .50
Video-based [experimental] (yes = 1/no = 0)
8 68 - -.06 .12 .61 .00 .10 .99 -.07 .13 .58 .00 .11 1
Face to face [experimental v control] (inter.only=1/both/neither=0/con.only=-1)
Dietary Behaviour in LMICs Review
27
Computer-based [experimental v control] (inter.only=1/both/neither=0/con.only=-1)
5 71 - .03 .17 .86 .07 .14 .62 -.02 .17 .89 .02 .13 .87
Telephone-based [experimental v control] (inter.only=1/both/neither=0/con.only=-1)
9 67 - .12 .11 .31 .02 .09 .86 .17 .14 .21 .02 .11 .84
Print-based [experimental v control] (inter.only=1/both/neither=0/con.only=-1)
44 31 1 -.05 .08 .56 .03 .07 .68 -.10 .10 .31 .01 .08 .94
Video-based [experimental v control] (inter.only=1/both/neither=0/con.only=-1)
8 67 1 -.06 .11 .63 .00 .10 .99 -.04 .12 .75 .02 .10 .86
RISK OF BIAS/METHODOLOGY 1 = low risk; 0 = high or unclear risk of bias Type of randomisation [individual vs. group] (1=individual, 0=group)
38 38 - .24 .08 .003* .19 .06 .005* .24 .09 .009* .17 .07 .03*
Adequate randomization (1 = yes/0 = no) 49 27 - -.01 .09 .93 .04 .08 .60 .02 .10 .88 .07 .08 .42 Allocation concealment [claimed] (1 =
yes/0 = no)
6 70 - -.15 .15 .32 -.12 .12 .31 -.13 .19 .51 -.10 .14 .51
Allocation concealment [adequate] (1 = yes/0 = no)
4 72 - -.18 .19 .36 -.14 .15 .36 -.15 .31 .62 -.11 .22 .63
Any blinding [claimed] (1 = yes/0 = no) 19 57 - -.18 .09 .04* -.15 .07 .04* -.18 .11 .09† -.15 .08 .09† Blinding Participants [claimed] (1 = yes/0
= no)
6 70 - -.21 .13 .12 -.18 .10 .08† -.13 .15 .39 -.11 .12 .36
Blinding Deliverer [claimed] (1 = yes/0 = no)
8 68 - -.17 .12 .16 -.14 .10 .16 -.26 .14 .06† -.22 .11 .04*
Blinding Data Collector [claimed] (1 = yes/0 = no)
5 71 - .03 .16 .86 .04 .12 .76 .20 .22 .37 -.15 .16 .36
Blinding Analysis [claimed] (1 = yes/0 = no)
5 71 - -.27 .15 .08† -.23 .12 .048* -.13 .20 .51 -.11 .15 .49
Contamination prevention [claimed] (1 = yes/0 = no)
3 72 - -.13 .20 .54 -.12 .16 .48 .10 .28 .72 .15 .24 .53
Contamination prevention [adequate] (1 = yes/0 = no)
1 75 - .05 .38 .90 .09 .33 .78 .04 .39 .92 .09 .33 .80
Informed consent (1 = yes/0 = no) 73 3 - -.19 .27 .48 -.23 .24 .34 -.18 .27 .52 -.22 .24 .36 Attrition rate [experimental] - - - .00 .00 .53 .00 .00 .17 .00 .00 .83 .00 .00 .41 Ethics approval reported (1 = yes/0 = no) 67 9 - -.04 .14 .78 -.06 .11 .61 -.02 .14 .89 -.05 .12 .70
Dietary Behaviour in LMICs Review
28 Table 2 (Continued): Effect of other intervention characteristics
Intervention characteristic All outcomes Self-reported fruit and vegetable intake Self-reported fat intake
Inc. outliers (k = 76) Exc. outliers (k = 72) Inc. outliers (k = 29) Exc. outliers (k = 28) Inc. outliers (k = 24) Exc. outliers (k = 22)
TYPE OF PARTICIPANT beta Std.
err p-value
beta Std. err.
p-value
beta Std. error
p-value
beta Std. error
p-value
Beta Std. err.
p-value
beta Std. err.
p-value
Pre-existing condition (yes/no) .04 .09 .63 .02 .05 .67 .24 .12 .05† .12 .11 .28 .01 .16 .94 .02 .13 .90 Overweight (yes = 1/no = 0) -.06 .12 .51 -.07 .07 .32 .27 .14 .06† .09 .13 .52 -.14 .19 .46 -.27 .14 .07† Hypertension (yes = 1/no = 0) .40 .18 .03* .15 .13 .25 .59 .32 .08† .66 .25 .02* - - - - Diabetes (yes = 1/no = 0) .04 .17 .83 .16 .09 .099† -.09 .33 .79 -.03 .28 .91 .20 .29 .49 .31 .21 .16 Individual vs. group (1=individual,
0=group)
.08 .15 .58 .03 .08 .71 .07 .16 .65 .02 .13 .89 -.06 .21 .78 -.15 .15 .34
Adult vs. child (1=adult, 0=both, -1=child) .14 .04 .002* .09 .03 .002* .14 .05 .02* .10 .04 .03* .00 .08 .98 .01 .07 .85 Family (yes = 1/no = 0) -.09 .15 .57 -.04 .09 .65 -.10 .18 .59 -.04 .14 .76 -.03 .23 .89 .07 .17 .70 SETTING
Asia (yes = 1/no = 0) -.07 .10 .44 -.05 .06 .41 -.03 .12 .80 .01 .09 .93 -.14 .16 .38 .01 .13 .96 Africa (yes = 1/no = 0) -.01 .14 .94 .03 .07 .67 -.10 .17 .56 -.04 .13 .74 -.18 .27 .52 -.10 .21 .63 Middle East (yes = 1/no = 0) .20 .11 .07† .06 .07 .45 .37 .12 .005* .23 .12 .08† -.07 .24 .77 .00 .18 .99 South America (yes = 1/no = 0) -.09 .11 .40 -.02 .06 .73 -.12 .12 .36 -.06 .10 .53 .22 .16 .20 -.03 .15 .85 INTERVENTION/other study CHARACTERISTICS
Preparation (yes = 1/no = 0) .04 .12 .76 -.02 .07 .79 -.13 .14 .37 -.08 .11 .50 .08 .25 .76 .13 .20 .50 Targeted multiple behaviours
(1=multi-behaviour; 0=diet only)
-.07 .10 .50 -.02 .05 .69 -.10 .11 .37 -.02 .09 .82 .01 .16 .97 .06 .13 .68
Follow-up without BCTs (yes = 1/no = 0) -.06 .11 .56 -.01 .06 .89 .02 .12 .88 .06 .09 .54 .01 .19 .95 -.12 .15 .43 Period of intervention days [experimental] .00 .00 .40 .00 .00 .49 .00 .00 .19 .00 .00 .35 .00 .00 .60 .00 .00 .68 Face to face [experimental] (yes = 1/no =
0]
-.29 .18 .10 -.08 .12 .48 -.10 .22 .66 -.17 .17 .34 -.07 .27 .80 -.16 .19 .41
Computer-based [experimental] (yes = 1/no = 0)
-.06 .17 .74 .02 .09 .87 .01 .16 .93 .06 .12 .63 .19 .22 .40 -.02 .21 .92
Telephone-based [experimental] (yes = 1/no = 0)
.06 .13 .67 .00 .07 .98 .04 .17 .84 .09 .13 .48 -.19 .19 .33 -.09 .15 .54
Print-based [experimental] (yes = 1/no = 0)
-.09 .12 .46 -.03 .07 .68 .11 .14 .43 .08 .11 .44 .22 .24 .38 .14 .19 .48
Video-based [experimental] (yes = 1/no = 0)
-.05 .15 .74 .02 .08 .83 -.14 .14 .30 -.10 .10 .32 .30 .19 .13 .17 .18 .35
Face to face [experimental v control] (inter.only=1/both/neither=0/con.only=-1)
-.09 .09 .32 -.06 .06 .32 -.17 .13 .20 -.04 .11 .72 .22 .20 .29 .11 .16 .49
Computer-based [experimental v control] (inter.only=1/both/neither=0/con.only=-1)
Dietary Behaviour in LMICs Review
29
Telephone-based [experimental v control] (inter.only=1/both/neither=0/con.only=-1)
.08 .13 .55 .01 .08 .90 .04 .17 .84 .09 .13 .48 -.19 .19 .33 -.09 .15 .54
Print-based [experimental v control] (inter.only=1/both/neither=0/con.only=-1)
-.08 .09 .36 .01 .05 .82 .01 .12 .96 .09 .09 .33 .18 .17 .29 .07 .13 .61
Video-based [experimental v control] (inter.only=1/both/neither=0/con.only=-1)
-.04 .14 .76 .01 .08 .87 -.07 .12 .59 -.05 .09 .59 .21 .17 .22 .09 .15 .56
RISK OF BIAS/METHODOLOGY 1 = low risk; 0 = high or unclear risk of bias Type of randomisation [individual vs. group] (1=individual, 0=group)
.21 .09 .02* .14 .05 .01* .31 .10 .004* .24 .08 .008* .02 .16 .92 .00 .13 .98
Adequate randomization -.07 .10 .47 .05 .06 .39 -.29 .13 .03* -.12 .12 .33 .06 .19 .76 -.03 .15 .86 Allocation concealment [claimed] -.16 .16 .33 -.09 .09 .29 -.10 .26 .71 -.04 .18 .81 - - - - Allocation concealment [adequate] -.16 .20 .43 -.08 .11 .48 -.10 .26 .71 -.04 .18 .81 - - - - Any blinding [claimed] -.18 .10 .09† -.11 .06 .06† -.02 .14 .90 .03 .10 .75 .04 .19 .83 -.10 .16 .55 Blinding Participants [claimed] -.17 .15 .29 -.11 .08 .15 -.06 .16 .69 -.02 .12 .84 .36 .28 .21 -.05 .26 .84 Blinding Deliverer [claimed] -.18 .14 .20 -.12 .08 .13 -.14 .17 .42 -.08 .12 .54 -.16 .23 .50 -.07 .18 .71 Blinding Data Collector [claimed] -.04 .18 .82 -.01 .10 .91 -.15 .19 .45 -.09 .14 .53 -.13 .36 .71 -.05 .26 .84 Blinding Analysis [claimed] -.26 .17 .12 -.18 .09 .04* .21 .29 .48 .27 .22 .22 -.22 .37 .56 -.13 .28 .63 Contamination prevention [claimed] -.04 .24 .86 -.02 .14 .86 .06 .26 .83 .12 .22 .61 .21 .42 .62 .29 .34 .40 Contamination prevention [adequate] .07 .44 .87 .14 .29 .62 .08 .35 .82 .14 .30 .65 .21 .42 .62 .29 .34 .40 Informed consent -.21 .31 .49 -.28 .22 .21 -.04 .31 .91 -.10 .27 .71 -.21 .42 .62 -.29 .34 .40 Attrition rate [experimental] .00 .00 .54 .00 .00 .13 .00 .00 .92 .00 .00 .35 .00 .01 .72 .00 .01 .57 Ethics approval reported -.06 .15 .69 -.09 .09 .32 .08 .16 .61 .02 .13 .86 .13 .21 .55 .04 .17 .82
Dietary Behaviour in LMICs Review
30 Table 3: Confounding of Behaviour Change Techniques (k = 76)
____________________________________________________________________________________________________________________
Behaviour change technique 1 2 3 4 5 6 7 8 9
____________________________________________________________________________________________________________________
1. Action planning (BCT 1.4) - 1 .06† .25 .06† .03* 1 .34 .58
2. Self-monitoring (outcome) (BCT 2.4) - 1 .36 .91 .67 1 1 1
3. Demonstration of the behaviour (BCT 6.1) - 1 .98 1 .06† .59 1
4. Hypertension - .16 .098† .18 1 .36
5. Adult vs. child - .000** .92 .66 .83
6. Type of randomization - .43 .71 .36
7. Any blinding [claimed] - .000** .001**
8. Blinding deliverer [claimed] - .44
9. Blinding analysis [claimed] -
Dietary Behaviour in LMICs Review
0
PRISMA 2009 Flow Diagram
http://prisma.thetacollaborative.ca/
Figure 1: PRISMA flow diagram
Records identified through database searching
(n = 26390 )
S
cr
e
e
n
in
g
In
cl
u
d
e
d
E
li
g
ib
il
it
y
Id
e
n
ti
fi
ca
ti
o
n
Additional records identified through other sources
(n = 0 )
Records after duplicates removed (n = 18332 )
Records screened (n = 18332 )
Records excluded (n = 18180)
Full-text articles assessed for eligibility
(n = 152 )
Full-text articles excluded
(n = 76) Reasons: -Not RCT
-Interventions with no measure related to diet
-Other/combination of above
Studies included in quantitative synthesis (meta-analysis)
Dietary Behaviour in LMICs Review
1 Figure 2: Forest plot of intervention effect sizes (self-report and physiological outcomes directly linked with dietary behaviour, k = 67)
NOTE: Weights are from random effects analysis Overall (I-squared = 76.6%, p = 0.000) Van Rooijen Cespedes Salehi Philippi Jemmott, Diaz-Ramirez Ojieabu Akhu-Zaheya Muchiri Bhurosy AUTHOR Anetor Wei In-Iw Wang Toral Quizan-Plata Pan Cakir Esfarjani Karavetian Shojaei Saraf Tamban Wong Cunha Pichayapinyo Saneei Paula_Leitão Sarrafzadegan Pimentel Jamal De_Villiers Schreinemachers_Nepal Habib-Mourad Jaime Mohd-Razif Hu Kreausukon Lin He Ribeiro Xavier Kabahenda Tan Najimi Sartorelli Ram Golshahi Menezes Gunawardena Shahid Nichols Paes-Barreto Olney Zhou Martinez-Andrade Amini Armitage Bandoni Cappuccio Schreinemachers_Bhutan Lima Abujudeh Duan Shamah_Levy Jahangiry Rausch-Herscovici
0.35 (0.27, 0.42) 0.35 (-0.23, 0.94) 0.09 (-0.03, 0.22)
1.02 (0.82, 1.23) 0.22 (-0.07, 0.51) 0.21 (0.09, 0.33) 0.38 (-0.55, 1.32)
0.45 (0.13, 0.78) 1.81 (1.36, 2.25)
0.27 (-0.17, 0.70) 0.90 (0.20, 1.60) ES (95% CI)
0.61 (0.41, 0.81)
0.21 (-0.10, 0.53) -0.02 (-0.58, 0.54)
0.45 (-0.59, 1.50) 0.07 (-0.54, 0.68) 0.40 (-0.09, 0.90) 0.07 (-0.25, 0.39) 1.18 (0.63, 1.72)
0.58 (0.13, 1.02)
0.09 (-0.20, 0.38)
0.41 (-0.08, 0.90) 0.08 (-0.01, 0.16)
0.35 (-0.03, 0.74)
0.04 (-0.28, 0.35) 0.28 (0.12, 0.45)
0.78 (0.32, 1.24)
0.06 (-0.44, 0.56) 0.44 (-0.18, 1.06)
1.10 (0.54, 1.65) 0.93 (0.35, 1.51) -0.05 (-0.37, 0.27) 0.14 (-0.11, 0.39)
0.02 (-0.11, 0.15) 0.47 (-0.02, 0.96)
0.21 (-0.88, 1.30)
0.17 (-0.12, 0.47) 0.07 (-0.56, 0.70)
0.36 (-0.01, 0.73)
0.31 (0.16, 0.46) 0.40 (0.26, 0.54)
0.19 (-0.54, 0.91)
0.36 (0.21, 0.51) 0.83 (0.02, 1.63)
0.37 (0.06, 0.68) 0.83 (0.26, 1.40)
0.69 (0.21, 1.17) 0.25 (0.06, 0.44) 0.94 (0.26, 1.63)
0.26 (-0.20, 0.73) 0.18 (-0.31, 0.68)
0.77 (0.56, 0.98) 0.32 (-0.14, 0.78)
0.51 (0.09, 0.93) 0.13 (-0.10, 0.36)
0.51 (0.03, 1.00) 0.12 (-0.11, 0.35) -0.23 (-0.56, 0.10)
0.14 (-0.17, 0.44) 0.14 (-0.06, 0.33)
-0.06 (-0.27, 0.15)
0.14 (-0.04, 0.32) 0.67 (0.35, 1.00) 0.17 (-0.19, 0.54)
0.75 (0.40, 1.10)
0.26 (0.09, 0.43) 0.34 (-0.31, 0.99)
0.01 (-0.66, 0.68)
100.00 0.97 2.32 2.07 1.80 2.33 0.50 1.68 1.30 1.34 0.77 Weight 2.09 1.71 1.01 0.41 0.92 1.17 1.69 1.06 1.30 1.79 1.18 2.40 1.48 1.71 2.20 1.26 1.16 0.90 1.03 0.98 1.69 1.94 2.31 1.18 0.39 1.77 0.88 1.53 2.25 2.29 0.73 2.26 0.63 1.73 1.00 1.22 2.13 0.79 1.24 1.16 2.06 1.26 1.37 2.00 1.20 2.02 1.66 1.73 2.11 2.07 2.16 1.68 1.54 1.60 2.21 0.85 0.81 %
0.35 (0.27, 0.42) 0.35 (-0.23, 0.94) 0.09 (-0.03, 0.22)
1.02 (0.82, 1.23) 0.22 (-0.07, 0.51) 0.21 (0.09, 0.33) 0.38 (-0.55, 1.32)
0.45 (0.13, 0.78) 1.81 (1.36, 2.25)
0.27 (-0.17, 0.70) 0.90 (0.20, 1.60) ES (95% CI)
0.61 (0.41, 0.81)
0.21 (-0.10, 0.53) -0.02 (-0.58, 0.54)
0.45 (-0.59, 1.50) 0.07 (-0.54, 0.68) 0.40 (-0.09, 0.90) 0.07 (-0.25, 0.39) 1.18 (0.63, 1.72)
0.58 (0.13, 1.02)
0.09 (-0.20, 0.38)
0.41 (-0.08, 0.90) 0.08 (-0.01, 0.16)
0.35 (-0.03, 0.74)
0.04 (-0.28, 0.35) 0.28 (0.12, 0.45)
0.78 (0.32, 1.24)
0.06 (-0.44, 0.56) 0.44 (-0.18, 1.06)
1.10 (0.54, 1.65) 0.93 (0.35, 1.51) -0.05 (-0.37, 0.27) 0.14 (-0.11, 0.39)
0.02 (-0.11, 0.15) 0.47 (-0.02, 0.96)
0.21 (-0.88, 1.30)
0.17 (-0.12, 0.47) 0.07 (-0.56, 0.70)
0.36 (-0.01, 0.73)
0.31 (0.16, 0.46) 0.40 (0.26, 0.54)
0.19 (-0.54, 0.91)
0.36 (0.21, 0.51) 0.83 (0.02, 1.63)
0.37 (0.06, 0.68) 0.83 (0.26, 1.40)
0.69 (0.21, 1.17) 0.25 (0.06, 0.44) 0.94 (0.26, 1.63)
0.26 (-0.20, 0.73) 0.18 (-0.31, 0.68)
0.77 (0.56, 0.98) 0.32 (-0.14, 0.78)
0.51 (0.09, 0.93) 0.13 (-0.10, 0.36)
0.51 (0.03, 1.00) 0.12 (-0.11, 0.35) -0.23 (-0.56, 0.10)
0.14 (-0.17, 0.44) 0.14 (-0.06, 0.33)
-0.06 (-0.27, 0.15)
0.14 (-0.04, 0.32) 0.67 (0.35, 1.00) 0.17 (-0.19, 0.54)
0.75 (0.40, 1.10)
0.26 (0.09, 0.43) 0.34 (-0.31, 0.99)
0.01 (-0.66, 0.68)
100.00 0.97 2.32 2.07 1.80 2.33 0.50 1.68 1.30 1.34 0.77 Weight 2.09 1.71 1.01 0.41 0.92 1.17 1.69 1.06 1.30 1.79 1.18 2.40 1.48 1.71 2.20 1.26 1.16 0.90 1.03 0.98 1.69 1.94 2.31 1.18 0.39 1.77 0.88 1.53 2.25 2.29 0.73 2.26 0.63 1.73 1.00 1.22 2.13 0.79 1.24 1.16 2.06 1.26 1.37 2.00 1.20 2.02 1.66 1.73 2.11 2.07 2.16 1.68 1.54 1.60 2.21 0.85 0.81 % 0
Dietary Behaviour in LMICs Review
2 Figure 3: Funnel plot of observed effect size on self-report and physiological outcomes directly linked with dietary behaviour (ES_beh_physio_g) against standard error (SE_beh_physio_g).
0
.2
.4
.6
-1 0 1 2
ES_beh_physio_g
Dietary Behaviour in LMICs Review
0 Online Supplementary Material: References included in the review
Abujudeh, B. A., Abu Al Rub, R. F., Al-Faouri, I. G., & Gharaibeh, M. K. (2012). The impact of lifestyle modification in preventing or delaying the progression of type 2 diabetes mellitus among high-risk people in Jordan. Journal of Research in Nursing, 17(1), 32-44.
Akhu-Zaheya, L. M., & Shiyab, W. Y. (2017). The effect of short message system (SMS) reminder on adherence to a healthy diet, medication, and cessation of smoking among adult patients with cardiovascular diseases. International Journal of Medical
Informatics, 98, 65-75.
Amini, M., Djazayery, A., Majdzadeh, R., Taghdisi, M., Sadrzadeh-Yeganeh, H., Abdollahi, Z., Hosseinpour-Niazi, N., Chamari, M., & Nourmohammadi, M. (2016). A school-based intervention to reduce excess weight in overweight and obese primary school students. Biological Research for Nursing, 18, 531-540.
Anetor, G. O., Ogundele, B. O., & Oyewole, O. E. (2012). Effect of nutrition education on the eating habits of undergraduates in South-West, Nigeria. Asian Journal of Epidemiology, 5(2), 32-41. Retrieved from
http://onlinelibrary.wiley.com/o/cochrane/clcentral/articles/896/CN-01018896/frame.html doi:10.3923/aje.2012.32.41
Armitage, C. J. (2014). Evidence that self-incentives increase fruit consumption: A randomized exploratory trial among high-risk Romanian adolescents. Prevention Science, 15(2), 186-193.
Bacardí-Gascon, M., Pérez-Morales, M. E., & Jiménez-Cruz, A. (2012). A six month randomized school intervention and an 18-month follow-up intervention to prevent childhood obesity in Mexican elementary schools. Nutricion hospitalaria, 27(3), 755-762. Retrieved from