This is a repository copy of Can prosperity return to the Economic and Monetary Union?. White Rose Research Online URL for this paper:
http://eprints.whiterose.ac.uk/92574/ Version: Accepted Version
Article:
Sawyer, M orcid.org/0000-0002-4565-5276 (2015) Can prosperity return to the Economic and Monetary Union? Review of Keynesian Economics, 3 (4). pp. 457-470. ISSN
2049-5323
https://doi.org/10.4337/roke.2015.04.02
This is an author produced version of a paper published in Review of Keynesian Economics. Uploaded in accordance with the publisher's self-archiving policy.
[email protected] https://eprints.whiterose.ac.uk/ Reuse
Unless indicated otherwise, fulltext items are protected by copyright with all rights reserved. The copyright exception in section 29 of the Copyright, Designs and Patents Act 1988 allows the making of a single copy solely for the purpose of non-commercial research or private study within the limits of fair dealing. The publisher or other rights-holder may allow further reproduction and re-use of this version - refer to the White Rose Research Online record for this item. Where records identify the publisher as the copyright holder, users can verify any specific terms of use on the publisher’s website.
Takedown
If you consider content in White Rose Research Online to be in breach of UK law, please notify us by
1
Can prosperity return to the Economic and Monetary Union? Malcolm Sawyer
University of Leeds
Abstract The paper focuses on the unemployment crisis within the Economic and Monetary Union, and the future prospects for employment and unemployment within the euroarea. It considers the ‘structural reforms’ agenda for labour markets, and argues that at best that agenda would be neutral for unemployment. The ‘fiscal compact’, if it is adhered to will re-impose austerity. The lack of concern over resolving the balance of payments imbalances threatens to confine many countries to high levels of unemployment.
Key words: Economic and Monetary Union, unemployment, structural reforms, fiscal compact, current account imbalances
2 Introduction
On the tenth anniversary of the decision by European leaders to introduce the euro in 20081, the European Union congratulated itself on the successful launch of the
euro. ‘A full decade after Europe's leaders took the decision to launch the euro, we have good reason to be proud of our single currency. The Economic and Monetary Union and the euro are a major success. For its member countries, EMU has anchored macroeconomic stability, and increased cross border trade, financial integration and investment. For the EU as a whole, the euro is a keystone of further economic integration and a potent symbol of our growing political unity.’2
There was a recognition of some unresolved issues within EMU which included ‘potential growth remains too low’ and ‘there have been substantial and lasting differences across countries in terms of inflation and unit labour costs ….This has led to accumulated competitiveness losses and large external imbalances, which in EMU require long periods of adjustment.’ Also ‘the public image of the euro does
not fully reflect EMU's successful economic performance. The euro is often
used as a scapegoat for poor economic performances that in reality result from inappropriate economic policies at the national level’ (European Commission, 2008, pp.6-7, emphasis in original).
It was not long after this largely self-congratulatory document was issued that the full blast of the global financial crises and the recession came. It was soon after that there was widespread talk of a Euroarea crisis. It should though be seen as a series of interlinked crises, some of which have diminished of late (at least on the surface) whereas others continue. There was an existential crisis where many have called into doubt continuation of the euro, or at least the departure of some members. There have been banking crises. It was the sovereign debt crisis which attracted most attention, and the impacts on the banking system where much of the sovereign debt was held. The adjustments of the current account imbalances have been to some degree attained through a vicious deflation. There is undoubtedly an unemployment crisis in the Euroarea. In January 2015, the average rate of unemployment across EMU countries was 11.2 per cent, significantly higher than in
1 The euro was introduced as a circulating currency and as notes and coins in January 2002; the
decision to introduce the Economic and Monetary Union was confirmed in May 1998; the euro was introduced as a virtual currency for financial transactions in January 1999.
2Joaquín Almunia, then Commissioner for Economic and Monetary Affairs introduction to European
3
the non-EMU member countries of the European Union. It varied from 4.7per cent in Germany to 23.4 per cent in Spain and 25.8 per cent in Greece. Within the regions of the Euroarea countries the variation is much greater from a number of regions with unemployment below 4 per cent through to some well in excess of 30 per cent. Youth unemployment figures are particularly troubling, averaging over 22 per cent across the Euroarea and over 50 per cent in Greece and Spain3.
In this paper, the focus is on the question as to whether the continuation of the Economic and Monetary Union (EMU) (Euroarea) is compatible with prosperity across the Euroarea. Prosperity is here viewed in terms of the achievement of high levels of employment rather than the pace of growth.4 It is assumed here that the
Euroarea will continue, though we would argue that the constraints which the structure and policies of EMU place on economic prosperity will continue to undermine the Euroarea and its continuation. It is not argued that the countries of EMU would not have experienced recession and crisis in the late 2000s if EMU had not existed. The shock waves from the financial crises of USA and UK would still have been felt; some of the causes of the financial crisis, e.g. the rapid expansion of the Irish financial system and the property boom in that country, would still have arisen even if the existence of EMU tended to exacerbate them, and has created difficulties in responding to and coping with the crisis. However, we have argued elsewhere that there are long-standing ‘design faults’ of the EMU (Arestis and Sawyer, 2011), and spoken of its ‘dysfunctional nature’ (Arestis, Fontana and Sawyer, 2013). The ‘design faults’ on which we focus below and which have been exacerbated by recent policy changes (notably the ‘fiscal compact’) are the inappropriate macroeconomic policy framework in the Stability and Growth Pact now reinforced by the ‘fiscal compact’ and the failure to address the current account imbalances between the member countries.
In this paper, we examine three policy dimensions of the Euroarea, and how they impact on the unemployment crisis. We argue that the main effects of these three policy dimensions are to make any return to high levels of employment much more difficult: it may be possible (as reflected in the figures quoted above) for some regions to have something approaching full employment, but under the constraints of
3 Figures taken from Eurostat news release 36/2015 issued 2nd March 2015
4 This is a reflection of the view that relatively slow growth will be required in future for ecological
4
the EMU it is difficult if not impossible for full employment across the continent. In the next section we consider the role of ‘structural labour market reforms’ which have been firmly put on the agenda of the ‘fiscal compact’, and ask whether such reforms will aid or harm employment prospected. In the subsequent section, the ways in which fiscal policy is operated within the EMU are considered. It is here argued that the ‘fiscal compact’ which imposition of ‘structural balanced budgets’ threaten further austerity. In section 4, the constraints which are imposed by operating in a fixed exchange rate system (which a single currency is par excellence for its members) are considered. Current account imbalances in the ultimate fixed exchange rate regime where there is no attempt to resolve those imbalances through positive measures which would improve economic welfare (e.g. investment in export industries in deficit countries) but rather the adoption of deflationary measures which reduce demand for imports.
Labour markets and unemployment
In the first decade of the Euroarea, unemployment had tended to fall. This enabled the European Commission in their review of the first decade to claim that ‘All these positive developments have culminated in the creation of a record 16 million jobs during the first decade of EMU in the euro area. Employment has risen by almost
5
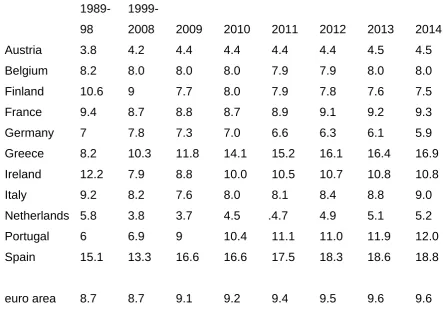
and a strengthening of firm-level agreements so that wages and working conditions can be tailored to firms’ specific needs. These measures should be accompanied by structural reforms that increase competition in product markets, particularly in services – including the liberalisation of closed professions – and, where appropriate, the privatisation of services currently provided by the public sector, thereby facilitating productivity growth and supporting competitiveness.’ (ECB, 2011, p.7). Table 1 near here
In Table 1 there are data are so-called ‘structural unemployment’ as estimated by the OECD intended to correspond to the NAIRU (non-accelerating inflation rate of unemployment), that is the level of unemployment at which inflation is estimated to be constant. The data there do not suggest any significant downward shift in structural unemployment. What may be noticed from that table is the degree to which structural unemployment as estimated has risen during the recession. Thus not only did the labour market reforms not prevent unemployment rising in Euroarea
countries through 2009 and 2010 in the face of the fall in demand, but the structural unemployment rose which in principle is independent of the level of demand though influenced by ‘structural reforms’.
A major development in the economic policies of the Euroarea came with the Treaty
on Stability, Coordination and Governance (TSCG) to which most EU countries signed up, that is even non-EMU member countries though UK and Czech Republic were the exceptions. Two elements of that Treaty attract our attention. The first is the ‘fiscal compact’ with its attempt to tighten the fiscal rules under which member countries operate, and specifically the adoption of ‘balanced structural budget’ as an underlying principle and its incorporation as a legal requirement. The second is the promotion of ‘structural reforms’ as under Article 5, ‘A Contracting Party that is subject to an excessive deficit procedure under the Treaties on which the European Union is founded shall put in place a budgetary and economic partnership programme including a detailed description of the structural reforms which must be put in place and implemented to ensure an effective and durable correction of its excessive deficit.’ (emphasis added). This incorporates two elements – first the call for ‘structural reforms’ and second the notion that such ‘structural reforms’ would enable the correction of ‘excessive deficits’.5
6
The term ‘structural reforms’ is left undefined in the Treaty, and more generally the call is for flexible de-regulated labour market (and also product markets). There seems though little doubt that the intentions are for measures to reduce regulation of the labour market, reduce employment protection measures and rights against dismissal, to increase so-called labour market flexibility (which makes the labour market more like a competitive auction market in which wages can be readily changed and employment is on a short-term basis). The ways in which the Troika have operated Greece as the example: ‘To restore competitiveness and growth, we will accelerate implementation of far reaching structural reforms in the labor, product, and service markets. Indeed to give a strong upfront impetus to unit labor cost reductions, and protect employment, we have already reformed the collective bargaining framework and reduced the minimum wage as a prior action for this program. And to reduce market rigidities, boost productivity, and increase long-term growth potential we are implementing reforms in product and service markets and improvements in the business environment.’ ‘Place more emphasis on securing reductions in unit labor costs and improvements in competitiveness, through a combination of upfront nominal wage cuts and structural labor market reforms. In unison with the elimination of rigidities in product and service markets, these are expected to lower costs and facilitate the reallocation of resources towards the tradable sectors, stronger growth, and higher employment.’ (Greece: Letter of Intent, Memorandum of Economic and Financial Policies, and Technical Memorandum of
Understanding, 15th March 2012: available at
http://www.imf.org/external/np/loi/2012/grc/030912.pdf. There were specific
reductions to be made in pensions and other social transfers.
This general approach of fostering ‘structural reforms’ as a route to generating economic recovery and higher levels of employment should be challenged at a number of levels.
7
classification. Amable (2003), for example, provides a five-way classification, of which the first four are relevant for EMU: market-based Continental European capitalism, Social Democratic economics, Southern European capitalism and Asian capitalism. Van Veen (2006) provides a similar classification: Nordic or social democratic model (Finland as EMU, Denmark and Sweden as EU members); Continental European or conservative corporatist model (Austria, France, Germany, Netherlands); Mediterranean model or traditional rudimentary model (Greece, Italy, Portugal, Spain) and Anglo-Saxon model or liberalist-individualistic model (UK being EU example).
These typologies serve here to illustrate that there are major differences between EU countries not only in the institutional and historical realities of the labour market, but also major differences in how labour markets operate. The application of a common ‘remedy’ without taking account of the specifics of the country concerned does not make a great deal of sense unless it is argued that there is an optimal structure of labour markets such that all countries should be pushed towards that optimal structure (which would be in their interests), and that the ‘optimal structure’ is one of de-regulated labour markets’.
8
The third is that whilst in the neo-liberal theorising lower wages raises the demand for labour and hence employment, that conclusion does not hold in other theorising6.
The wage curve in which real wages and unemployment are negatively related has found considerable empirical support7. There are many reasons which can be
adduced for such a relationship. The outcome from efficiency wage arguments, of which there are many, can generate such a relationship8. When there are declining
unit costs of production, higher output and employment can be associated with lower unit costs and prices, and higher real wages. For the demand side the distinction has been made between wage-led and profit-led regime (coming from the work of Bhadhuri and Marglin, 1990) where in the former there is a positive effect on demand of a shift from profits to wages, whereas in the latter there would be a negative effect. There has been mounting evidence that many economies are wage-led rather than profit-led – a recent example being Lavoie and Stockhammer (2013): hence policies which have the effect of reducing wages could be expected to reduce employment. One route through which lowering wages may have a positive effect on demand is through effects on exports with lower wages leading to lower export prices. But in a relatively closed economy such as the European Union that effect is likely to be small. We can share the view that ‘Our central conclusion is that pursuing labour market flexibilization with the aim of increasing employment via export-led growth is bound to fail, especially if fiscal austerity prevents government spending from picking up the slack in global demand’ (Capaldo and Izurieta, 2013, p. 23). The assertion (as quoted above) that ‘structural reforms’ will bring economic recovery and reduced budget deficits is based on two premises, each of which is dubious. The first is that lower wages stimulates the demand for labour, which is in essence the neo-classical downward-sloping demand curve. The arguments summarised in the preceding paragraphs have challenged that presumption. The second is that aggregate demand can be ignored; yet higher levels of employment can only result if there is higher demand for labour.
The fourth point to be made relates to tensions between the ‘structural reform’ agenda (albeit only being imposed on countries in the excessive deficit procedure) and the European Employment Strategy and more generally the policies and
6 In Sawyer (1988), I discussed the three broad reasons as to how wages and employment could be
positively related as mentioned in the text.
7 See, for example, Blanchflower and Oswald (2006).
9
activities of Directorate for Employment, Social Affairs and Inclusion9. The
Directorate describes a central element of its policy approaches on ‘flexicurity’ in the following way: ‘Working with national governments, social partners and academics the EU has identified a set of common flexicurity principles and is exploring how countries can implement them through four components:
flexible and reliable contractual arrangements
comprehensive lifelong learning strategies
effective active labour market policies
modern social security systems’
(http://ec.europa.eu/social/main.jsp?catId=102&langId=en).
It is not our intention to discuss these policies at length or to investigate how far they have been implemented and with what success. It is rather to suggest that the thrust of such a policy is not self-evidently in tune with what would be proposed under ‘structural reforms’. Further, whereas ‘structural reforms’ are to be imposed from the centre on a country, the implementation of these employment policies come through the ‘open method of coordination’.
Fiscal compact
The euro crisis is often associated with sovereign debt crises (particularly in Greece). As many have pointed out, with a national currency there is a close relationship between the national government and the central bank with the latter acting as lender of last resort – both in the sense of providing reserves and cash to banks to avoid liquidity crisis and as lender to the government, directly and indirectly. The arrangements within the EMU precludes the central bank (ECB) acting as lender, directly or indirectly to national governments, which inevitably intensifies the sovereign debt issues10.
The sovereign debt crisis along with the rise in budget deficits in the aftermath of the ‘great recession’ were strong factors leading to the tightening of the constraints on budget positions of EMU member countries. The Stability and Growth Pact (SGP)
9 See http://ec.europa.eu/social/main.jsp?langId=en&catId=1 for details on Directorate and the
European Employment Strategy.
10 ‘Overdraft facilities or any other type of credit facility with the European Central Bank or with the central banks of the Member States (hereinafter referred to as ‘national central banks’) in favour of
Union institutions, bodies, offices or agencies, central governments, regional, local or other public authorities, other bodies governed by public law, or public undertakings of Member States shall be prohibited, as shall the purchase directly from them by the European Central Bank or national central
10
sought, but often failed, to keep national budget deficits below 3 per cent of GDP and to broadly balance the budget over the cycle. Debt ratios often exceeded the 60 per cent limit set by the SGP, and in 2007 seven countries out of the original 12 members had ratios above 60 per cent, and the euroarea average debt ratio was 66.3 per cent. The SGP can be criticised for many aspects including the attempt to impose a ‘one size fits all’ rule (with regard to budget deficits) on all EMU member countries, no matter what their macroeconomic position was particularly with regard to trade position, investment and savings11. It also ignored any public investment needs. It incorporated a deflationary bias in that in real terms the SGP would have required a surplus of over 1 per cent of GDP (assuming inflation of 2 per cent per annum and 60 per cent debt to GDP ratio. There is also the inconsistency between a balanced budget and a 60 per cent debt to GDP ratio. In the event, the SGP rules were frequently broken and sanctions against governments not implemented. The remedies for the significant budget deficits which emerged after the financial crisis
and the sovereign debt crises were seen to be a tightening of the rules and their implementation and attention to be paid to the debt to GDP ratio rule which had been in effect ignored. These were formulated through ‘fiscal compact’ and the ‘six pack’, and were brought into effect through the Treaty on Stability, Coordination and Governance in the Economic and Monetary Union (European Union, 2012) (hereafter referred to as the Treaty).
The key elements of the fiscal compact on which we focus here are:
(i) The ‘structural budget deficit’ rule with that deficit not to exceed 0.5 per cent of GDP;
(ii) The ‘excessive deficit procedure’ under which a country with debt to GDP ratio exceeding 60 per cent are required to run budget surpluses to bring down the debt ratio;
(iii) The deficit requirement written into each country’s national constitution or equivalent.
The third element needs to be questioned in terms of its democratic implications, and the degree to which future governments would be unable to propose public expenditure increases and tax reductions if they run foul of the deficit rule. It could, of
11 This is a reflection of the well-known national accounts relationship: Budget Deficit = Private
11
course, be argued that democratically elected governments and Parliaments have agreed to these requirements, though that may have been under some duress. Whilst a future government can amend the constitution, there are restrictions on its ability to do so (e.g. a super majority required), and to in effect withdraw from the Treaty. The writing of requirements on the achievement of a structural balanced budget into the national constitution embeds economic policy into the constitution whereas ideas on appropriate economic policy are not unchanging over time. It seems a folly to incorporate ideas what some, but no means all, think are appropriate policies into a document which is difficult to change, especially when those ideas are mistaken. It can also be seen as an attempt to tie the hands of the electorate and future governments on economic policies. Further, the assessment of the budget deficit rule is necessarily left in the hands of technocrats and specifically those working within the European Commission. Simply assessment has to be made as to what the structural budget position of a country is. Although the words of ‘structural budget’ appear in the Treaty the phrase is not defined. It is though generally taken to be the budget position which would arise if the economy were operating at ‘potential output’ and the existing tax rates and expenditure plans remained in place. In turn, we may ask what is ‘potential output’. It does not correspond to what would be the everyday usage of that term, namely the maximum output which an economy can produce. It is rather related to a expectations augmented Phillips curve view formally expressed as p = pe + f(y) where p is inflation, pe expected inflation and y output: a constant rate of inflation with p = pe would yield f(y) =0 the solution to which would be potential output which we will label y*12. The estimation of potential output then requires that a Phillips curve with a unit
coefficient on expected inflation is successfully estimated. Further that no attention is paid to the fact that any econometric estimation is subject to margins of statistical error. The estimation of potential output is inevitably backward looking being based on past economic data.
It is particularly important here to consider whether a structural balanced budget is attainable. The crisis which the adoption of the ‘fiscal compact’ generates is the
12 An alternative but similar approach is to seek the non-accelerating inflation rate of unemployment
12
danger of a chase to achieve reduced budget deficit. A structural budget position (SBP) can be written as:
(1) SBP = G* – t(Y*)
where G* is underlying (‘structural’) level of government consumption and investment, t as tax function relating to prevailing tax rates with income transfers regarded as negative taxation and Y* ‘potential output’. There would generally be some issues over exact measures of G* as to elements, which could be regarded as temporary or discretionary and hence not included. In a similar vein, there would be issues over the tax function to be used to reflect prevailing tax rates – for example, with an income tax system involving tax free allowances and tax rates which vary with the level of income, what is assumed about the adjustments of the tax free allowances and levels of taxable income at which tax rates change in the face of inflation and changing aggregate income levels. These are important issues in the calculation of the structural budget position which need to be noted. However in practice these issues are often side-stepped by using an estimated coefficient relating budget position to the output gap (proportionate difference between actual and potential output): for example that a 1 per cent difference in the output gap leads to a 0.5 per cent difference in the budget position).
A well –known accounting relationship is (2) G – T = S – I + M – X
Where G is government expenditure, T tax revenue, S private savings, I private investment, M imports and X exports (including net income).
From this equation it can be readily seen that the achievement of a balanced budget requires that net private savings (savings minus investment) plus capital inflow (equal to M – X) equals zero. It further follows that a country which has a large export surplus (such as Germany) will in a sense find it easier to have a budget surplus (or lower budget deficit) than a country with a large export deficit. The imposition of common rules on the size of budget deficits is then called into question (which is of course what is done under the Stability and Growth Pact and re-inforced under the ‘fiscal compact’).
13
that savings which households and firms make, the investment expenditure which is undertaken and the net exports position ensure that the right hand side of equation (2) is also zero. In other words, can it be the case that:
(3) S* - I* - NX* =0
Where S* is the saving which would be made if the economy were operating at potential output, I* investment and NX* similarly. There is a lack of reasons to think that it will hold – what would be the mechanisms through which that equality comes into being? The mainstream answer could be that setting the interest rate appropriately (at the ‘natural rate’ of interest) would lead to saving and investment being equal, and a flexible exchange rate would balance the current account. Even if those arguments could apply to a national economy, they cannot apply to all the Euroarea countries where the interest rate is set by the European Central Bank to apply across the Euroarea, and the exchange rate is the euro rate vis-à-vis the rest of the world.
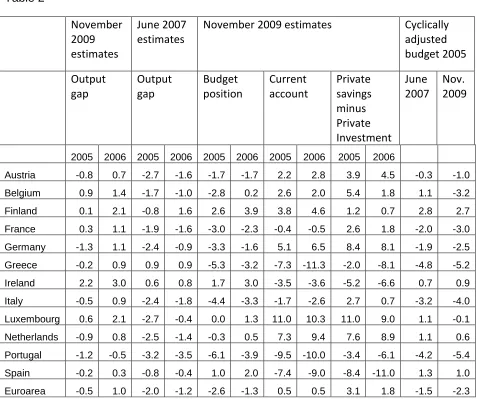
Table 2 near here
In Table 2 some relevant statistics are presented. These relate to the years 2005 and 2006 before the financial crisis struck and were years in which the output gap was reported as relatively close to zero. Two points stand out from that Table. The first is the comparison on the size of the output gap for 2005 and 2006 which were reported in OECD Economic Outlook in June 2007 with those for the same years reported in November 2009. It can readily be seen that there were substantial differences between the two sets of statistics, and in interpreting those differences bear in mind that a 1 per cent difference in output gap would be associated with 0.5 per cent of GDP difference in the estimated structural budget. It does illustrate the problematic nature of seeking to target a balanced structural budget when the estimates of potential output, output gap and the size of the structural budget deficit (or surplus) can readily change.
14
significant deviations from a balanced structural budget. One question to be asked is if a structural balanced budget was not achieved in the mid 2000s, is there reason to think it can now be achieved. This is not a matter of governments needing to ‘try harder’ and push through further austerity measures: it is a matter as to whether the economic decisions made by the private sector would be consistent with both a balanced budget and with a zero output gap – that is would equation (3) hold. Potential output is a theoretical construct and lacks transparency as to what it constitutes. It can, as indicated above, be linked with the level of unemployment, and specifically with the NAIRU. Looking again at Table 1 with OECD estimates of ‘structural unemployment’, then a range of countries would still confront double digit unemployment rate with Spain at over 20 per cent. On these estimates, to operate with a zero output gap would be to operate with very high levels of unemployment. Yet according to the logic of the policy approach to unemployment below the NAIRU, and hence a positive output gap, threatens rising inflation (which in the context of a single currency would raise prices in the country concerned relative to prices elsewhere in the currency union).
The crisis for fiscal policy involves the imposition of a common aim for budget positions across all member states, no matter what their individual circumstances. It makes no allowance for public investment which would add to budget deficit and the requirements for which differ between countries. It further makes no allowance for inflation, as a budget which is balanced when calculated in money terms is in surplus when calculated to allow for the effects of inflation on the real value of the outstanding debt (which for an inflation rate of 2 per cent per annum and a 60 per cent debt to GDP ratio makes a difference of 1.2 per cent for the calculation of the budget position (relative to GDP). There is the further deflationary push coming from the excessive deficit procedures and the threats of requirements of substantial budget surpluses in some countries. The dangers from the ‘fiscal compact’ come from the interactions of the inflexibilities in policy making brought in through the Treaty, and the simultaneous pursuit of balanced structural budgets in member countries when, as argued above, such balanced budget is not achievable in many countries.
Current account imbalances
15
per cent and Finland 5.8 per cent of GDP through to a deficit in Greece of 5.6 per cent and Portugal 8.5 per cent of GDP. The Maastricht convergence criteria for membership of the Euroarea made no mention of the current account position and whether it would be deemed sustainable or correctable. Yet these imbalances were of long standing. There was a tendency for the current account imbalances between member countries to widen, with some countries recording deficits well in excess of 10 per cent of GDP. number generating these trends. As Tressel, Wang, Kang, and Shambaugh (2014) note ‘all euro area countries that had large external imbalances experienced severe financial stress when the crisis started’ (p.9). It is also well-known that until the financial crisis of 2008/09 the dispersion of current account positions tended to increase, and notably Germany moved from a small deficit to a surplus of 6.6 per cent of GDP in 200813. The movements in relative competitiveness
can be seen as one factor amongst a number which contributed to these divergences, and enabled by the corresponding cross-border capital flows from current account surplus countries to deficit countries.
Since the financial crisis the current account deficits of the high deficit countries have in a number cases shrunk—for example Greece and Portugal recorded a close to current account balance in 2013. Much of these reductions can be attributed to the vicious deflation in the countries concerned. ‘The real effective exchange rates of the deficit countries have depreciated by 10–25 percent. These depreciations have been driven largely by reductions in unit labor costs (ULCs) due to shedding of labor. While exports have typically rebounded, slumping internal demand (and imports) account for much of the reduction in current account deficits. This trend has not been matched by stronger demand and narrower current account surpluses elsewhere in the euro area.’ (Tressel, Wang, Kang, and Shambaugh, 2014, p.4). But if prosperity were to return to those countries, the current account deficits would re-appear for the simple reason that the demand for imports would rise (whether for consumption or investment purposes).
Economic areas (whether regions, countries or smaller groupings) face in effect a budget constraint of the simple form that current inflow minus current outflow = change in financial assets. The current inflows and outflows include income (wages, profits etc) as well as transfers including remittances as well as those involving
16
government. An obvious point then quickly arises, namely that an economic area’s ability to have a current account deficit requires capital inflow, in effect borrowing from abroad, which in turn requires a willingness on the part of others to lend to the residents of that area. It is also well-known that the persistence of a current account deficit (excluding the interest and similar payments relating to past borrowing) will lead to rising external debt, raising further issues of sustainability.
For many of the EMU countries which had large and often widening current account deficits before the financial crisis, there is the major question of whether a return to anything like full employment is feasible and sustainable. Their current account deficits have narrowed in recent years through deflation and internal devaluation (as their wages and prices fell under austerity).
Within a fixed exchange rate regime (which a single currency is par excellence) the correction of major current account imbalances proves difficult. Although current account deficits have declined in EMU countries, there is little sign that what may be termed the structural current account deficit has declined – that is the current account position which would be there when the economy were operating at high levels of employment.
17
The focus of our attention is now the future prospects for employment and unemployment within the euroarea, and the policy approaches being taken. The discussion is divided into three components. The first relates to issues of labour market ‘reforms’, the second to macroeconomic policy, and specifically fiscal policy within the ‘fiscal compact’, and the third to current account imbalances and their resolution. The underlying argument is that the current direction of travel within the Euroarea and its policies will not bring about any fundamental shifts in unemployment. There may well be some improvement in the unemployment figures as some recovery takes place and as migration takes labour away from the high unemployment countries. But high levels of unemployment in many countries will tend to persist. The direction of travel in labour market and employment policies will, at best, be neutral for unemployment, and likely worsen inequality. The ‘fiscal compact’ if adhered to will re-impose austerity. The lack of concern over resolving the current account imbalances threatens to confine many countries to high levels of
18
Table 1: ‘Structural unemployment’
1989-98
1999-2008 2009 2010 2011 2012 2013 2014
Austria 3.8 4.2 4.4 4.4 4.4 4.4 4.5 4.5
Belgium 8.2 8.0 8.0 8.0 7.9 7.9 8.0 8.0
Finland 10.6 9 7.7 8.0 7.9 7.8 7.6 7.5
France 9.4 8.7 8.8 8.7 8.9 9.1 9.2 9.3
Germany 7 7.8 7.3 7.0 6.6 6.3 6.1 5.9
Greece 8.2 10.3 11.8 14.1 15.2 16.1 16.4 16.9 Ireland 12.2 7.9 8.8 10.0 10.5 10.7 10.8 10.8
Italy 9.2 8.2 7.6 8.0 8.1 8.4 8.8 9.0
Netherlands 5.8 3.8 3.7 4.5 .4.7 4.9 5.1 5.2
Portugal 6 6.9 9 10.4 11.1 11.0 11.9 12.0
Spain 15.1 13.3 16.6 16.6 17.5 18.3 18.6 18.8
euro area 8.7 8.7 9.1 9.2 9.4 9.5 9.6 9.6
Source: OECD Economic Outlook no. 94, November 2013, Annex Table 22 (data
19 Table 2
November 2009 estimates
June 2007 estimates
November 2009 estimates Cyclically
adjusted budget 2005
Output gap
Output gap
Budget position
Current account
Private savings minus Private Investment
June 2007
Nov. 2009
2005 2006 2005 2006 2005 2006 2005 2006 2005 2006
Austria -0.8 0.7 -2.7 -1.6 -1.7 -1.7 2.2 2.8 3.9 4.5 -0.3 -1.0
Belgium 0.9 1.4 -1.7 -1.0 -2.8 0.2 2.6 2.0 5.4 1.8 1.1 -3.2
Finland 0.1 2.1 -0.8 1.6 2.6 3.9 3.8 4.6 1.2 0.7 2.8 2.7
France 0.3 1.1 -1.9 -1.6 -3.0 -2.3 -0.4 -0.5 2.6 1.8 -2.0 -3.0
Germany -1.3 1.1 -2.4 -0.9 -3.3 -1.6 5.1 6.5 8.4 8.1 -1.9 -2.5
Greece -0.2 0.9 0.9 0.9 -5.3 -3.2 -7.3 -11.3 -2.0 -8.1 -4.8 -5.2
Ireland 2.2 3.0 0.6 0.8 1.7 3.0 -3.5 -3.6 -5.2 -6.6 0.7 0.9
Italy -0.5 0.9 -2.4 -1.8 -4.4 -3.3 -1.7 -2.6 2.7 0.7 -3.2 -4.0
Luxembourg 0.6 2.1 -2.7 -0.4 0.0 1.3 11.0 10.3 11.0 9.0 1.1 -0.1
Netherlands -0.9 0.8 -2.5 -1.4 -0.3 0.5 7.3 9.4 7.6 8.9 1.1 0.6
Portugal -1.2 -0.5 -3.2 -3.5 -6.1 -3.9 -9.5 -10.0 -3.4 -6.1 -4.2 -5.4
Spain -0.2 0.3 -0.8 -0.4 1.0 2.0 -7.4 -9.0 -8.4 -11.0 1.3 1.0
Euroarea -0.5 1.0 -2.0 -1.2 -2.6 -1.3 0.5 0.5 3.1 1.8 -1.5 -2.3
20 References
Akerlof, G. and Yellen, J. (eds.) (1986), Efficiency Wage Models of the Labor Market,
Cambridge: Cambridge University Press
Amable, B. (2003), The Diversity of Modern Capitalism¸ Oxford: Oxford University Press
Arestis, P. and Sawyer, M. (2014), ‘Labour Market Institutions and the Future of the Euro’, forthcoming
Arestis, P. and Sawyer, M. (2011), ‘The Design Faults of the Economic and Monetary Union’, Journal of Contemporary European Studies, vol. 19(1), pp. 19-30 Arestis, P., Fontana, G. and M. Sawyer, (2013) ‘The dysfunctional nature of the economic and monetary union’ in The EU Economic and Social Model in the Global Crisis: Interdisciplinary Perspectives (ed) Dagmar Schiek, Farnham: Ashgate:, pp.23-44
Bhaduri, A. and Marglin, S. (1990), ‘Unemployment and the real wage: the economic basis for contesting political ideologies’, Cambridge Journal of Economics, vol. 14. Blanchflower, D. G. and Oswald, A. J (2008). "Wage curve" in The New Palgrave Dictionary of Economics. Second Edition. Eds. Steven N. Durlauf and Lawrence E. Blume. Palgrave Macmillan, 2008.
Capaldo, J. and Izurieta, A. (2013), ‘The imprudence of labour market flexibilization in a fiscally austere world’, International Labour Review, Vol. 152 (2013), No. 1
European Commission (2008), “EMU@10 Successes and challenges after ten years of Economic and Monetary Union”, European Economy 2.
Lavoie, M. and Stockhammer, E. (eds.) (2013), Wage-Led Growth: An Equitable Strategy for Economic Recovery, Basingstoke: Palgrave Macmillan and International Labour Organisation (Co-publisher)
Sawyer, M. (1988), ‘On the relationship between real wages and employment’, Cyprus Journal of Economics, vol. 1, no.2
Tressel, T., Wang, S., Kang,J.S. and Shambaugh, J. (2014), Adjustment in Euro Area Deficit Countries: Progress, Challenges, and Policies, IMF Staff Discussion Note, 147
21