Rochester Institute of Technology
RIT Scholar Works
Theses
5-8-2018
BATSEN: Modifying the BATMAN Routing
Protocol for Wireless Sensor Networks
Nelson Henry Powell III
Follow this and additional works at:https://scholarworks.rit.edu/theses
This Thesis is brought to you for free and open access by RIT Scholar Works. It has been accepted for inclusion in Theses by an authorized administrator of RIT Scholar Works. For more information, please [email protected].
Recommended Citation
BATSEN: Modifying the BATMAN Routing Protocol for Wireless Sensor Networks
By:
Nelson Henry Powell III
Committee Members:
Dr. Sumita Mishra
Dr. Yin Pan
Dr. Andres Kwasinski
In partial fulfillment of the requirements for the degree of
Master of Science in Computing Security
Rochester Institute of Technology
B. Thomas Golisano College of Computing & Information Sciences Department of Computing Security
Acknowledgments
I’d like to take this opportunity to thank my wife, my love, Emilia; for putting up with the
deployments, active duty, and working two jobs, all while going back to school to complete this
degree. None of this would have been possible without your love and support. You are my
motivation for being a better me. To my children, Connor and Iliana, for teaching me to look at
the world as if it were for the first time; and for all the snuggles, hugs, and kisses that happily kept
me from my school work. You are both my favorite and most important accomplishments in my
life. May you both achieve more than me and maintain the fresh outlook on life.
I’d like to thank my parents for everything. You’ve both been my number one fans all my life. I wouldn’t be at this point in my life without your guidance, wisdom, and love. Dad, your candor,
spirituality, and introspection has giving me the tools to strive to be the best man I can be and learn
from my mistakes. I most definitely inherited your curiosity and engineering skills. Mom, thank
you for all your nurturing and affection throughout my life, for being my sounding board, and
being the driving force in my education. And thank you for coming out of retirement and giving
that final critical review.
I’d like to thank my co-workers, Dr. Michael Kurdziel for all your support and assistance
reviewing my thesis, David Weiss for being the first victim to review my paper and provide
valuable feedback, and James Hood for helping me with a last minute save that really pulled the
paper together.
To Dr. Kwasinski, I’ve enjoyed our discussions over the years, both regarding this thesis as well
as other research topics. I appreciate all the help you’ve provided throughout this project and look
forward to working with you again.
Finally, I’d like to thank Dr. Sumita Mishra. You never gave up on me and ensured I was able to
achieve my goals. For your insight and guidance throughout this endeavor; and most of all, for
your empathy regarding the challenges of balancing work, family, and education. I admire all that
Abstract
The proliferation of autonomous Wireless Sensor Networks (WSN) has spawned research seeking
power efficient communications to improve the lifetime of sensor motes. WSNs are characterized
by their power limitations, wireless transceivers, and the converge-cast communications
techniques. WSN motes use low-power, lossy radio systems deployed in dense, random
topologies, working sympathetically to sense and notify a sink node of the detectable information.
In an effort to extend the life of battery powered motes, and hence the life of the network, various
routing protocols have been suggested in an effort to optimize converge-cast delivery of sensor
data. It is well known that reducing the overhead required to perform converge-cast routing and
communications reduces the effects of the primary power drain in the mote, the transceiver.
Furthermore, WSNs are not well protected; network security costs energy both in computation and
in RF transmission. This paper investigates the use of a Mobile Ad-hoc Networking (MANET)
routing protocol known as B.A.T.M.A.N. in WSN. This thesis proposes that the features of
B.A.T.M.A.N. in the MANET realm may prove beneficial to the WSN routing domain; and that
slight modifications to the routing technique may prove beneficial beyond current protocol
technologies. The B.A.T.M.A.N. variant will be compared against the contemporary LEACH
Table of Contents
1 INTRODUCTION ... 1
1.1 PROPOSED SOLUTION ... 2
1.2 PURPOSE ... 3
2 BATMAN ROUTING PROTOCOL ... 4
2.1 PROTOCOL DESIGN ... 5
2.2 SIMULATING BATMAN ... 7
3 TEST CASES ... 11
4 USING NS-3 TO SIMULATE SENSORS ... 24
4.1 PHYSICAL RF MODEL REUSE ... 24
4.2 SENSOR MAC MODULE ... 29
4.3 SENSOR HELPER CLASS ... 31
4.4 POWER DISSIPATION ... 32
5 THE LEACH PROTOCOL ... 33
5.1 BENEFITS OF LEACH... 35
5.2 CONVERTING NS-2 BASELINE CODE ... 36
5.2.1 Assumption 1 ... 37
5.2.2 Assumption 2 ... 38
5.2.3 Assumption 3 ... 38
5.2.4 Assumption 4 ... 39
5.2.5 Assumption 5 ... 41
5.2.6 Assumption 6 ... 42
5.2.7 Assumption 7 ... 43
5.2.8 Assumption 8 ... 43
5.2.9 Assumption 9 ... 45
5.3 A LEACH PROTOCOL SPECIFICATION ... 45
5.3.1 State Machine Description ... 46
5.3.1.1 Initialization State ... 47
5.3.1.2 Advertisement State ... 47
5.3.1.3 Cluster Setup Phase ... 49
5.3.1.4 Schedule Creation Phase ... 50
5.3.1.5 Data Transmission Phase ... 51
5.3.2 Protocol Timing Analysis ... 52
5.4 LEACH RESULTS ... 58
5.4.1 Network Death Rate ... 59
5.4.2 Number of Cluster Heads per Round ... 63
5.4.3 LEACH Packet Rate per Round ... 68
5.5 THE REAL LEACH ... 70
6 THE BATMAN-SENSOR PROTOCOL ... 73
6.1 LEACH AS A STARTING POINT ... 73
6.1.2 LEACH Environment Assumptions ... 75
6.2 BATMAN INHERITANCE ... 77
6.3 BATSEN FRAME FORMATS ... 80
6.4 THE BATSEN FINITE STATE MACHINE ... 84
6.4.1 Startup Phase ... 85
6.4.2 Power Collection Phase ... 88
6.4.3 Router Selection Phase ... 90
6.4.4 Data Exchange Phase ... 94
6.4.5 Late Net Entry Operations ... 96
6.5 PROTOCOL TIMING ANALYSIS ... 97
7 RESULTS ... 99
8 CONCLUSION ... 109
8.1 KEY CONTRIBUTIONS OF THIS WORK ... 109
8.2 SUMMARY OF FINDINGS ... 109
8.3 FUTURE WORK ... 111
Table of Figures
Figure 2-1: NS-3 Software Architecture ... 8
Figure 2-2: NS-3 Component Diagram... 10
Figure 2-3: Three Node Basic Scenario ... 11
Figure 2-4: Three Node Basic Scenario Mid-way Points ... 12
Figure 2-5: Three Node Basic Scenario Data and Routing Throughput ... 13
Figure 2-6: Three Node Basic Scenario Throughput Quad-Plots ... 16
Figure 2-7: Three Node-High User Traffic Results ... 17
Figure 2-8: Three Node-High User Traffic Quad-Graph ... 19
Figure 2-9: Multi-Node Mobility Test Scenario ... 20
Figure 2-10: Multi-Node Mobility Results ... 21
Figure 2-11: Multi-Node Mobility Quad Graphs... 23
Figure 3-1: NS-3 LR-WPAN PHY Class Structures ... 25
Figure 3-2: Simulation Boundaries with Respect to Transmitter Radius ... 28
Figure 3-3: Packet Success Rate per Power Level... 29
Figure 3-4: NS-3 Sensor Module and Protocol Inheritance... 30
Figure 3-5: NS-3 SensorHelper Class ... 31
Figure 4-1: Original LEACH States ... 34
Figure 4-2: Network Compression when R = C ... 39
Figure 4-3: Network Dilation when R = a ... 40
Figure 4-4: Network Test Optimization when R = d ... 41
Figure 4-5: Probability of Node’s Self-Election per Round ... 44
Figure 4-6: LEACH Finite State Machine ... 46
Figure 4-7: LEACH Protocol Event Timeline ... 57
Figure 4-8: Simulation Layout, (A) Bottom Random (B) Bottom Uniform (C) Center Random (D) Center Uniform ... 58
Figure 4-9: LEACH Lifetime per Cluster Head count, Sink at Center, Uniform Distribution of Nodes ... 60
Figure 4-10: LEACH Lifetime per Cluster Head count, Sink at Center, Random Distribution of Nodes ... 61
Figure 4-11: LEACH Lifetime per Cluster Head count, Sink at Bottom, Uniform Distribution of Nodes ... 62
Figure 4-12: LEACH Lifetime per Cluster Head count, Sink at Bottom, Random Distribution of Nodes ... 63
Figure 4-13: LEACH Cluster Heads per Round, Sink at Center, Uniform Distribution of Nodes ... 64
Figure 4-14: LEACH Cluster Heads per Round, Sink at Center, Random Distribution of Nodes66 Figure 4-15: LEACH Cluster Heads per Round, Sink at Bottom, Uniform Distribution of Nodes ... 67
Figure 4-17: LEACH Packet Rate per Round per CH Count, Sink at Center, Uniform Distribution
of Nodes ... 69
Figure 4-18: LEACH Packet Rate per Round per CH Count, Sink at Center, Random Distribution of Nodes ... 69
Figure 4-19: LEACH Packet Rate per Round per CH Count, Sink at Bottom, Uniform Distribution of Nodes ... 70
Figure 4-20: LEACH Packet Rate per Round per CH Count, Sink at Bottom, Random Distribution of Nodes ... 70
Figure 5-1: BATSEN Frame Format ... 80
Figure 5-2: BATSEN Super Frame Format ... 81
Figure 5-3: BATSEN Base OGM Frame Format ... 82
Figure 5-4: BATSEN RX POWER OGM Frame Format ... 82
Figure 5-5: BATSEN Router Selection OGM Frame Format ... 83
Figure 5-6: BATSEN Data Frame Format ... 84
Figure 5-7: BATSEN Forwarder Frame Format ... 84
Figure 5-8: BATSEN Finite State Machine ... 85
Figure 5-9: Sink Power Level Evaluation Scenarios ... 91
Figure 5-10: BATSEN Protocol Timeline ... 98
Figure 6-1: BATSEN vs LEACH, Network Lifetime for all Scenarios ... 99
Figure 6-2: BATSEN vs LEACH, Round Length in Seconds ... 100
Figure 6-3: Network Lifetime BATSEN vs LEACH, Sink at Center of Unit Circle ... 102
Figure 6-4: Network Lifetime BATSEN vs LEACH, Sink at Bottom of Unit Circle ... 102
Figure 6-5: BATSEN vs LEACH, Cluster Heads per Round, Sink at Center of Unit Circle ... 103
Figure 6-6: BATSEN vs LEACH, Cluster Heads per Round, Sink at Bottom of Unit Circle ... 104
Figure 6-7: BATSEN vs LEACH, Direct Connect Nodes per Round, Sink at Center ... 105
Figure 6-8: BATSEN vs LEACH, Direct Connect Nodes per Round, Sink at Bottom ... 107
Table of Tables
Table 5-1: BATSEN OGM Types ... 80
Table of Equations
Equation 1 - SINR Calculation based on Signal Power (mW) ... 28Equation 2 - LEACH Cluster Head Selection Threshold ... 48
Equation 3 – Maximum Number of Nodes in a Data Frame Payload ... 52
Equation 4 – Advertisement Phase Timeout Calculations ... 53
Equation 5 – Scheduling Phase Timeout Calculations ... 53
Equation 6 – Data Phase Timeout Calculations ... 54
Equation 7 – Sink Data Phase Timeout Calculations ... 55
Equation 8- Null Time-Period ... 86
Equation 9- RX Power Time-Period ... 89
Equation 10- Node Scoring Calculation ... 90
Equation 11- Aggregated Node Count Calculation ... 90
Equation 12- Power to Sink Score Calculation... 92
Equation 13- Router Selection Time-Period ... 93
Equation 14- Sink Combine Timeout Calculation ... 94
Abbreviations and Symbols
Abbreviation or Symbol Definition
1-PPS 1 Pulse Per Second
API Application Programming Interface
ARP Address Resolution Protocol
BATMAN Better Approach To MANET
BATSEN BATMAN for Sensor Networks
bps Bits per second
Bps Bytes per second
CCA Clear Channel Assessment
CDMA Code-Division Multiple Access
CH Cluster Head
CKS Checksum
CLI Client Nodes
CPU Central Processing Unit
COMSEC Communications Security
CSMA Carrier-Sense Multiple Access
CSMA/CA Carrier-Sense Multiple Access with Collision Avoidance
dBm Decibel-milliwatts
DC Direct Connection
DSSS Direct Sequence Spread Spectrum
ED Energy Detection
ETX Expected Transmission Count
FND First Node Death
FSM Finite State Machine
GPS Global Positioning System
HC Hop Count
HNA Host Network Association
HPP High Power Peer
IEEE Institute of Electrical and Electronic Engineers IETF International Engineering Task Force
IP Internet Protocol
IPv4 Internet Protocol version 4
LEACH Low-Energy Adaptive Clustering Hierarchy
LNE Late Net Entry
LPP Low Power Peer
LR-Wpan Low-Rate Wireless Personal Area Network
LQI Link Quality Indicator
MAC Media Access Control
MANET Mobile Adhoc Network
MCPS MAC Data Serivces
MLME MAC Management Services
MPP Medium Power Peer
Abbreviation or Symbol Definition
MTE Minimum Transmit Energy
NoF Number of Forwarders
NoN Number of Nodes
NTDR Near Term Digital Radio
NTP Network Time Protocol
NS-2 Network Simulator (2nd Generation) NS-3 Network Simulator (3rd Generation)
OGM Originator Message
OLSR Optimized Link State Routing
OSI Open Systems Interconnection Model
PER Packet Error Rate
PD PHY Data Services
PDU Protocol Data Unit
PHY Physical Layer (RF) Hardware
PLME PHY Management Services
PRNG Pseudo Random Number Generator
PSD Power Spectrum Density
PTP Point-to-Point
RF Radio Frequency
RFC Request For Comments
ROLL Routing Over Low-power and Loss-networks RSSI Receive Signal Strength Indicator
SAP Service Access Points
SINR Signal to Interference and Noise Ratio
SN Sequence Number
SRV Server Nodes
ToD Time of Day
TDMA Time Division Multiple Access
TLV Type, Length, Vector
TQ Transmission Quality
TRANSEC Transmission Security
TTL Time To Live
TX Transmit
UDP User Datagram Protocol
WPAN Wireless Personal Area Network
1
Introduction
Wireless Sensor Networks (WSN) exist in a multitude of locations: military, infrastructure,
industrial, medical, and emergency response, to name a few. As the wireless sensor technology
advances, WSN permeate diverse new and remote environments, relying more and more on limited
battery power. Unfortunately, it is the wireless component of a sensor mote which accounts for a
majority of the power expenditure. Maximum energy depletion occurs during transmission,
actively listening, or receiving on a Radio Frequency (RF) channel. To maintain the life of a sensor
mote, it is imperative to reduce the RF activity yet accomplish the task of the sensor.
With the advent of the modern hacker, WSN lifetime may soon take a back seat to the security of
the network. Communications Security (COMSEC) and Transmission Security (TRANSEC) costs
energy. An increase in security primitives, computation, and complexity directly correlates to an
increase in energy expenditure. It stands to reason that a reduction in power consumption due to
routing and data delivery optimization results in more power available for the application of
network security.
The International Engineering Task Force (IETF) chartered the Routing Over Low-power and
Lossy Networks (ROLL) working group to define the requirements and develop corresponding
routing protocol standards. This group was proposed in 2007 and chartered in 2008 [1]. Thus far,
the ROLL work group published works defining routing and device requirements for each various
deployment environments [2] [3] [4] [5]. Though not considered comprehensive, the papers
attempt to identify the majority of the common operating environments, terminology, and
requirements for WSN per each given scenario. Additional Requests for Comments (RFCs)
followed shortly thereafter to develop additional requirements or supporting metrics for WSN
routing protocols.
Academics have proposed various routing protocols, commonly categorized as Flat, Hierarchical,
or Location Based routing [6]. One of the more popular algorithms is the LEACH protocol [7].
LEACH has spawned a number of variations to compensate for inadequacies found in the original
consumption across the entire WSN. LEACH claims that the hierarchical routing protocol is
superior to flat routing protocols.
In spite of the proliferation of LEACH and other Cluster Head (CH) based approaches, others still
continue to investigate Flat routing protocols [8] [9] [10]. Flat routing and hybrid protocols have
been shown to compensate or outperform Hierarchical routing protocols in various deployment
topologies and for varying data-source transmission rates. Regardless of the academic’s preference
for protocol categorization, the ultimate goal of routing in WSN is to reduce transmission overhead
and inversely increase the WSN lifetime, all while satisfying the particular requirements of the
system.
1.1 Proposed Solution
This thesis explores the use of the B.A.T.M.A.N. protocol, a Flat routing algorithm originally
designed for optimized Mobile Adhoc NETworking (MANET) wireless networks, in WSN [11].
BATMAN is a flat decentralized routing protocol; wherein individual nodes have no knowledge
of the route to an end-point other than the best next-hop address. BATMAN uses a small User
Datagram Protocol (UDP) over Internet Protocol (IP) datagram, with a maximum length of 52
bytes, which is relatively close to the IEEE 802.15.4 frame payload length. BATMAN can operate
at either the Network Layer or the Link Layer depending on implementation methodology.
The attractiveness of BATMAN derives from its fast convergence, stable horizontal handover, and
low overhead [12]. In BATMAN, each node periodically broadcasts an Originator’s Message
(OGM) that includes Source Address, Transmitter’s Address, Time To Live, Hop Count, a
Transmission Quality (TQ) metric, and Sequence Number. Receiving nodes retransmit the OGM
substituting its address for the Transmitter’s Address in the forwarded OGM and updating the TQ
metric with respect to the forwarder. It is up to each node to determine which next hop to use when
sending traffic to the source of the OGM. Additionally, by rebroadcasting the OGM, link symmetry
is established.
As with any other routing protocol, BATMAN is not without its faults. BATMAN does suffer
shown slightly higher delay or lower bit rates when the source or destination of a packet is in
motion [13]. In spite of these faults, there is still a potential use of BATMAN or a BATMAN
derivative protocol in WSN.
Based on the fundamentals of WSN, some of the undesirable effects of BATMAN can be nullified.
Given the assumption that WSN nodes do not move post deployment [7], the source-destination
movement issue is minimized. Furthermore, many of the WSN Media Access Control (MAC)
protocols allow periodic synchronization, reducing the impact of temporary hidden nodes [14].
Therefore, node loss will be more likely due to a damaged node or a node suffering a complete
power loss.
The proposed solution is to port and modify the BATMAN protocol in support of WSN operating
on IEEE 802.15.4 capable sensor motes. Using the fundamentals of BATMAN, the protocol will
be enhanced by modifying the basic OGM format; wherein the Sink node generates a periodic
synchronization OGM that is forwarded throughout the network. Sensors nodes send their own
OGM, but do not forward non-Sink node OGMs. Additionally, the packet format will include, at
a minimum, mote residual power level and transmitting power level. These modifications will help
establish bi-directional relationships as well as aggregation points in the flat network emulating
CHS normally seen in Hierarchical Routing Protocols.
1.2 Purpose
This research compares and contrasts an innovative flat routing protocol, based on the
B.A.T.M.A.N. project, against traditional wireless sensor networks routing protocols to effect
power efficient, reliable communications that support more realistic deployment environments and
2
BATMAN Routing Protocol
The BATMAN routing protocol is a derivative work from the IETF OLSR effort. OLSR derived
partially from the LEACH protocol, which in turn, was based on the EPLRS radio system. OLSR
derives its technical advantage from the use of elected Multi-Point Relays (MPR). MPRs function
in a similar manner to that of the CHs in LEACH, except that MPRs support inter cluster routing
within Mesh Networks while CHs support Node to Sink forwarding in Sensor Networks.
With OLSR, MPRs reduce the overall broadcast traffic by funneling all broadcast, multicast, and
control traffic through nodes elected by their peers to act as local MPRs. However, early testing
of OLSR(v1) [15] showed significant problems. Nodes typically selected MPRs with a maximum
range in order to reduce the number MPRs elected, but this resulted in unstable and asymmetric
links to MPRs. Furthermore, OLSR frequently resulted in routing loops and route flapping, so
typical of the MANET environment. Minimum hop-count was the basis of OLSRs routing
decision which caused an increase in packet loss due to unstable links and increased collisions.
In early 2004, a group of OLSR designers discovered many of the afore-mentioned deficiencies
[16]. As mesh sizes increased, the fundamental features of OLSR became the hindrance of the
network. The group of developers evolved their version of OLSR, neutering the protocol of many
of the features, in order to achieve a working solution. In the end, removal of the features allowed
for some level of functionality, but with no discernable advantage over traditional routing
protocols.
It was this group that then decided to pursue a non-OLSR approach to MANET routing in an
attempt to alleviate a number of design flaws in OLSR. The new approach centered on the use of
link quality rather than hop-counts for route selection, the elimination of MPRs, scaled
transmission of control messages based on neighbor hop distance, and limiting Djikstra
calculations to local neighborhoods to avoid massive full MESH recompiling. It was this work
that became the forbearer to the Better Approach To Mobile Adhoc Networking (B.A.T.M.A.N.).
BATMAN was developed as a standard Layer 3 routing protocol. At the time of this writing, the
the algorithm transitioned to a Layer 2 virtual device driver exchanging frames rather than IP
packets.
2.1 Protocol Design
The BATMAN protocol identifies participating nodes as Originators; all originators periodically
transmit Originator Messages (OGM), announcing their presence and knowledge of distant
neighbors. BATMAN is a proactive routing protocol, but BATMAN does not transfer and
converge complete routing tables amongst peers. BATMAN attempts to determine the best
bi-directional neighbor in which to send a packet in the direction of the destination node.
BATMAN employs OGM transmissions as the method of announcing node presence to peers.
OGMs are forwarded by neighboring nodes so that distant nodes eventually gain knowledge of
other nodes. It is intuitive that this methodology induces flooding in a network; forwarding a
frame for every received frame increases bandwidth utilization exponentially. Therefore,
BATMAN relies on OGM aggregation, sliding window Sequence Numbers (SN), and variable
Time To Live (TTL) values to limit the number of OGMs transmitted.
The TTL field in OLSR varied based on target neighbor distance and purpose; this was done to
support MPR election and reduce multi-hop flooding. BATMAN returned to the use of a standard
TTL counter that decrements for every forwarded transmission. The default TTL value is 50 hops,
though the value is configurable. Since every node in BATMAN may be selected as the best
next-hop in a packet flow, all nodes need information about neighbors and distant nodes. The TTL
simply restricts the diameter of the network.
Flooding OGMs will eventually overwhelm any medium, given enough nodes. Therefore,
BATMAN IV introduced OGM aggregation to improve frame efficiencies. When a node
generates an OGM, additional OGMs from neighbors are appended. Upon receiving an OGM
from another node, the protocol engine checks the OGM for validity and the newest sequence
number for a given origin. New OGMs are queued and then later appended to the local node’s
To determine the freshness of an OGM, BATMAN uses a Sliding Window algorithm with the
sequence number. The sequence number is a 16-bit value incremented for every sourced OGM;
when 65535 is reached the SN is rolled over to 0 for the next OGM. BATMAN records the latest
SN received from every source. When calculating Transmission Quality, described shortly,
packets are evaluated over the previous 64 sequence numbers. Duplicate SNs received from a
particular originator are discarded.
Traditional routing protocols rely on the assumption that wired links provide a binary state,
connected or disconnected. Therefore, the baud rate of the wired link translates to a metric that is
used to evaluate an optimal routing path. In order to support multiple peers on a single interface,
full-duplex media require the connection via multiport switch and half-duplex media, such as
CDMA links, requires multiple drops on the same line. Regardless of configuration, multi-point
wired connections have a level of availability not normally experienced with wireless
communications.
Point-to-point wired connections segregate the collision domains (Layer 1 and 2) when multiple
nodes form a network, yet the broadcast domain (Layer 3) is effectively contiguous throughout the
network due to forwarding at Layer 2. Multi-point wired connections combine the collision and
broadcast domains on a single, wired segment. Though bandwidth is restricted on multi-point
wired links, to allow for collision detection, all nodes on the segment can detect potential
collisions. Scaling the modem’s preamble and the maximum length of the wired link to the
propagation latency through the medium ensures collision detection.
Unlike wired connections, wireless links exist on a shared medium that inconsistently combines
broadcast and collision domains. The wireless medium complicates the channel access in that
links are transient, vary in quality, may be multi-hop in nature, and frequently produce hidden
nodes. Therefore, the binary wired link status and bandwidth-based metrics do not correlate well
to wireless links.
BATMAN attempts to rectify the inequities of the wireless medium and binary link state protocols
OGM messages to relay the quality of a bi-directional link to peers. In total, there are three TQ
concepts in use: Transmit TQ, Receive TQ, and Echo TQ. All three TQ values are calculated on
a per peer basis. The Receive TQ is the count of received packets from a 1-hop peer. Echo TQ is
the count of a node’s OGMs received due to rebroadcasting from a 1-hop neighbor node. The
Transmit TQ for any given 1-hop neighbor is the ratio of the Echo TQ from the peer to the Receive
TQ from the peer.
For a source node, when an OGM is created, the TQ value is set to the maximum (255) byte value.
A receiving neighbor will multiply its local Transmit TQ, calculated for the source node, with the
TQ in the OGM. When the OGM is forwarded, the TQ is replaced by the resultant, providing its
neighbor a quality-based metric in the direction to the source.
2.2 Simulating BATMAN
Many of the research papers evaluating BATMAN rely on empirical testing. Though the data is
real data, it is inherently stochastic between tests of differing protocols, and even between
iterations of the same protocol. Simulations are typically deterministic and allow for little to no
variance in test runs. Thus, a more advanced simulator is required; one that can provide
deterministic results per scenario yet inject a level of randomness between test iterations to detect
the nuances of a protocol.
To validate the findings in [17] [18] [19] [20], the BATMAN IV algorithm was ported to the
NS-3 simulation environment [21]. Much of the contemporary research on BATMAN applies to the
BATMAN-adv package, having a richer feature set and a more mature code base. Support for the
original BATMAN Layer-3 package discontinued in 2009 with the advent of the BATMAN-adv
package.
The original BATMAN-0.3.5 package is implemented as a traditional Layer 3 based protocol,
where the routing module exchanges UDP packets with peer nodes. In 2007, the BATMAN team
began experimenting with a Layer 2 based approach, exchanging frames with peer routing engines
and abstracting the physical interfaces from the stack using a virtual BATMAN interface. This
The chosen simulation environment is the well-known, open-source NS-3 simulator. The NS-3
simulator is a full stack, event driven simulator supporting various MAC-Phy implementations,
networking protocols, transport protocols, and even some applications. NS-3 comes with an
OLSRv1 routing package running on top of Layer 3. However, NS-3 does not extend capabilities
for virtual interfaces, making a port of BATMAN-adv too lengthy of a process, with too little
return value. Therefore, it was reasonable to port the BATMAN-0.3.5 code base as a routing
package within NS-3.
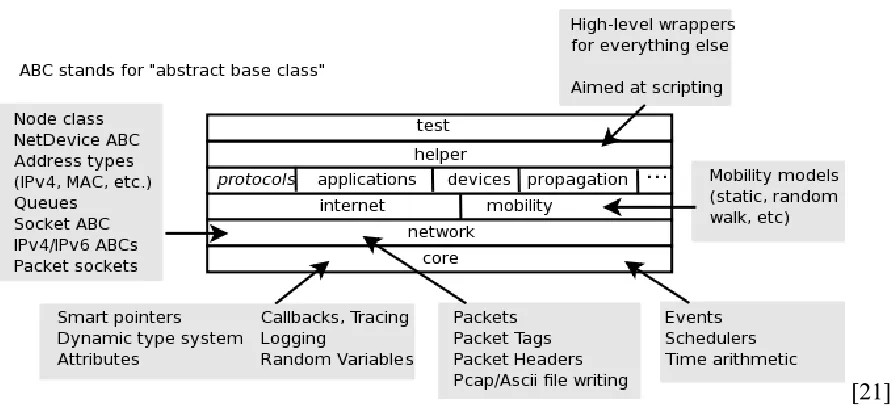
[image:19.612.85.531.233.436.2][21]
Figure 2-1: NS-3 Software Architecture
The NS-3 simulator instantiates all OSI layers 1 through 7 on top of a core simulator package. The
Core package provides the smart pointer object model, simulation event core, C++ templates, and
supporting macros. Packages at all levels in Figure 2-1 may access the core methods to create
events or trace data.
The Network layer comes equipped with various MAC-Phy implementations, such as IEEE
802.11, IEEE 802.15.4, IEEE 802.16, and LTE. Of particular interest for this portion of the
research, the 802.11 provides a complete MAC-Phy implementation to include the Ad-hoc mode
Mesh capabilities of WiFi. The Internet layer provides both IPv4 and IPv6 stacks and Address
The OLSRv1 implementation exists at the Protocol layer. To implement the BATMAN protocol,
the OLSR module was copied and renamed. The core Finite State Machine (FSM) within the
OLSR engine is replaced with the FSM straight from the BATMAN 0.3.5 source repository. The
routing table update mechanisms, socket operations, and interface configuration remains identical
to the OLSR to avoid complications due to rewriting existing software.
Support files for the BATMAN protocol, such as the HNA and data structures files are also copied
directly from the BATMAN repository. All code is converted to C++ and when possible, C data
structures are replaced with C++ objects to allow for the Object-Oriented Design of the simulator.
This method was chosen over implementing sets of void pointer C callback functions.
Implementation and registration of C callback functions would require an extensive C to C++
interface-abstraction layer.
For testing the routing protocol, a UDP Client-Server pair would be implemented on certain nodes
in the network. The application applied to specific nodes in a test script guaranteed identical
network loading between OLSR and BATMAN simulation runs. However, the standard UDP
Client-Server applications are lacking in their tracing capabilities.
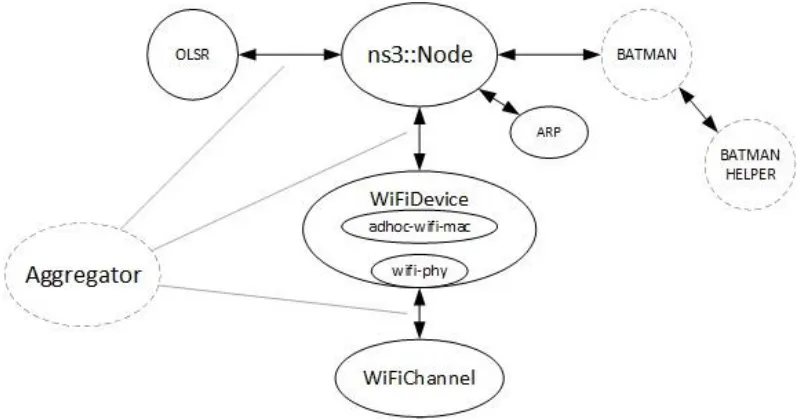
A new class, called the Aggregator, is introduced to the simulator to support evaluation of the
BATMAN protocol. The Aggregator collects information at any level of operation based on
registered callbacks from nodes or objects within a node. The Aggregator collects data based into
three categories through callback function; categories are named User Data, Routing Data, and
Other. As packets or frames are collected for each category, they are included in an additional
category called Total, used to determine the aggregate traffic for a given connection. Data may
also be written to a file for post processing at the completion of a simulation script.
The type of traffic collected by the Aggregator is specific to the point at which the Aggregator is
connected to the simulation. Therefore, an AggregatorHelper class is provided to simplify the
connection of an NS-3 container of nodes to a single aggregator. The Helper implements an Install
method that checks for various levels of the ns3::NetDevice for protocols, applications, and
The Aggregator can track Packets generated by a UDP Client or Server, packets generated by a
Routing Protocol, and Frames transmitted and received at the MAC-Phy layer. When a packet is
created at any level of the NS-3 simulator, the packet is always identifiable through the metadata
that is attached to the packet. Note that packet metadata is simulator specific and is not counted
against the packet in the simulation throughput calculations. When a packet is pushed down or up
an OSI layer, the packet is still identifiable by the packet ID which helps associate MAC level
frame transmissions and receptions with packet reads and writes.
Since the testing is limited to routing protocol and UDP Server packets, additional frames can only
be attributed to 802.11 control frames, ARP Requests, and ARP-Reply frames. Therefore, the
Aggregator can determine the amount of overhead required at Layer 2 to provide services to the
IP stack. This is critical in determining when and how often handovers occur, causes of routing
[image:21.612.107.507.354.564.2]protocol loops and failures, and pauses in data exchanges.
Figure 2-2: NS-3 Component Diagram
BATMAN, as written in C, adheres to traditional Linux style lists and data structures. The
complex data types were converted to C++ variants when possible. Hash tables were converted to
linked lists using the standard library list class. It should be noted that the conversion of the hash
tables to a C++ standard list may have introduced priority inversions or incorrect selections when
3
Test Cases
Figure 2-2 provides an overview of the NS-3 architecture when simulating the OLSR routing
protocol over an IEEE 802.11 MAC-Phy operating in ad hoc mode. In a similar fashion, the
BATMAN code was ported to an NS-3 module. A top-level simulation script was written to
automate the iterative test and instantiation of necessary protocols and statistical collection
databases.
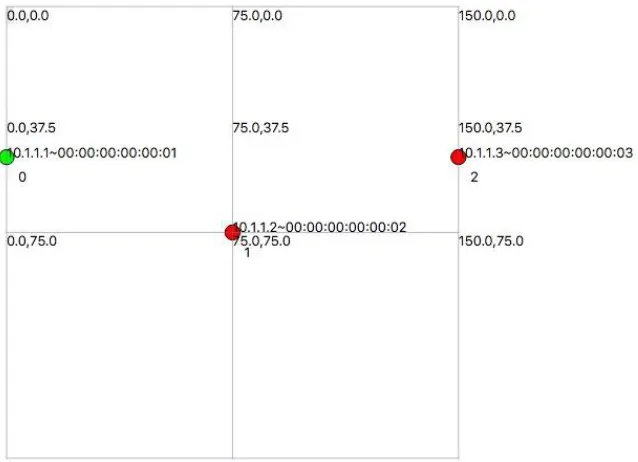
The first test case was used to determine if the BATMAN routing protocol worked, and if so, what
the relative rate of convergence was with respect to OLSR. In the scenario, three nodes are spaced
approximately 84m apart linearly. Station pairs {0,1} and {1,2} have bidirectional
communications, but pair {0,2} are out of range at 150m. The layout is demonstrated in the
NetAnim screen capture in Figure 3-1.
The network is powered up and 2 seconds are allowed to pass to let the protocols kick off their
initial messaging. Station 0 is running a UDP Echo Server and Station 2 is running a UDP Echo
Client. The UDP Echo Client begins transmitting a 1024-byte packet to the server every 250ms
[image:22.612.167.486.440.671.2]after the first 3 seconds.
After the first 2 seconds, both stations 1 and 2 begin a slow movement, approximately human
walking speed, towards station 0. By 12 seconds, stations 1 and 2 reach their closest point and all
[image:23.612.172.441.199.435.2]stations have full bi-directional communications capabilities. The positions are demonstrated in
Figure 3-2. At 20 seconds, nodes 1 and 2 begin to move back to their original positions, at a faster
movement rate, and complete their movement by 24 seconds.
Figure 3-2: Three Node Basic Scenario Mid-way Points
Points of interest throughout the simulation include the time till first transmission, time till
convergence when {0,2} are in range, and time till re-convergence as {0,2} separate. More subtle
items to look for are asymmetric routing paths, route flapping, and routing loops. The UDP Client
is configured to transmit a 1024B packet every 250ms. The UDP Server responds to any received
packet by retransmitting the original packet back to the client. This results in a maximum of 8KBps
offered payload to the system.
The scenario was executed 50 times for both the BATMAN and OLSR protocols. The NS-3 script
uses two for-loops to implement Iterations and Runs. A Run through the scenario is a single
random number generator seed. An Iteration consists of two Runs of the scenario, each run using
an identical PRNG seed, but different routing protocols.
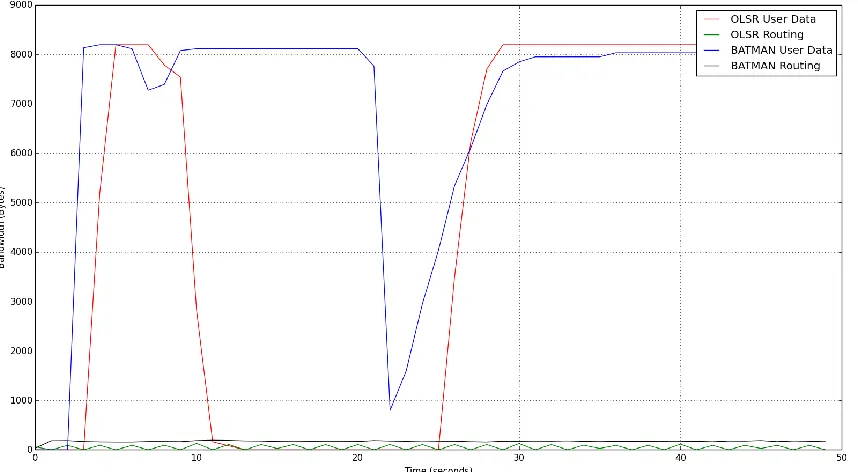
Figure 3-3 presents the results of 50 iterations of the basic three-node scenario. The Aggregator
module groups packets or frames that were transmitted and received into one second bins, and
separates the data based on user data, routing data, and total data for every second of the simulation.
The data for all runs of a protocol are averaged for each 1-second interval and then plotted using
the Python matplotlib library.
The first point of interest is the delay in start of data exchanges between the BATMAN and OLSR
protocols. BATMAN converges 1.25sec faster in this scenario, thus BATMAN begins exchanging
[image:24.612.93.522.342.578.2]data by 3sec and OLSR typically does not begin exchanging data until 4.25sec.
Figure 3-3: Three Node Basic Scenario Data and Routing Throughput
A more significant event is revealed as time progresses in the scenario. At approximately 10
seconds, OLSR suffers a complete loss of user data communications. The loss of user data
exchanges continues until approximately 27 seconds, where the nodes have nearly reached their
except for a short 4 second period. During this period, the BATMAN user throughout is reduced,
but not completely lost.
Looking at the raw data, the period where BATMAN drops packets, packets from the Client reach
the Server, but Server packets do not reach the Client. This is an indication of an asymmetric
routing path. The cause of the asymmetry is due to the slow decay in the Server’s TQ values with
respect to the Client. The TQ value directly to the client is so much larger than that of the forwarder
node, that it takes approximately 3 seconds for the server to identify that it has lost connectivity
with the client.
Though the server takes 3 seconds to identify the loss of communications with the client, the
client’s TQ recovers rapidly, and traffic from the client is able switch back to using node 1 as a
forwarder. This implies that the TQ algorithm may not be as stable as purported and may be
inclined to creating asymmetric routes.
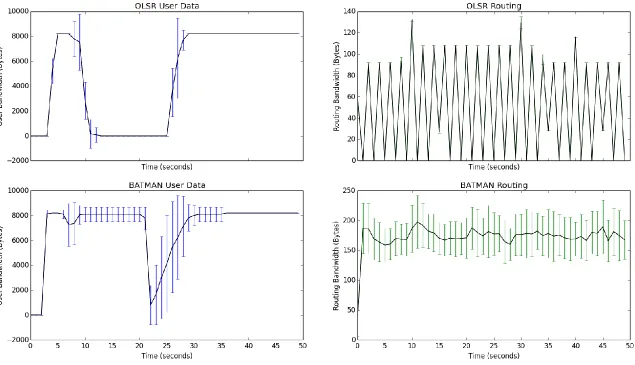
Figure 3-4 provides the four plots as individual graphs and includes standard deviation error bars
to demonstrate the skew in performance across the 50 iterations. OLSR’s user data throughput has
very little deviation per iteration, which nearly guarantees long service outages during periods of
transition. However, OLSR has a periodic, low routing message overhead. When the transition
occurs, there is a temporary spike in routing traffic, followed by a 17% increase in steady state
routing overhead.
Unlike OLSR, BATMAN is much more volatile. About half way through the first movement
phase, there is a short period of volatility. BATMAN has an internal jitter mechanism that
randomly offsets OGM generation in an attempt to avoid OGM collisions. As the radios move
closer, there are instances wherein collisions occur with OGM or UDP data packets. Later, at 21
seconds, BATMAN may lose user data services or simply suffer from an invalid asymmetric route.
In Figure 3-4, the error bars in the BATMAN User Data graph demonstrates the effects of OGM
packet jitter through stochastic testing. The movement pattern does not change across test
produces different transmit times for OGMs within the standard 2 second OGM period. By varying
transmit times, reception varies and thus OGM aggregation may be delayed which varies the
efficiency of the protocol at the MAC layer.
Inefficiencies at the MAC layer may result in various effects on the system. At Layer 2, inefficient
use of the medium results in increased collisions, lost frames, or an increased number of frames
sent per available transmit OGM data. The Layer 2 issues thus affect the Layer 3 protocol in that
Transmit TQ and Echo TQ values are artificially reduced or skewed, peer OGMs arrive late and
cannot be aggregated, and user data starves due to increased routing bandwidth requirements.
These effects are demonstrated through the relatively large standard deviation throughout the
movement phases (5 seconds through 35 seconds) of the scenario.
The standard deviation is also apparent in the BATMAN Routing bandwidth graph of Figure 3-4.
The average throughput is expected to hold around 182Bps. Each node produces a 54-byte OGM
with a 20-byte IPv4 header. When aggregated, the maximum packet is expected to be 182-bytes.
The error experienced is typically in the negative direction, in that the delayed reception of an
OGM from a peer results in a station’s retransmitting the OGM in a separate packet. Since the
Aggregator is separating transmitted routing data into 1-second bins, a late OGM could get echoed
late enough to have its data accounted for in the next time slice rather than the time slice in which
Based on the results of Figure 3-4, BATMAN certainly seems promising. Though OLSRs routing
bandwidth is periodic and lower than BATMANs, BATMAN does seem to limit the routing traffic
required and results in a faster convergence, and thus improved user data performance. But this
theory must be tested in other environments to determine the reliability of the results of the first
scenario.
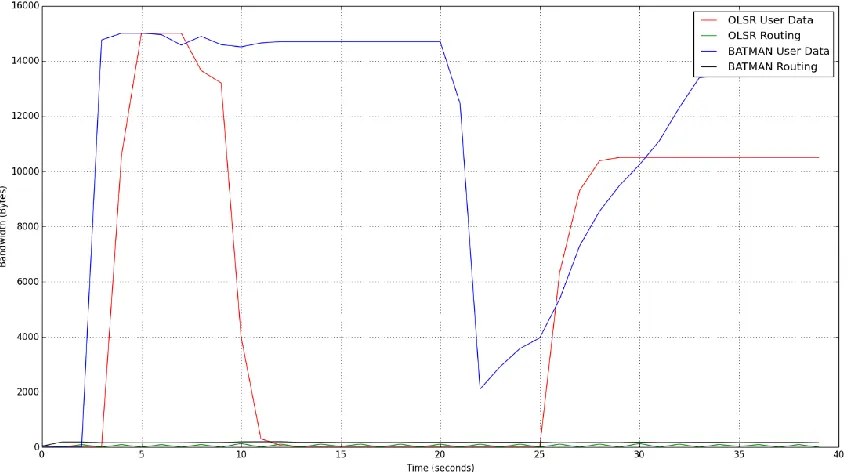
Next, the same scenario was retested but with a higher offered user data load. If timing instability
affected BATMAN negatively, increasing user data traffic may have additional effects on one or
both protocols. For this test, the UDP Echo Client produces a 1500 byte packet every 2ms. With
the Echo Server response included, the offered load to the network is approximately 15KBps. The
resulting average user data throughput is presented in Figure 3-5.
The initial layout of the curves in Figure 3-5 match the curves of Figure 3-3; however, the recovery
of the user data after 21 seconds is dampened for both protocols. BATMAN eventually recovers
over a much larger period than before, but it does achieve the sourced 15KBps data rate. OLSR,
[image:28.612.94.521.438.674.2]curiously, never achieves the full 15KBps post convergence.
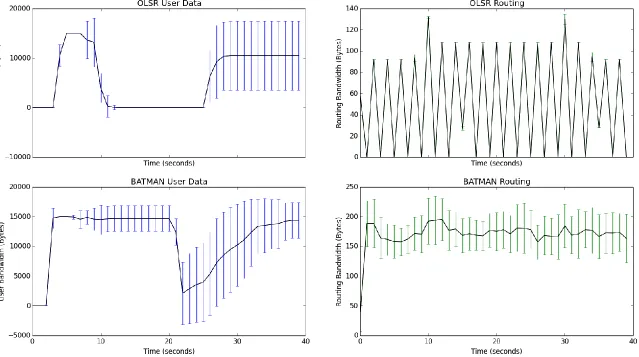
The individual curves for data throughput and routing throughput per protocol are presented in
Figure 3-5. Unlike the previous test, the OLSR User Data graph shows a high level of error after
the 25 second mark. The evaluation of the instability is outside of the scope for this thesis. It is
interesting that the OLSR Routing throughput curve looks identical to the OLSR User Data curve
in Figure 3-4.
The BATMAN User Data curve has an increase in standard deviation (error) at around 7 seconds.
The BATMAN Routing curve looks similar to the previous scenario. Thus, it is assumed that the
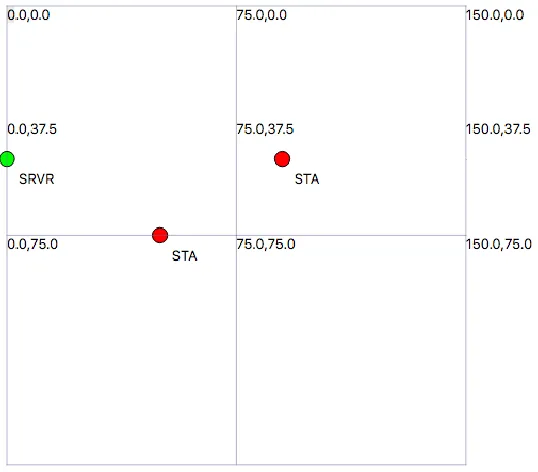
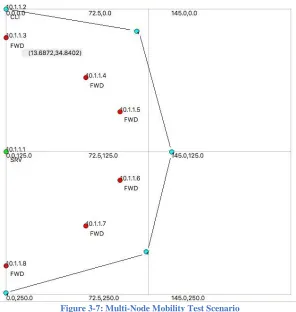
A second more complex scenario was implemented, as displayed in Figure 3-7, to test multiple
convergence events for a minimum of 1-hop forwarding of user traffic. In the scenario, the CLI
nodes executes the UDP Echo Client, and the SRV node executes the UDP Echo Server. The
Client moves around the periphery of the network, never achieving direct connectivity with the
Server. The movement is circular and theoretically should result in the Client and Server switching
next-hop routers from 10.1.1.3 to the 10.1.1.8, in the order of increasing IPv4 addresses as the
[image:31.612.156.452.235.547.2]Client traverses the physical space.
Figure 3-7: Multi-Node Mobility Test Scenario
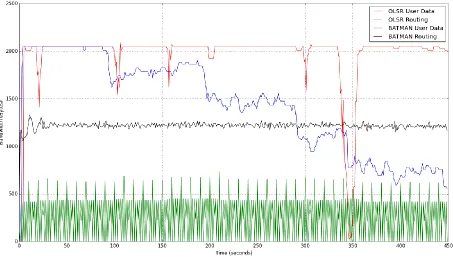
The combined results of the scenario are presented in Figure 3-8. The first item to note about
BATMAN is the notional ceiling on the routing protocol overhead. There are 8 nodes in the
system, each generating a 54-byte OGM. With forwarding added to the system, one might expect
each node aggregating other OGMs for a combined total of 452-byte packets (including the
20-byte IPv4 overhead). For 8 nodes transmitting 452B at approximately every 2 seconds, the offered
assumed that the aggregation and other features of BATMAN are at play, capping the maximum
routing overhead as described in [11].
An oddity in the graph is the general decline in user throughput for BATMAN while OLSR
presents a responsive recovery for each transition, much the opposite of the behavior in the first
scenario. Post processing autogenerated Wireshark Pcap files and reviewing NetAnim video
produced by the simulator show instances where the next-hop address selection is failing in one or
both directions of the traffic flow. The TQ values are not transitioning fast enough to allow for a
full hand-over. An excellent example is the movement of the client towards the 10.1.1.4 node. It
is apparent that the Server continues to forward traffic through the 10.1.1.3 node while the Client
sends traffic through the 10.1.1.4 node. This asymmetry increases as the Client moves across the
[image:32.612.76.529.342.602.2]physical network space.
Figure 3-8: Multi-Node Mobility Results
Figure 3-9 separates the curves in Figure 3-8 for improved readability. The degradation in user
data bandwidth shows a high level of variability across the test iterations. Some test iterations,
though still degrading performance, do not drop as dramatically as the error bars demonstrate.
The data presented does not match the findings in [17] [18] [19] [20]. There are two major sources
of error that may cause the inconsistency: porting error, and outdated source code. The most
obvious source of error is the conversion from C to C++. Actions such as converting C Hash tables
to C++ standard library classes may have inadvertently modified behavior and/or performance.
There is also the possibility that the BATMAN 0.3.5 development branch, which is no longer
supported, may have inherent bugs. Since the scope of the thesis does not include the debugging
4
Using NS-3 to Simulate Sensors
The NS-3 simulation application was used to compare LEACH and BATSEN in a more realistic
environment. 3 is the third generation of the Network Simulator. 3 is superior to its
NS-2 predecessor in that NS-3 provides a higher fidelity, real time, event driven simulation at all levels
of the Open Systems Interconnection (OSI) model.
Ns-2 couples C with the Object-TCL/TK scripting language to implement modules. Ns-2 modules
are generic abstractions of various layers of the OSI model and do not reflect reality in most cases.
NS-3 uses C++ coupled with Python to support an Object Oriented, Smart-Pointer paradigm as the
foundation of the simulation package. Frames, packets, and Protocol Data Units (PDU) can be
passed to multiple receivers and tracked via callback methods. NS-3 provides a high-fidelity
model of each layer of the OSI based on physical reality, kernel system calls, and software APIs.
NS-3 does not provide an “out of box” sensor module, but it does support a well-documented and
advanced event driven simulation environment. To test sensors, NS-3 requires the development
of a sensor module, a Data Source, and a realistic PHY that can support both CSMA/CA and
TDMA channel access methods. For the purposes of this experiment, high fidelity in data sources
is not necessary, as frame or packet tracking is all that is required for protocol statistics at this
point. The target protocols will function at the sensor module level. Therefore, the first step in
simulation is determining the best method to simulate a realistic PHY.
4.1 Physical RF Model Reuse
An NS-3 focus group, mostly individuals from Boeing Corp, implemented a model of the IEEE
802.15.4 2006 standard as the Low Rate WPAN module or lr-wpan. The lr-wpan module
implements the four services and Service Access Points (SAP): MAC Data Services (MCPS),
MAC Management Services (MLME), PHY Data Services (PD), and PHY Management Services
(PLME). The group also created an error rate model based on the 2.4 GHz Additive White
As illustrated in Figure 4-1 The lr-wpan-phy class inherits from the NS-3 SpectrumPhy class.
Lr-wpan provides for various data rates ranging from 20Kbps to 250Kbps. The 127-byte frames
specified in the IEEE standard are identical to the expected frame size in wireless sensors. It
should be noted that the PHY does not account for preamble or sacrificial waveform times
traditionally inherent in a wideband waveform. The PHY simulates the frame exchange as if they
were packets, where the time of reception is the first bit of received payload data or frame header.
The lr-wpan-phy uses a 16-bit MAC address, capable 65,536 addresses. This is considered
sufficient for simulation purposes. IEEE 802.15.4 is designed to be a Personal Area Network
(PAN), and thus the transmission radius is kept below 100m. It would be impractical to deploy
over 65536 nodes in a 100m radius. The address is set through the SetAddr method, which will
allow a Sensor MAC to readily deploy unique and trackable PHYs in the simulated environment.
The lr-wpan-phy provides the StartRx, EndRx, PdDataRequest, and EndTx as the primary
interface between the channel and the MAC layer objects. All other methods provide various
services based on the IEEE 802.15.4 specification. An enumerated type, known as
LrWpanPhyEnumeration provides a naming convention for various states of the physical interface,
[image:36.612.131.482.462.670.2]and are reusable for the sensor project.
The lr-wpan-phy class provides methods to attach to various channels such as the
SingleModeSpectrumChannel. When transmitting, a lr-wpan-phy object creates a PacketBuffer
paired with a SpectrumSignalParameter and passes the pair to the channel via the
SingleModelSpectrumChannel::StartTx method. This method determines the propagation delay,
path loss, and any gain from the transmitting and receiving antennas before scheduling a start of
receive event. This process is performed for all nodes active on the channel regardless of
transceiver state.
The NS-3 SpectrumPhy uses the NS-3 SpectrumSignalParameters and SpectrumValue classes to
perform data transfers and power calculations for the channel. The SpectrumValue object presents
an interface to the SpectrumModel class, and implements the frequency-dependent math for PSD
aggregation, Signal to Interference and Noise Ratios (SINR), propagation losses, etc. A static
SpectrumModel object provides a common method for a developer to implement a list of
frequency bins based on the PHY’s spectrum mask.
The SpectrumSignalParameters class contains the pointer to an active SpectrumValue object, the
channel the spectrum is operating on, and the model of the transmitting antenna. A node that
transmits onto a channel, passes the SpectrumSignalParamters along with packet information such
that potential receivers may aggregate the PSD for the given transmission, determine if the signal
is strong enough for reception, and locate the received packet reference from the NS-3 core post
reception.
It is important that all nodes on a channel process the reception, even if the node is sleeping or
transmitting. It is possible that a node transitions from transmit to receive, or from sleeping to
receiving. By aggregating signals based on event times, nodes are guaranteed to have an accurate
sense of the RF when the transceiver is set to receive. Pre-existing signals act as interference and
adjust the SINR accordingly.
The PHY supports a Clear Channel Assessment (CCA) to support the CSMA/CA channel access
as defined in the IEEE 802.15.4 section 7.4.2. An existing lr-wpan-csmaca class provides the
must first set the transceiver state to receiving, or Idle, and then issue the CCA Request. The
CSMA module performs a callback to the PHY with a success or failure status, which is then
forwarded to an attached MAC protocol.
The 802.15.4 waveform provides for a Slotted and Non-Slotted CSMA/CA protocol. To support
various sensor protocols, the unslotted method is used. For generic sensor processing, a method
of forcing a transmission with the use of CSMA needs to be created. It was determined that no
changes to the lr-wpan need be made to support such a mode of transmission; rather, the
implemented MAC need only modify its sensor-state transitions to support a Forced-TX mode of
operation.
The PHY also supports an Energy Detection (ED) to support the CSMA/CA channel access as
defined in the IEEE 802.15.4 section 6.9.7. In some cases, 802.15.4 measures the energy on a
channel without regard for modulation. The SpectrumPhy aggregates power from all signal
sources. When the ED functionality is enabled, the simulator begins sampling the total power on
the channel. At every start or stop of a transmission, the simulator incorporates the new aggregate
power level to a running average. When the ED process is complete, the module produces an
integer value between 0 and 255.
The ED value can be used individually or in conjunction with the CCA feature to detect channel
activity. Since this project will not introduce co-site interference from non-802.15.4 transceivers,
the ED feature is not required. The ED feature also adds some complexity to the protocol
development and provides no immediate value to this project at this time. Therefore, the ED
functionality is disabled for the development of the sensor simulation.
The PHY does not detect or deliver SINR, rather it returns a Packet Error Rate (PER) or Link
Quality Indicator (LQI), assuming the user implements the error model. If no error model is added
in the user script, a perfect LQI is returned every time, and it is up to the random number stream
to perform a loss rate on the frames. The authors set the sensitivity of the PHY to -106.58dBm, or
To support SINR evaluation and information exchanges a LrWpanSinrTag class was developed
based on the LrWpanLqiTag. The LrWpanSinrTag inherits from the ns3::Tag class, and can be
aggregated as metadata to a packet. The phy::StartRx and
lr-wpan-phy::CheckInterference methods are modified such that a SINR value is derived by dividing the
active signal’s power by the total aggregate power on the channel. Power is calculated in
milli-watts, and thus Equation 1 is used to determine the SINR of a receive signal.
𝑆𝐼𝑁𝑅 = 10 × log ( 𝑃𝑊𝑅𝑆𝐼𝐺
𝑃𝑊𝑅𝑇𝑂𝑇𝐴𝐿)
Equation 1 - SINR Calculation based on Signal Power (mW)
To determine the maximum testable area within NS-3, as demonstrated in Figure 4-2, the
prepackaged test script lr-wpan-error-distance-plot.cc was adjusted to test for 99% success rates
on 100-byte frames. The frame length chosen should provide 100% success for smaller control
frames at maximal distances and provide a high rate of success when frames are filled to their
maximum 127-bytes.
Figure 4-3 presents the resulting PER curves for three power levels: HIGH 1dBm), MEDIUM
(-10dBm), and LOW (-19dBm). Power levels were selected to reduce range approximately 50%
per level drop. The final ranges are fixed at 93m, 44m, and 23m respectively. Therefore, all scripts
used in the simulation center on a circular layout with r = 46.5m, which ensures a node on the
circumference of the test area will have a 1% PER for a node on the opposite side of the area’s
[image:39.612.232.379.539.684.2]circumference.
Figure 4-3: Packet Success Rate per Power Level
The lr-wpan-phy does not model Direct Sequence Spread Spectrum (DSSS) for channel sharing.
The LEACH protocol’s TDMA slots are predicated on the use of DSSS to avoid collisions. In lieu
of DSSS support, the lr-wpan-phy does allow for up to 13 disparate channels via instantiation of
the SpectrumValues class. Therefore, any use of DSSS will be simulated by changing channels
rather than using spread codes.
This change is unfortunate, as this does not provide the fidelity desired. Pickholtz describes the
need for balancing receive power levels when using DSSS [22]. If receive power levels are not
balanced, there is the potential for power loss. LEACH does not provide mechanisms for balancing
transmit power, and thus would suffer from destructive interference. This level of fidelity is
preferred, but not possible within the scope of this project.
4.2 Sensor MAC Module
For this thesis, the lr-wpan module was copied and renamed as the sensor module. The relationship
to the lr-wpan-phy is maintained to avoid rewriting the PHY class. The sensor module begins with
the implementation of the SensorNetDevice. The SensorNetDevice inherits from the NetDevice
class and implements only necessary virtual functions. The NetDevice abstracts the interface to a
network device card, providing a generic interface to layer 3 implementations. The NetDevice
Figure 4-4: NS-3 Sensor Module and Protocol Inheritance
The abstraction of the SensorNetDevice allows for a sensor-specific method and member variables
generic for both sensor protocols implemented. The SensorNetDevice contains the specific
pointers to the SensorMac, LrWpanPhy, Channel, and CSMA/CA object. Once references are
added to the device, associations between the object are made for rapid referencing and
interactions.
The SensorMac is an interface, as it provides virtual functions for implementation by child classes.
The SensorMac base class allows the SensorNetDevice to contain and interface any MAC child
class in a standard manner. The SensorMac provides both a MAC Control Frame transmit queue
and Data transmit queue, and a method to determine if a node is dead.
Virtual functions provide the basic interface for starting a protocol’s FSM, reporting node
expiration, transmit data success, CCA detection results, transceiver state transition requests, and
changing the MAC’s state. It is the responsibility of a protocol to implement the virtual functions
to avoid limiting a protocols functionality; but by implementing said virtual functions, the protocol
4.3 Sensor Helper Class
Like other modules in NS-3, a SensorHelper class is designed to facilitate rapid scripting of large
and complex heterogenous networks. Users may define sensor networks of either LEACH or
BATSEN protocols, the number of nodes in the sensor network, and attach mobility models,
channels, and error models as with most layer 2 classes in NS-3.
The role of the SensorHelper for a SensorMac is extended from the traditional Helper object. The
SensorHelper takes on the role of sourcing traffic as well as aggregating statistical information for
post execution analysis. There are no sensor application modules in NS-3. Therefore, the
SensorHelper provides a ConfigureDataRate method that defines the frequency in which the
[image:42.612.133.482.344.632.2]SensorHelper will schedule events for data delivery to the SensorMac implementations.
Figure 4-5: NS-3 SensorHelper Class
As illustrated in Figure 4-5, the SensorHelper also implements a number of callback functions
status. When the simulation is complete, a script may call the AnalyzeData method, which causes
the SensorHelper to process and write all analyzed data to text files.
4.4 Power Dissipation
The SensorMac class provides a method known as PlmeSetTRXStateConfirm. This method is
configured as a callback from the lr-wpan-phy for every change to the RF hardware’s state. This
method is modified to perform system (individual node) power drainage calculations.
A static method variable is used to store the previous time wherein the method is called. When
called again, the time delta between calls is calculated as the current time minus the previous time.
Note that NS-3 is an event-based simulator, and thus the time values are always correct and are
not skewed by the host system’s real-time clock.
The total node power is stored in a member variable called m_totalSystemPower and is measured
in milli-Watts. The time delta is multiplied by the current operating power level, and the result is
subtracted from the m_totalSystemPower. When the m_totalSystemPower reaches 0mW, the node
is considered dead and will not participate in the network.
This approach to power drainage detection is fairly abstract, but it provides enough resolution to
complete the project. A higher fidelity to power drainage calculation may be needed if DSSS is
5
The LEACH Protocol
An early adapter of CH based communications is the Near Term Digital Radio (NTDR) developed
for the US Army [23] [24]. The NTDR system is a two-tiered hierarchical clustered network
approach to wireless networking. NTDR relies on the use of three frequencies and adaptive
transmit power to affect an efficient multi-hop network over tens of kilometers. In the early stages
of NTDR development, Point-To-Point (PTP) data rates exceeded 500kbps. Later additions to
NTDR supported an efficient Multicast traffic routing solution.
The LEACH protocol was an evolutionary step in energy efficient, multi-hop, data forwarding for
low energy wireless sensor networks [7]. LEACH expands upon the technological advancements
of the NTDR waveform to affect maximal lifetime of the sensor network. The authors define the
features of LEACH as:
• Self-Elected CHs
• Adaptive transmit power • Random rotation of CHs
• In-network processing (compression) of aggregate data • Scheduled sleep cycles
• Reduced frame contention / collision avoidance through Time Division • Reduced diameter of network topology
• Complete distributed control of the network
LEACH operates in a four-phase distributed-state machine: Advertisement, Cluster Set-Up,
Schedule Creation, and Data Transmission. This state machine, as seen in Figure 5-1, repeats
periodically until all sensor nodes run out of power. Each repetition of the state machine is one
round. One cycle of the protocol completes when enough rounds have transpired such that every
Figure 5-1: Original LEACH States
The first phase of the LEACH protocol is CH Advertisement. Every node uses an exponential
equation to determine a threshold for the current round and a Random Number Generator to pick
a value (inclusively) between 0 and 1. If a node picks a number under the threshold, then the node
becomes a CH. Nodes that randomly pick a number greater than the threshold relegate themselves
to member node status.
Once the CHs are established, the non-cluster head nodes must request membership with their
chosen CHs. During advertisement, all non-CH nodes record the Receive Signal Strength
Indicator (RSSI) to determine which CH is closest. The CH producing the highest value, for a
given receiver, is the most desirable CH for that receiver. Therefore, a non-CH node will attempt
to join with the strongest CH to minimize its own transmit power requirements.
Non-CH nodes must transmit their join request using CSMA. Since there is only one frequency
available to the network, the waveform uses spread spectrum transmissions to allow simultaneous
transmissions of various clusters with minimal interference. This requires that each self-elected
CH must advertise its spread code during the Advertisement Phase, and that each CH selects an
Once the CHs have received all requests for membership, the CHs must create a Transmission
Schedule. The schedule implements a temporary Time Division Multiple Access (TDMA) base
Medium Access Channel (MAC). The transmission schedule defines when each member node
can transmit its data to the CH. Consequently, this also allows the members to derive their
transceiver sleep periods, allowing the member nodes to reduce their power expenditure during
the Data Transfer phase.
The final phase of normal operations is the Data Transmission phase. During this phase, member
nodes wake up at their appointed time, transmit their data to their CH, and then return to a RF
sleeping mode. CHs must keep their receivers active throughout the TDMA period, which
accounts for a large portion of their energy drain. Data collected from the members is aggregated,
compressed, and ultimately transmitted to the network sink node.
Once the Data Transmission phase completes, the next round in the waveform begins by restarting
the Advertisement Phase. All CH nodes from preceding rounds, in the current cycle, are no longer
eligible for self-election, thereby reducing the pool of nodes to compete for CH status. After all
nodes have had an opportunity to operate as CHs, the protocol starts a new cycle with the 0th
round.
In order to achieve power savings, the Setup-Phase must be significantly shorter than the
Steady-State Phase. The first three states in the FSM in Figure 5-1 constitute the Setup-Phase. During
these states, all nodes must be awake and exchange information in preparation for the data
exchanges. The last state in the FSM is considered the Steady-State Phase; this is the state wherein
nodes are allowed to sleep to conserve energy.
5.1 Benefits of LEACH
Unlike NTDR, LEACH rotates CH responsibilities periodically. Distributing the CH responsibility
across all nodes equally minimizes the average power expended, and thus extends the life of the
sensor network. According to the results of the original LEACH research paper, the protocol