The Ability to Articulate Strategy as a Predictor of Programming Skill
Simon
University of Newcastle, Australia
Quintin Cutts University of Glasgow, UK
Patricia Haden Otago Polytechnic, NZ
Ken Sutton
Southern Institute of Technology, NZ
Ilona Box
University of Technology Sydney, Australia
John Hamer University of Auckland, NZ
Raymond Lister
University of Technology Sydney, Australia
Denise Tolhurst
University of New South Wales, Australia
Sally Fincher University of Kent, UK
Anthony Robins University of Otago, NZ
Bob Baker
University of New South Wales, Australia
Michael de Raadt
University of Southern Queensland, Australia
Margaret Hamilton RMIT University, Australia
Marian Petre Open University, UK
Jodi Tutty
Charles Darwin University, Darwin, Australia
Abstract
A multi-national, multi-institutional study investigating introductory programming courses drew on student participants from eleven institutions, mainly in Australasia, during the academic year of 2004. A number of diagnostic tasks were used to explore cognitive, behavioural, and attitudinal factors such as spatial visualisation and reasoning, the ability to articulate strategies for commonplace search and design tasks, and attitudes to studying. This paper reports in detail on the task that required participants to articulate a commonplace search strategy. The results indicate that
.
Copyright © 2006, Australian Computer Society, Inc. This paper appeared at the Eighth Australasian Computing Education Conference (ACE2006), Hobart, Tasmania, Australia, January 2006. Conferences in Research and Practice in Information Technology, Vol. 52. Denise Tolhurst and Samuel Mann, Eds. Reproduction for academic, not-for-profit purposes permitted provided this text is included.
increasing measures of richness of articulation of a search strategy are associated with higher marks in the course.
Keywords: programming aptitude, articulation.
1
Introduction
The literature abounds in assertions of the existence of an aptitude for programming, and of attempts to find a suitable predictor for that aptitude so as to avoid wasting time and effort educating students who are unlikely ever to become good programmers (Barker & Unger 1983; Chowdhury, Va n Nelson, Fuelling, & McCormick 1987; Leeper & Silver 1982).
In a multi-national multi-institutional study of students in their first programming course, we compared participants’ ability to articulate a commonplace search strategy with their final mark in the course. This paper reports the results of that comparison.
initial report on the study is published as a technical report (Fincher et al 2005), but the scope of the study is so great that it cannot be fully reported on in one conference paper. The overall project is summarised in a separate paper (Simon et al 2006), and other individual components of the project will be reported on in further papers (to date, deRaadt et al 2005; Tolhurst et al 2006).
While we would really like to find correlations between performance on simple tasks and programming aptitude, we cannot do that because there is no accepted measure of programming aptitude. Therefore we have substituted it with the readily quantified measure of mark in a first programming course, in the hope that this does not unduly compromise our goal.
2
The overall study
The study was based on four different diagnostic tasks and an exit interview in an attempt to determine or eliminate factors that might relate to early programming performance. Eleven institutions in Australia, New Zealand, and Scotland participated, using the same protocol to gather data from 177 students in introductory programming courses taught during 2004. Data was then pooled and analysed. The four focal tasks were:
• a standard paper-folding test, a cognitive task focusing on spatial visualisation and reasoning;
• map sketching, a behavioural task used to assess the ability to design and sketch a simple map, and to articulate decisions based on that map;
• searching a phone book, a behavioural task used to assess the ability to articulate a search strategy;
• a standard study process questionnaire, an attitudinal task focusing on approaches to learning and studying.
3
The search articulation task
Researchers followed a fixed protocol in individual sessions with participants. Audio recordings were made of the sessions and transcribed for subsequent analysis. The protocol was strongly constrained so as to ensure uniformity among researchers at the different institutions. For the search articulation task, researchers were instructed as follows.
• Pass the subject the local phone book. Search One:
• Direct the subject: ‘I would like you to look for <insert name> in the phone book’ (Assure them that this is not a trick question, and that the name really does appear in it.) Provide the name – as it appears in the phone book – on a piece of paper.
• When they have found the name, ask them: ‘Could you please describe to me what you just did to find that entry?’ If they find it difficult to articulate, you may use the following probes: 1. ‘How did you open the book? ’
2. ‘How did you find the page?’
3. ‘How did you find the name on the page?’
You may follow each of the above probes with a single additional request to add further detail, if you consider it to be necessary. You may not probe further than the single additional request. At that point, use the subject’s response verbatim.
• Note the subject’s ability to articulate (good/average/poor).
• Note whether their articulation correctly reflects their actions or is wrong. If wrong, note how it is wrong.
• If the subject has not already done so, ask them to close the book.
Search Two:
• Direct the subject: ‘Could you now look for <name with surname beginning Mc>, and as you do this task, please describe exactly what you are doing and how you get to the entry’. Again, provide the name – as it appears in the phone book – on a piece of paper.
• Note the subject’s ability to articulate (good/average/poor).
• During this (second) search, you should use no probes, and make no requests for further detail. Use the subject’s responses verbatim.
• Note whether their articulation correctly reflects their actions or is wrong. If wrong, note how it is wrong.
Alternatives:
• When they’ve finished, ask them once: ‘Can you describe any other ways in which you could have searched for that name, in this book? They need not be ways that you would use yourself.’ Do not probe for further detail, but you may ask ‘Are there any other ways?’ until the subject is certain that they are finished.
4
Background and motivation for the tas k
Anecdotal evidence suggested that programmers might be better at describing search processes than non-programmers. If this were true, it would imply that the metacognitive ability to describe strategy might be relevant to programming skill. In order to explore this possibility the phone book task was chosen as a representative example of a commonplace search activity. This task is drawn from classroom practice, stemming in turn from a tradition in computer education of using commonplace examples to convey programming concepts and make them relevant to students (eg Curzon 2000).
(In the event, even this attempt to find a suitable commonplace task was foiled by a number of the participants, who indicated that they had never before used a telephone book to look up a number.)
were more likely than novices to incorporate programming constructs in their descriptions, and that they were more likely to use terms referring to the phone book as opposed to its contents. To the extent that the task of writing instructions can be compared with that of articulating one’s own actions in speech, our study can be seen as following this same line of investigation.
In designing this task we sought to explore two aspects of the ability to articulate strategies: accuracy (how well a given description matched the researcher’s observation of how the participant undertook the task) and richness.
We hypothesised that those participants who naturally articulated their strategy were demonstrating the ability to situate their actions in a preconceived algorithm or plan, and that this ability might constitute a useful predictor of success in learning to program. Combined with the results of Onorato and Schvaneveldt (1987), an interesting developmental picture could be developed. Onorato and Schvaneveldt found that experienced programmers are more likely than novices to incorporate programming terms in their descriptions of a phone book search:
‘For example, the exp erienced programmers were more likely to make use of loops and to consider more alternatives en route to their solution goal. Hence, they have an edge in both conciseness and preciseness. Unfortunately, however, this experiment could not determine if this edge was a direct result of programming experience or if, in contrast, programmers were equipped with such abilities to begin with.’ (Onorato & Schvaneveldt 1987 p 369).
Our analysis of novices during the very early stages of their first programming course directly addresses the question posed by Onorato and Schvaneveldt: do those who go on to become successful programmers have pre-existing abilities or tendencies to des cribe processes in a strategic or algorithmic manner?
5
Analysis
5.1
Articulations
Each participant completed and described two searches of the phone book (see the protocol in Section 3 ). Their first description, which we call Articulation 1, was made after completing the first search; their second description, which we call Articulation 2, was made while they were conducting the second search.
For each articulation, researchers were asked to note ‘the subject’s ability to articulate (good/average/poor)’, which we shall call richness, and ‘whether their articulation correctly reflects their actions or is wrong’, which we shall call accuracy.
In the event, the accuracy ratings collected during the task sessions were later perceived by the researchers as being unreliable. For example, an articulation as simple as ‘I just opened the book and found the name’, while not at all rich, is completely accurate; but we suspect that some
researchers might have recorded its accuracy as Poor. Hence we have chosen to ignore the question of accuracy and to concentrate on attempts to capture the richness of the articulation. These include a count of the number of alternative search strategies elicited from each participant at the end of the task; an assessment of the richness of the participant’s articulations made by individual researchers during the task; and a similar but more focused assessment of all transcribed articulations made collectively by three of the researchers.
This collective assessment of the transcripts was an attempt to capture a measure of richness specifically based on the degree to which the participant articulated the search strategy. The focus was determined after much discussion of the transcripts, and an initial attempt at analysis based on distinctions similar to those drawn by Onorato and Schvaneveldt (1987), who compared the use of terms relating to the contents of the phone book and terms relating to the book itself. It was apparent from the transcripts that, as expected, almost all participants described factors relating to surface content such as specific names and letters, and many referred to aspects of the book such as page numbers, columns and so on. While the interview protocol did not explicitly ask for a strategy or algorithm, we found however that many participants had also described (to varying extents) factors relating to the strategy of their search, for example noting intentions, giving reasons for particular actions, or describing conditional or repeated aspects of the process.
5.2
Number of alternative strategies
After completing the search articulations, participants were asked to describe any alternative strategies they could think of for conducting such searches. From the interview transcripts we extracted the number of distinct alternatives proposed by each participant. We did not count methods that used external resources (such as using the internet or asking a friend to help), or the suggestion to ‘look in the index if there is one’. Most other suggestions were accepted as valid, and distinct strategies were counted individually even if they fall within the same broad approach (for example, a linear search forward from the start of the directory and a linear search backward from the end). We examined the relationship between the number of alternatives articulated and the participants’ results in their courses.
5.3
Interviewe r richness rating
5.4
Collective richness rating
In discussing the potential difficulties of the interviewer rating measure it was decided that a collective analysis should be attempted by a rating team of three researchers . As discussed above, the focus of this analysis was the distinction between the articulation of a search, which can be purely descriptive (based on the surface features of the book’s contents such as such as specific names and letters), and the articulation of a search strategy, which gives some impression of applying a particular plan or an algorithm.
Transcripts were assessed by the rating team using the same agreed criteria. Raters looked for evidence of strategic elements such as:
• statements of reasons (why a task is performed in addition to whatit does);
• statements of intentions;
• descriptions of tests or conditionals assessed during the process;
• descriptions or hints of repeated tasks;
• particularly detailed descriptions of aspects of the process.
These general criteria were made more specific by looking for particular linguistic markers such as:
• those relating to reasons: because, so, assuming;
• those relating to intentions: have to, need to, want
to, trying to, look for, find out, make sure;
• those relating to general search: find, found, refined, narrowed, checking, until, repeat, test, backtrack, again, continued, before, after, forward, back, too
far, closer.
Transcripts were available for 96 interviews from 9 institutions. As each interview contains articulations for two searches, a total of 192 articulations had been transcribed. Using the criteria outlined above, the rating team individually scored each articulation as Poor, Average, or Good. Each researcher scored articulations independently in batches of about 10. At the end of each batch, scores were discussed and a collective score agreed upon; thus each articulation received an agreed collective score. Agreement between the individual scores of the three researchers was high, and consensus was reached in all cases. Typical examples of Poor, Average and Good articulations, all from Articulation 2, are shown below.
Typical poor articulation: Open the book. Like, M. C,
D, E, M. I want M-C. A, B, C. M-A, M -C, looking over the page. M -B. Go back. M-E, M-A, A, B, C. D. M, A, C. M-C. M-C-L-A. Ok, M-C-L-A. And M&M. There.
Typical average articulation: I’m going to go to [city
name] again as it is more likely it is going to be in there. I’m going through the alphabet backwards as I started with R towards M. I’ve got to M but I’m still too far through the alphabet. I’ve found Mc, found McL so am going to go back further, I’ve found McD, McDo. I’m still too far, I’m going back further, I found McDonald, I
still at McDonald M, so go back further, McDonald G, McDonald [first name].
Typical good articulation: Now, I know from previous
experience that telephone directories are difficult with Mc names, because sometimes they’re Mac, sometimes they’re Mc, and often they’re listed in not alphabetically strictly speaking. So, I’ll start off my searching finding Ms and I’ll just go just take it at face value, so then I’ll look to see Mc, L. Looking at the name on the top of the page, trying to find Mc, Mc will be before that, seems to be jumping from Ma to Me quite quickly, which leads me to believe that it is probably not listed under Mc, no it doesn’t look as if it is, so maybe it’s listed under Mac so I’ll just flip back to Mac ... yes, start looking for the 3rd letter, so I’m looking for Mac, and it is listing the Mc’s there too, so I know I’m looking in the right place, so I’m looking for Mc-L or Mac-L, ..., Ls ... with a La ... there’s a [first name], ok so that’s not the correct spelling of McLaughlin ... and there it is.
6
Results
6.1
Overview
We found a number of significant and marginally significant effects, but nothing that would constitute the philosopher’s stone of success prediction. Note that all results described in this section consider only students who completed the programming course – students who failed to complete are excluded from the analysis . Including these latter students strengthens the significance of all the results somewhat, but failure to complete cannot be seen as a statistically valid measure of programming ability.
Although there were 177 participants in the study, not all data was collected for all participants, so the numbers will vary from one section of the results to the next .
6.2
Number of alternative strategies
For 111 participants we had a record of the number of alternative search strategies proposed, which ranged from 0 to 4. The analysis shows no significant results. While the trend is in the expected direction, with participants who articulated more strategies having higher mean marks, neither ANOVA (F3,107 = 2.030; p = .114) nor correlation (r = .176; p = .065) is significant.
Descriptive statistics
Group Mean Std Dev Std Err N
0 55.048 25.146 4.445 32
1 67.968 24.785 4.131 36
2 66.233 22.389 4.021 31
3 68.175 21.653 6.251 12
Analysis of Variance for Y=Mark
Source Type III SS Df Mean Sq F Prob
Model 3489.213 3 1163.071 2.030 0.114 Error 61297.358 107 572.873
0 10 20 30 40 50 60 70 80
0 1 2 3
Number of alternatives
[image:5.596.303.538.57.284.2]Mean mark
Figure 1: Number of alternati ves vs mean mark
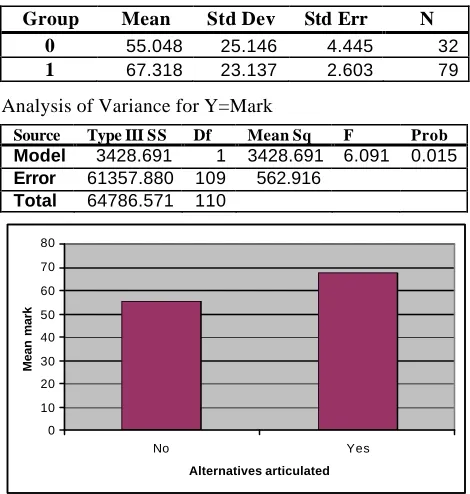
At a coarser grain of analysis , participants can be divided into just two groups, those who gave alternatives and those who did not. At this level there is a clear effect. Participants who gave no alternatives had lower marks, on average, than those who were able to generate at least one alternative strategy (F1,109 = 6.091; p = .015).
Descriptive statistics
Group Mean Std Dev Std Err N
0 55.048 25.146 4.445 32
1 67.318 23.137 2.603 79
Analysis of Variance for Y=Mark
Source Type III SS Df Mean Sq F Prob
Model 3428.691 1 3428.691 6.091 0.015
Error 61357.880 109 562.916
Total 64786.571 110
0 10 20 30 40 50 60 70 80
No Yes
Alternatives articulated
[image:5.596.60.300.58.195.2]Mean mark
Figure 2: Articulation of alternatives vs mean mark
6.3
Interviewer rating
Here we consider the interviewer ratings for Articulation 1 and Articulation 2, which we had for 134 participants .
6.3.1
Main effect of Articulation 1 group on
mark
For the first articulation the trend is in the expected direction: participants rated Poor and Average in general have lower marks than those rated Good. However, the effect is not significant (F2,131 = 2.185; p = .117).
Descriptive statistics
Group Mean Std Dev Std Err N Poor 59.896 21.428 2.972 52
Average 61.570 25.259 3.994 40
Good 69.555 23.460 3.620 42
Analysis of Variance for Y=Mark
Source Type III SS Df Mean Sq F Prob
Model 2363.555 2 1181.777 2.185 0.117
Error 70864.738 131 540.952
Total 73228.292 133
54 56 58 60 62 64 66 68 70 72
Poor Average Good
Interviewer rating, articulation 1
[image:5.596.57.292.309.556.2]Mean mark
Figure 3: Interviewer rating of Articulation 1 vs mean mark
6.3.2
Main effect of Articulation 2 group on
mark
The same analysis for the second articulation is shown below. Again, subjects whose articulation was rated Good had higher mean marks than those rated Poor or Average, but the effect is not significant (F2, 131 = 2.148; p = .121).
Descriptive statistics
Group Mean Std Dev Std Err N Poor 58.453 20.837 3.337 39
Average 63.083 23.143 2.963 61
Good 69.735 25.977 4.455 34
Analysis of Variance for Y=Mark
Source Type III SS Df Mean Sq F Prob
Model 2325.303 2 1162.652 2.148 0.121
Error 70902.989 131 541.244
Total 73228.292 133
52 54 56 58 60 62 64 66 68 70 72
Poor Average Good
Interviewer rating, articulation 2
Mean mark
Figure 4: Interviewer rating of Articulation 2 vs mean mark
[image:5.596.305.538.431.685.2]mean marks; in the later there appears to be a linear trend from Poor, through Average, to Good. There is also a large change in the distribution of the ratings themselves, as shown in Table 1.
Group N for articulation 1 N for articulation 2
Poor 52 39
Average 40 61
Good 42 34
Table 1: Change in the distribution of ratings
Many more participants were rated as Poor for Articulation 1 than for Articulation 2. Many fewer participants were rated as Average for Articulation 1 than for Articulation 2. Presumably participants moving into the Average group for Articulation 2 raised the mean mark of that group. For example , 14 participants from the high-rating Good group for Articulation 1 moved into the Average group for Articulation 2.
The complete summary of participants in different rating combinations is shown in Table 2. The group name indicates the participants’ scores for Articulations 1 and 2. For example, participants in the ‘Good Average’ group were rated Good on Articulation 1 and Average on Articulation 2.
Group Mean Std Dev N
Poor Poor 58.978 17.703 26
Poor Average 57.870 25.712 22
Poor Good 70.750 16.820 4
Average Poor 52.689 28.676 9
Average Average 64.624 23.767 25
Average Good 62.167 27.578 6
Good Poor 61.750 21.577 4
Good Average 68.522 16.697 14
Good Good 71.458 27.345 24
Table 2: Summary of participants in different rating combinations
From Table 2 we can see that the majority of participants (75 of 134, 56% ) received the same rating on both tasks. A smaller group of participants (N = 51, 38%) moved one level between tasks, and these were divided approximately evenly between participants who performed better on Articulation 1 and those who performed better on Articulation 2 (N = 23 and 28 respectively). Very few participants moved the two levels from Poor to Good (N = 4, 3%) or from Good to Poor (N = 4, 3%). Thus we see that performance is reasonably consistent on the two articulation tasks. While there is no main effect of the above grouping (F = .995; p = .443), there is a perplexing anomaly in the performance of the 4 participants who rated Poor when articulating after the task (Articulation 1) and Good when articulating during the task (Articulation 2). These four participants had a mean mark of 70.75, well above the overall mean for participants rated Poor on Articulation 1 (59.89). While no conclusions can be drawn from such a small sample, it would be interesting to explore further the reasons that strong students might articulate a strategy poorly after executing it but well while executing it.
6.4
Collective rating
Here we consider the collective ratings of search strategy for Articulation 1 and Articulation 2, as described in Section 5.4. We were able to generate these ratings for 96 participants.
6.4.1
Main effect of Articulation 1 group on
mark
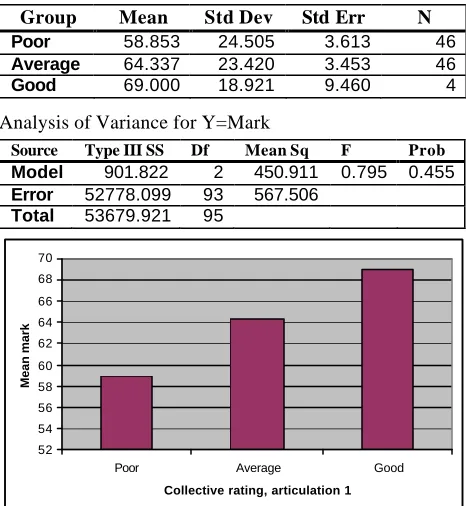
The observed trend in this analysis is identical to that in the previous ones: participants who are better at articulating their strategies in the phone book task tend to earn higher marks. Although the main effect is not statistically significant (F2,93 = .795; p = .445), the extremely low N in the Good group severely limits the power of the analysis.
Descriptive statistics
Group Mean Std Dev Std Err N Poor 58.853 24.505 3.613 46
Average 64.337 23.420 3.453 46
Good 69.000 18.921 9.460 4
Analysis of Variance for Y=Mark
Source Type III SS Df Mean Sq F Prob
Model 901.822 2 450.911 0.795 0.455
Error 52778.099 93 567.506
Total 53679.921 95
52 54 56 58 60 62 64 66 68 70
Poor Average Good
Collective rating, articulation 1
[image:6.596.305.538.273.526.2]Mean mark
Figure 5: Collective rating of Articulation 1 vs mean mark
6.4.2
Main effect of Articulation 2 group on
mark
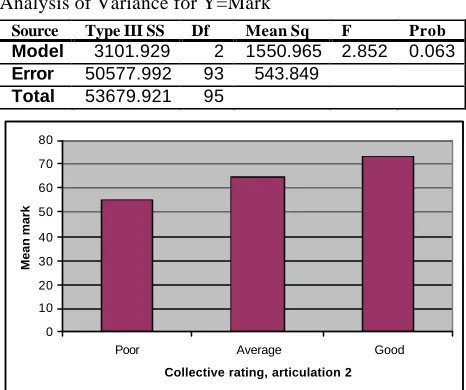
Once again we see the trend of increasing mean mark with increasing articulation performance, but in this case the effect is marginally significant (F2,93 = 2.852; p = .063).
Descriptive statistics
Group Mean Std Dev Std Err N Poor 55.174 26.598 4.433 36
Average 64.817 21.993 3.050 52
Analysis of Variance for Y=Mark
Source Type III SS Df Mean Sq F Prob
Model 3101.929 2 1550.965 2.852 0.063
Error 50577.992 93 543.849
Total 53679.921 95
0 10 20 30 40 50 60 70 80
Poor Average Good
Collective rating, articulation 2
[image:7.596.58.291.68.263.2]Mean mark
Figure 6: Collective rating of Articulation 2 vs mean mark
These results show a repeat of the migration towards Average from Articulation 1 to Articulation 2. The appearance of this pattern in both rating metrics (interviewer rating and collective rating) supports the validity and reliability of these scores as measures of the quality of the subject’s articulation. The phenomenon is also of interest in its own right. It cannot be a simple practice effect, nor can it indicate that the second articulation task is simply easier, as approximately equal numbers of participants moved up to Average from Poor as moved down to Average from Good (see discussion in Section 6.3.2). Rather, performance on the Articulation 2 task seems subject to less extreme variation than performance on the Articulation 1 task. If we wish to use tasks such as these to explore the determinants of programming ability, we must be careful to have a clear understanding of their inherent biases.
7
Discussion
In our analysis of the richness of the phone book search task articulations, the observed trends are all in the expected direction. All measures show that increasing richness is associated with increasing mean marks. The measures are not all statistically significant, although most become so if students who failed to complete the course are included in the analyses (these students come exclusively or predominantly from the ‘weaker’ groups). Although individual measures are weak, taken together they appear to be forming a reliable picture.
In summary, this study provides some initial evidence that the question raised by Onorato and Schvaneveldt (1987) (see Section 4) can be answered affirmatively: students who carry on to be successful programmers have pre-existing strengths in a strategic / algorithmic style of articulation. Some issues remain to be explored in future work, however, such as the variation in performance over the different measures used in this study, the patterns of change in ratings for the same participant over different tasks, and particularly the variations in ratings between describing a search in retrospect (Articulation 1) and
while actually performing the search (Articulation 2). It would also be useful to explore the extent to which the richness of articulation is independent of, or perhaps simply a reflection of, general or verbal IQ measures.
8
Acknowledgments
This study was supported by an ACM Special Interest Group in Computer Science Education (SIGCSE) Special Projects Grant and by a grant from Computing Research and Education Association of Australasia (CORE).
Thanks to Caroline Wills for assistance with workshop organisation and transcription; to Diane Hagan, CSSE, Monash University, for her insight and assistance in conducting the study with Monash students while a participating researcher was on a Visiting Scholar Grant; to Warren Hill of Charles Darwin University, Charles Thevathayan of RMIT University, and Dongmo Zhang of University of Western Sydney for facilitating access to participants; to Susan Snowdon for her contribution to the literature search; to Anthony Robins and Raymond Lister for exemplary workshop organization and support; and to Box Catering Inc for phenomenal food.
9
References
Barker, R., & Unger, E., (1983). A predictor for success in an introductory programming class based upon abstract reasoning development. ACM SIGCSE Bulletin
15(1):154-158.
Chowdhury, A., Van Nelson, C., Fuelling, C.P., & McCormick, R.L. (1987). Predicting success of a beginning computer course using logistic regression (Abstract only). Proc 15th ACM Annual Computer
Science Conference, St Louis, MO, USA, 449.
Curzon, P. (2000). Learning Computer Science through Games and Puzzles. Interfaces 42:14-15. http://www.bcs-hci.org.uk/interfaces/interfaces42.pdf. Accessed 3 Oct 2005.
de Raadt, M., Hamilton, M., Lister, R., Tutty, J., Baker, B., Box, I., Cutts, Q., Fincher, S., Hamer, J., Haden, P., Petre, M., Robins, A., Simon, Sutton, K., Tolhurst, D. Approaches to learning in computer programming students and their effect on success. In Brew, A., & Asmar, C. (2005). Higher Education in a changing world: Research and Development in Higher
Education, 28:407-414.
Fincher, S., Baker, B., Box, I., Cutts, Q., de Raadt, M., Haden, P., Hamer, J., Hamilton, M., Lister, R., Petre, M., Robins, A., Simon, Sutton, K., Tolhurst, D., Tutty, J. Programmed to succeed?: a national, multi-institutional study of introductory programming courses (2005). Computing Laboratory Technical
Report 1-05, University of Kent, Canterbury, UK.
Leeper, R.R., & Silver, J.L. (1982). Predicting success in a first programming course. ACM SIGCSE Bulletin
14(1):147-150.
procedures to people and computers. The Journal of
Systems and Software 7(4):357-369.
Simon, Fincher, S., Robins, A., Baker, B., Box, I., Cutts, Q., de Raadt, M., Haden, P., Hamer, J., Hamilton, M., Lister, R., Petre, M., Sutton, K., Tolhurst, D., Tutty, J. (2006). Predictors of success in a first programming course. Proc Eighth Australasian Computing
Education Conference, Hobart, Australia, Jan 2006.
Tolhurst, D., Baker, B., Hamer, J., Box, I., Cutts, Q., de Raadt, M., Fincher, S., Haden, P., Hamilton, M., Lister, R., Petre, M., Robins, A., Simon, Sutton, K., Tutty, J. (2006). Do map-drawing styles of novice programmers predict success in programming? A multi-national, multi-institutional study. Proc Eighth Australasian
Computing Education Conference, Hobart, Australia,