Title:
A Comparison of Learning Preferences and Perceptions of High School Students for Statistics
Authors:
MEHRYAR NOORIAFSHAR TEK NARAYAN MARASENI
Department and Affiliation:
Dr MEHRYAR NOORIAFSHAR, Senior Lecturer in Operations Management TEK NARAYAN MARASENI, PhD candidate in Environmental and natural resources economics
Mailing address:
Dr MEHRYAR NOORIAFSHAR Faculty of Business
University of Southern Queensland, Toowoomba, 4350,
AUSTRALIA
E-mails:
MEHRYAR NOORIAFSHAR [email protected]
A Comparison of Learning Preferences and Perceptions of High
School Students for Statistics
MEHRYAR NOORIAFSHAR [email protected]
TEK NARAYAN MARASENI [email protected]
University of Southern Queensland, Toowoomba, Australia
Abstract
This paper is based on analysis and comparison of data collected from high schools in two different parts of the world. The first sample (Group 1) was selected from the year 12 students in the Darling Downs region of Queensland in Australia and the second sample (Group 2) was selected from year 12 students in Tehran, Iran. Although both groups of students possess similar characteristics in terms of topic and level, they have been exposed to different teaching methods. For instance, students from Tehran would have learned mathematics and statistics in a very traditional manner. That is mainly chalk and talk. However, the Australian students have been exposed to more flexible methods. Culturally driven factors such as parental encouragement or even pressure in some cases would also play a role in shaping and influencing students’ attitudes and aspirations. For instance, mathematics, in general, is regarded by the majority of the Iranian parents as a topic which will help their children with their future studies and profession. Hence, traditionally, in a society like Iran, school students would be encouraged to excel in learning mathematics and related topics by both parents and teachers. The Australian students, on the other hand, would have a wider exposure in terms of accepted topics. This is due to the fact that many other fields would also receive similar amount of respect. The findings however, appear to be very similar in terms of both groups of students’ learning styles and methods preferences. It is interesting to note that both groups have indicated their preference for more visually oriented teaching materials in Statistics.
Key words: Statistics Education, Learning Style, Preference
Introduction
As suggested by Kettenring (1997) in a presentation entitled "Shaping Statistics for Success in the 21st Century" to the American Statistical Association back in 1997, image reconstruction of the field of statistics must be placed right at the top of the list.
The main purpose of this research project is to identify and use students’ preferences for developing more effective and attractive teaching materials on statistics and related fields. Two groups of students from two different parts of the world were selected. The first group (133 students) was chosen from High Schools in the Darling Downs region of Queensland in Australia. The second group (17
students) was selected from a High School in Tehran, Iran. Both samples were chosen randomly from year-12 students. It should be noted that due to difficulties in data collection, the sample size for the second group is smaller than the first one.
The objectives of this paper are to compare and contrast the two groups in terms of:
• their learning style (modal) preferences; and • their preferred method of learning.
For an introduction to modal preferences refer to Fleming (1995).
In order to achieve these objectives, a questionnaire was developed and used as the data collection instrument. The process of completing the questionnaires was
administered and supervised by the Mathematics Coordinator and/or the Principal of the respective schools. This questionnaire contained questions on the following categories:
• students’ background;
• students’ learning preferences; and • students’ future goals and aspirations.
Analysis of Students’ Perceptions and Characteristics
The following sections provide analysis and discussion on a number of key questions presented to the students:
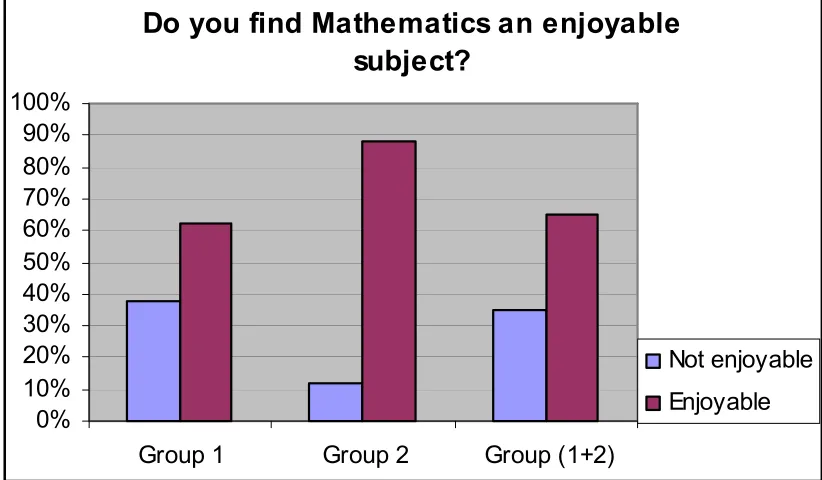
Enjoy learning Mathematics - Over 65 percent of the total students regard mathematics as an enjoyable subject. Only around 35 percent of the total students claim that mathematics is not an enjoyable subject. See Figure 1 for details.
Do you find Mathematics an enjoyable
subject?
0% 10% 20% 30% 40% 50% 60% 70% 80% 90% 100%
Group 1 Group 2 Group (1+2)
[image:4.595.93.504.79.319.2]Not enjoyable Enjoyable
Figure 1 – Comparison of two groups of students in terms of enjoying Mathematics
Family background - Around 48 percent of the total students have indicated that they have a member with a strong mathematical background in their families. See Figure 2. Although a larger proportion of the students from Tehran have someone with a mathematical knowledge and background, the Chi-squire test is not significant even with 76 percent confidence level (reasonably large error margin of 0.242). This outcome suggests that there is no statistically significant difference between two groups of students in terms of mathematical background of their families.
Does any member of your family have a
strong Mathematical background?
42% 44% 46% 48% 50% 52% 54%
Group 1 Group 2 Group (1+2)
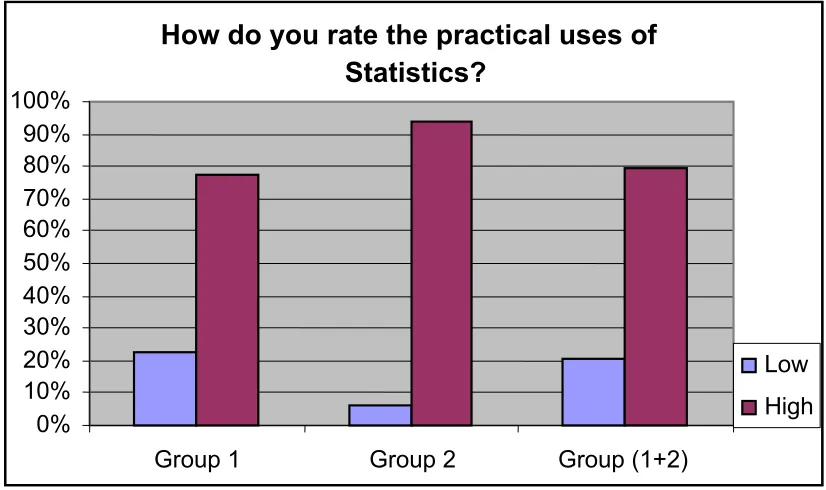
[image:4.595.94.506.454.697.2]Practical uses - About 80 percent of the students (both groups) believe that the practical use of statistics is ‘high’. The percentage of students in this category is higher for the Tehran group (94.1%) than the Australian group (76.5%). The Chi-square test has shown that there is a significant difference between the two groups of students in terms of their perception of practical uses of statistics. Hence, most students from Tehran believe that the chances of having practical applications for Statistics for them are high (see figure 3). It should be noted that the test was significant at 98 percent confidence level (P value of 0.012).
How do you rate the practical uses of
Statistics?
0% 10% 20% 30% 40% 50% 60% 70% 80% 90% 100%
Group 1 Group 2 Group (1+2)
[image:5.595.107.520.187.432.2]Low High
Figure 3 – Comparison of the perceptions of two groups of students with regard to practical uses of Statistics
Do you think your future profession will be related to
the field of Statistics?
0% 20% 40% 60% 80% 100%
Group 1 Group 2 Group (1+2)
[image:6.595.95.502.78.327.2]No/not sure Yes
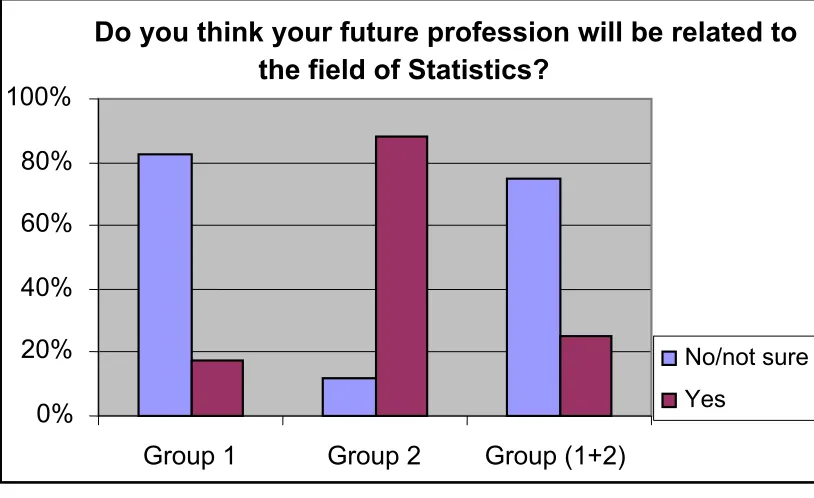
Figure 4 – Comparison of the perceptions of two groups of students with regard to their future profession
Objectives
(1) Preferred learning style
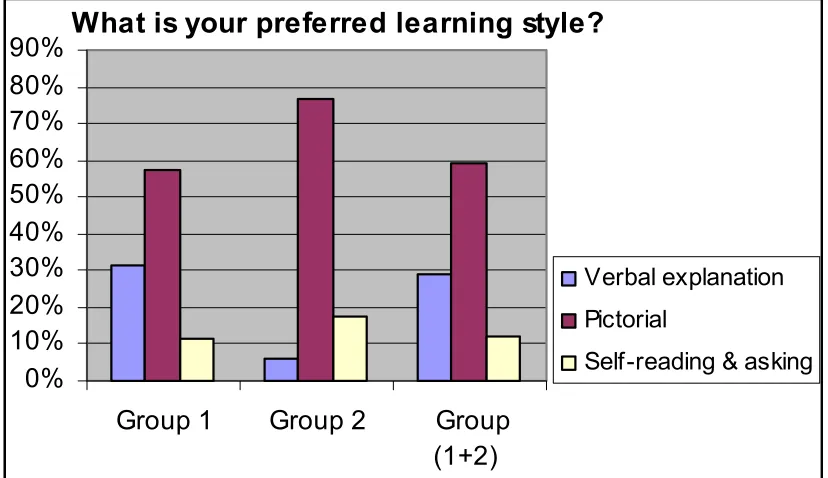
It is notable that the learning style preferences of both groups of students are similar. Very low percentage (12 percent) of the total students prefers ‘self reading and then asking questions’ approach. Both groups prefer the learning style which uses graphs, pictures, images etc. In total, around 59 percent of students have a preference for visual learning (Table 1 and Figure 5). The proportion of students who prefer this style is higher in Iran (76.5%) is higher than that in Australia (57.1%). The Chi-Square test however, suggests that there is no significant difference in learning style preferences of two groups at 95 percent confidence level. This demonstrates that regardless of country or cultural background, students have a preference for visual features in learning. Similar conclusion was drawn by Nooriafshar et al. (2004).
Table 1: Comparison of learning modal preferences of two groups of student Group 1 Group 2 Group (1+2)
Verbal explanation 31.6% 5.9% 28.7%
Using graphs, pictures, images 57.1% 76.5% 59.3% Learning
modal
[image:6.595.87.513.599.661.2]What is your preferred learning style?
0% 10% 20% 30% 40% 50% 60% 70% 80% 90%
Group 1 Group 2 Group (1+2)
Verbal explanation Pictorial
[image:7.595.93.507.78.317.2]Self-reading & asking
Figure 5 - Comparison of learning style preferences of two groups of students
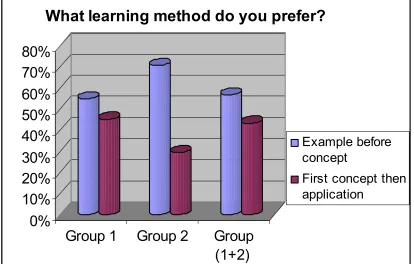
(2) Preferred learning method
Significant number (around 57 %) of the total students preferred practical examples before learning the concept, however, the proportion of students who preferred this learning method is higher in Iran (around 71%) than in Australia (around 55%). Only about 29 percent of the Iranian students and 45 percent of the Australian students prefer learning the concept first and then finding out about the application. (Table 2 and Figure 6). Although the preference for learning methods between the two groups of students seem slightly different the Chi-Square test shows that there is no statistically significant difference between them at 80 percent confidence level (P value is 0.219).
The test outcome demonstrates that the country and cultural differences do not play a significant role in students’ preferences for learning methods. This finding has important implication in teaching practices. For instance, as a productive and effective teaching approach, we may consider presenting problems first for the brain storming purposes, and then solution for the concept development.
Table 2: Comparison of preferred learning methods of two groups of student Group 1 Group 2 Group (1+2) Practical examples before
learning the concept 54.9% 70.6% 56.7%
Preferred learning
method First concept and then
[image:7.595.90.515.624.696.2]0%
10%
20%
30%
40%
50%
60%
70%
80%
Group 1
Group 2
Group
(1+2)
What learning method do you prefer?
Example before concept
[image:8.595.93.507.100.364.2]First concept then application
Figure 6- Comparison of preferred learning methods of two groups of students
Conclusions
It is noteworthy to mention that the majority of the students from Tehran feel that they will have something to do with Statistics in the future. In contrast, most of the students from the Darling Downs (Australia) do not think that they will use Statistics in the future.
Similarly, both groups of students prefer ‘problem’ first for brain storming and then ‘concept development’ for problem solving. This method makes students more creative, analytical and also helps them to maintain long lasting memory. The most important conclusion of this research is that regardless of the geographical location and cultural background, students’ preferences in terms of ‘learning method’ and ‘style’ are similar. This conclusion has significant implications for the course designers, teachers, and all stakeholders regardless of their status or location.
References
Chanter D.O.,(n.d.), Some Anecdotes and Analogies for Illustrating Statistical Ideas, Retrieved July 2 2004 from
http://science.ntu.ac.uk/rsscse/ts/bts/chanter/text.html.
Fleming, N.D; (1995), 'I'm different; not dumb. Modes of presentation (VARK) in the tertiary classroom, in Zelmer,A., (ed.) Research and Development in Higher Education', Proceedings of the 1995 Annual Conference of the HigherEducation and Research Development Society of AustralasiaHERDSA),HERDSA, Volume 18, pp. 308 – 313.
Friedman, H., Halpern, N.and Salb, D. (1999), 'Teaching Statistics Using Humorous Anecdotes', Mathematics Teacher, Vol. 92, Issue 4, p305, 4p.
Kettenring, J. (1997), 'Shaping statistics for success in the 21st century', Journal of the American Statistical Association, Vol. 92, Issue 440, p1229, 6p.
Nooriafshar, M. (2001), 'Teaching Non-Parametric Statistics to Students from a Non- Mathematical Background', International Journal for Mathematics Teaching and Learning, September Issue.