DEVELOPMENT OF VALIDATED ANALYTICAL METHODS
FOR SELECTED CARDIOVASCULAR DRUGS IN
FORMULATIONS AND ITS APPLICATION IN IN-VITRO
INTERACTION STUDIES
Dissertation submitted to
THE TAMIL NADU DR. M. G. R. MEDICAL UNIVERSITY,
CHENNAI
For the award of Degree of
DOCTOR OF PHILOSOPHY
In
PHARMACY
Submitted by
V. Shivashankar M.Pharm.,
Under the Guidance of
Dr. T.K. Ravi M.Pharm., PhD., FAGE
DECEMBER 2015
COLLEGE OF PHARMACY
S.No Title Page No LIST OF ABBREVIATIONS
LIST OF TABLES LIST OF FIGURES
1 INTRODUCTION 1
2 AIM AND OBJECTIVES 5
3 LITERATURE REVIEW 6
4 SCOPE AND PLAN OF WORK 10
5 MATERIALS AND INSTRUMENTS 12
6 EXPERIMENTAL METHODS
6.1.1 Development of validated UV spectrophotometric method for the determination of dronedarone hydrochloride in tablet dosage form
17
6.1.2 Development of validated spectrofluorimetric method for the determination of dronedarone hydrochloride in tablet dosage form
19
6.1.3 Development of validated HPTLC method for the determination of dronedarone hydrochloride in tablet dosage form
22
6.1.4 Development of validated stability indicating RP-HPLC method for the determination of dronedarone hydrochloride in tablet dosage form
25
6.2.1 Development of validated UV spectrophotometric method for the determination of levosimendan in injection
32
6.2.2 Development of validated spectrofluorimetric method for the determination of levosimendan in injections
34
6.2.3 Development of validated HPTLC method for the determination of levosimendan in injection
37
6.2.4 Development of validated stability indicating RP-HPLC method for the determination of levosimendan in injection dosage form
40
6.3.1 Development of validated UV spectrophotometric method for the determination of rivaroxaban in tablet dosage form
46
6.3.2 Development of validated spectrofluorimetric method for the determination of rivaroxaban in tablet dosage form
48
6.3.3 Development of validated stability indicating HPTLC method for the determination of rivaroxaban in tablet dosage form
51
6.3.4 Development of validated RP-HPLC method for the determination of rivaroxaban in tablet dosage form
55
6.4.1 Development of validated UV spectrophotometric method for the determination of ticagrelor in tablet dosage form
60
6.4.2 Development of validated HPTLC method for the determination of ticagrelor in tablet dosage form
6.4.3 Development of validated stability indicating RP-HPLC method for the determination of ticagrelor in tablet dosage form
65
7 RESULTS & ANALYSIS
7.1.1 Development of validated UV spectrophotometric method for the determination of dronedarone hydrochloride in tablet dosage form
69
7.1.2 Development of validated spectrofluorimetric method for the determination of dronedarone hydrochloride in tablet dosage form
76
7.1.3 Development of validated HPTLC method for the determination of dronedarone hydrochloride in tablet dosage form
81
7.1.4 Development of validated stability indicating RP-HPLC method for the determination of dronedarone hydrochloride in tablet dosage form
87
7.2.1 Development of validated UV spectrophotometric method for the determination of levosimendan in injection
106
7.2.2 Development of validated spectrofluorimetric method for the determination of levosimendan in injections
112
7.2.3 Development of validated HPTLC method for the determination of levosimendan in injection
117
7.2.4 Development of validated stability indicating RP-HPLC method for the determination of levosimendan in injection dosage form
122
7.3.1 Development of validated UV spectrophotometric method for the determination of rivaroxaban in tablet dosage form
139
7.3.2 Development of validated spectrofluorimetric method for the determination of rivaroxaban in tablet dosage form
146
7.3.3 Development of validated stability indicating HPTLC method for the determination of rivaroxaban in tablet dosage form
150
7.3.4 Development of validated RP-HPLC method for the determination of rivaroxaban in tablet dosage form
158
7.4.1 Development of validated UV spectrophotometric method for the determination of ticagrelor in tablet dosage form
168
7.4.2 Development of validated HPTLC method for the determination of ticagrelor in tablet dosage form
174
7.4.3 Development of validated stability indicating RP-HPLC method for the determination of ticagrelor in tablet dosage form
179
8 DISCUSSION
8.1.1 Development of validated UV spectrophotometric method for the determination of dronedarone hydrochloride in tablet
8.1.2 Development of validated spectrofluorimetric method for the determination of dronedarone hydrochloride in tablet dosage form
195
8.1.3 Development of validated HPTLC method for the determination of dronedarone hydrochloride in tablet dosage form
196
8.1.4 Development of validated stability indicating RP-HPLC method for the determination of dronedarone hydrochloride in tablet dosage form
197
8.2.1 Development of validated UV spectrophotometric method for the determination of levosimendan in injection
201
8.2.2 Development of validated spectrofluorimetric method for the determination of levosimendan in injections
201
8.2.3 Development of validated HPTLC method for the determination of levosimendan in injection
203
8.2.4 Development of validated stability indicating RP-HPLC method for the determination of levosimendan in injection dosage form
204
8.3.1 Development of validated UV spectrophotometric method for the determination of rivaroxaban in tablet dosage form
208
8.3.2 Development of validated spectrofluorimetric method for the determination of rivaroxaban in tablet dosage form
209
8.3.3 Development of validated stability indicating HPTLC method for the determination of rivaroxaban in tablet dosage form
210
8.3.4 Development of validated RP-HPLC method for the determination of rivaroxaban in tablet dosage form
212
8.4.1 Development of validated UV spectrophotometric method for the determination of ticagrelor in tablet dosage form
214
8.4.2 Development of validated HPTLC method for the determination of ticagrelor in tablet dosage form
215
8.4.3 Development of validated stability indicating RP-HPLC method for the determination of ticagrelor in tablet dosage form
216
9 SUMMARY & CONCLUSION
9.1 Development of validated analytical methods for the determination of dronedarone hydrochloride
218
9.2 Development of validated analytical methods for the determination of ticagrelor
223
9.3 Development of validated analytical methods for the determination of rivaroxaban
227
9.4 Development of validated analytical methods for the determination of ticagrelor
231
LIST OF ABBREVIATIONS
ACN - Acetonitrile
ANOVA - Analysis of Variance
BSA - Bovoine Serum Albumin
CAS - Cerric Ammonium Sulphate
CHF - Congestive Heart Failure
CVD - Cardiovascular Diseases
DDI - Drug-Drug Interactions
DMSO - Dimethyl Sulphoxide
gm - Gram
HPLC - High Performance Liquid Chromatography
HPTLC - High Performance Thin Layer Chromatography
H2O2 - Hydrogen peroxide
hrs - Hours
ICH - International Conference on Harmonization
KH2PO4 - Potassium dihydrogen orthophosphate
LOD - Limit of detection
LOQ - Limit of quantification
M - Molar
mg - Milligram
min - Minute
ml - Millilitre
mM - Millimolar
NaOH - Sodium Hydroxide
NaCl - Sodium Chloride
ng - Nanogram
nm - Nanometer
OPA - Ortho Phosphoric Acid
PDA - Photo Diode Array
Rf - Retardation factor
RSD - Relative standard deviation
Rt - Retention time
SD - Standard Deviation
TEA - Triethylamine
TFA - Trifluro acetic acid
Tf - Tailing factor
λmax - Wavelength of maximum absorbance
μg - Microgram
μL - Microlitre
LIST OF TABLES
Table No. Title
Development of validated UV spectrophotometric method for the determination of dronedarone hydrochloride in tablet dosage form
1 Calibration data for dronedarone hydrochloride by second derivative UV spectrophotometric method
2 Recovery data of dronedarone hydrochloride
3 Precision data of dronedarone hydrochloride
4 Stability data of Dronedarone Hydrochloride (bench top)
5 Stability data of Dronedarone Hydrochloride (refrigerated)
6 Optical characteristics of dronedarone hydrochloride
7 Assay of dronedarone hydrochloride tablets
Development of validated spectrofluorimetric method for the determination of dronedarone hydrochloride in tablet dosage form
8 Calibration data for dronedarone hydrochloride by spectrofluorimetric method
9 Recovery data of dronedarone hydrochloride
10 Precision data of dronedarone hydrochloride
11 Stability data of dronedarone hydrochloride (bench top
12 Stability data of dronedarone hydrochloride (refrigerated)
13 Assay of dronedarone hydrochloride tablets by spectrofluorimetry
Development and validation of HPTLC method for
determination of dronedarone hydrochloride in tablet dosage form
14 Linearity data for dronedarone hydrochloride by HPTLC method
15 Recovery data of dronedarone hydrochloride
16 Repeatability data of sample application of dronedarone hydrochloride
17 Repeatability data of sample measurement data of dronedarone hydrochloride
18 Precision data of dronedarone hydrochloride
19 Stability data of dronedarone hydrochloride (bench top)
20 Stability data of dronedarone hydrochloride (refrigerated)
Table No. Title
Development and validation of stability indicating RP-HPLC method for determination of dronedarone hydrochloride in tablet dosage form
22 Linearity data for dronedarone hydrochloride
23 Recovery data of dronedarone hydrochloride
24 Repeatability data of dronedarone hydrochloride
25 Precision data of dronedarone hydrochloride
26 Stability data of dronedarone hydrochloride (bench top)
27 Stability data of dronedarone hydrochloride (refrigerated)
28 System suitability parameters of dronedarone hydrochloride
29 Assay results of dronedarone hydrochloride tablets by HPLC
30 Forced degradation results of dronedarone hydrochloride
31 Results of protein binding study of dronedarone hydrochloride
32 Results of in-vitro interaction study of dronedarone hydrochloride with aspirin
33 Results of in-vitro interaction study of dronedarone hydrochloride with atorvastatin
Development of validated UV spectrophotometric method for the determination of levosimendan in injection form
34 Calibration data for levosimendan by UV spectrophotometric method
35 Recovery data of levosimendan by UV method
36 Precision data of levosimendan
37 Stability data of levosimendan (bench top stored stock)
38 Stability data of levosimendan (refrigerated stock)
39 Optical characteristics of levosimendan
40 Assay results of levosimendan injection
Development of validated spectrofluorimetric method for the determination of levosimendan injections
41 Calibration data for levosimendan by spectrofluorimetric method
42 Recovery data of levosimendan
43 Precision data of levosimendan
44 Stability data of levosimendan (bench top)
Table No. Title
46 Assay results of levosimendan injection by spectrofluorimetry
Development and validation of HPTLC method for
determination of levosimendan in injections
47 Linearity data for levosimendan by HPTLC method
48 Recovery data of levosimendan
49 Repeatability data of sample application of levosimendan
50 Repeatability data of sample measurement of levosimendan
51 Precision data of levosimendan
52 Stability data of Levosimendan (bench top)
53 Stability data of Levosimendan (Refrigerated)
54 Assay results of levosimendan injections by HPTLC method
Development and validation of stability indicating RP-HPLC method for determination of levosimendan in injection form
55 Linearity data for levosimendan
56 Recovery data of levosimendan
57 Repeatability data of levosimendan
58 Precision data of levosimendan
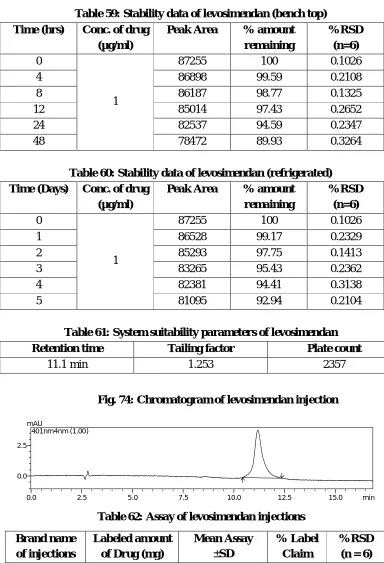
59 Stability data of levosimendan (bench top)
60 Stability data of levosimendan (refrigerated)
61 System suitability parameters of levosimendan
62 Assay of levosimendan injections
63 Forced degradation results of levosimendan
64 Protein binding of levosimendan
65 Displacement of levosimendan from protein by aspirin
66 Displacement of levosimendan from protein by clopidogrel
67 Displacement of levosimendan from protein by atorvastatin
Development of validated UV spectrophotometric method for the determination of rivaroxaban in tablet dosage form
68 Calibration data of rivaroxaban
69 Recovery data of rivaroxaban
Table No. Title
71 Stability data of rivaroxaban (bench top)
72 Stability data of rivaroxaban (refrigerated)
73 Optical characteristics of rivaroxaban
74 Assay of rivaroxaban tablets by UV method
Development of validated spectrofluorimetric method for the determination of rivaroxaban in tablet dosage form
75 Calibration data for rivaroxaban by spectrofluorimetric method
76 Recovery data of rivaroxaban
77 Precision data of rivaroxaban
78 Stability data of rivaroxaban (bench top)
79 Stability data of rivaroxaban (refrigerated)
80 Assay of rivaroxaban Tablets
Development and validation of stability indicating HPTLC method for determination of rivaroxaban in tablet dosage form
81 Linearity data for rivaroxaban
82 Recovery data of rivaroxaban by HPTLC method
83 Repeatability of sample application
84 Repeatability of sample measurement
85 Precision data of rivaroxaban
86 Stability data of rivaroxaban (bench top)
87 Stability data of rivaroxaban (refrigerated)
88 Assay of rivaroxaban tablets by HPTLC method
89 Forced degradation results of rivaroxaban
Development and validation of RP-HPLC method for determination of rivaroxaban in tablet dosage form
90 Linearity data for rivaroxaban
91 Recovery data of rivaroxaban
92 Repeatability data of rivaroxaban
93 Precision data of rivaroxaban
94 Stability data of rivaroxaban (bench top)
95 Stability data of rivaroxaban (refrigerated)
Table No. Title
97 Assay of rivaroxaban tablets
98 Protein binding of rivaroxaban
99 Displacement of rivaroxaban from protein by aspirin
100 Displacement of rivaroxaban from protein by clopidogrel
Development of validated UV spectrophotometric method for the determination of ticagrelor in tablet dosage form
101 Calibration data of ticagrelor
102 Recovery data of ticagrelor
103 Precision data of ticagrelor
104 Stability data of ticagrelor (bench top)
105 Stability data of ticagrelor (refrigerated)
106 Optical characteristics of ticagrelor
107 Assay of ticagrelor tablets
Development and validation of HPTLC method for
determination of ticagrelor in tablet dosage form
108 Linearity data for ticagrelor
109 Recovery data of ticagrelor
110 Repeatability of sample application
111 Repeatability of sample measurement
112 Precision data of ticagrelor
113 Stability data of ticagrelor (bench top)
114 Stability data of ticagrelor (refrigerated)
115 Assay of ticagrelor tablets by HPTLC
Development and validation of stability indicating RP-HPLC method for determination of ticagrelor in tablet dosage form
116 Linearity data for ticagrelor
117 Recovery data of ticagrelor
118 Repeatability data of ticagrelor
119 Precision data of ticagrelor
120 Stability data of ticagrelor (bench top)
Table No. Title
123 Assay of ticagrelor tablets by HPLC
124 Forced degradation results of ticagrelor
125 Comparison of developed analytical methods for the determination of dronedarone hydrochloride
126 Statistical comparison of the percentage assay of dronedarone hydrochloride tablets determined by developed analytical methods 127 Comparison of UV spectroscopic method developed with reported
methods of determination of dronedarone hydrochloride
128 Comparison of HPTLC method developed with reported methods of determination of dronedarone hydrochloride
129 Comparison of HPLC method developed with reported methods of determination of dronedarone hydrochloride
130 Statistical comparison of the percentage protein binding of dronedarone hydrochloride in presence of interacting drugs
131 Comparison of developed analytical methods for the determination of levosimendan
132 Statistical comparison of the percentage assay of levosimendan injections determined by developed analytical methods
133 Statistical comparison of the percentage protein binding of levosimendan in presence of interacting drugs
134 Comparison of developed analytical methods for the determination of rivaroxaban
135 Statistical comparison of the percentage assay of rivaroxaban tablets determined by developed analytical methods
136 Comparison of UV spectroscopic method developed with reported methods of determination of rivaroxaban
137 Comparison of HPTLC method developed with reported methods of determination of rivaroxaban
138 Comparison of HPLC method developed with reported methods of determination of rivaroxaban
139 Statistical comparison of the percentage protein binding of rivaroxaban in presence of interacting drugs
140 Comparison of developed analytical methods for the determination of ticagrelor
141 Statistical comparison of the percentage assay of ticagrelor tablets determined by developed analytical methods
142 Comparison of UV spectroscopic method developed with reported methods of determination of ticagrelor
LIST OF FIGURES
Figure No. Title
Development of validated UV spectrophotometric method for the determination of dronedarone hydrochloride in tablet dosage form
1 Zero order spectrum of dronedarone hydrochloride
2 First order derivative spectrum of dronedarone hydrochloride
3 Second order derivative spectra of dronedarone hydrochloride
4 Second order derivative overlay spectra of dronedarone hydrochloride
5 Calibration graph of dronedarone hydrochloride
6 Second order derivative of dronedarone hydrochloride tablets
Development of validated spectrofluorimetric method for the determination of dronedarone hydrochloride in tablet dosage form
7 Excitation spectra of Cerrium (III) (formed after oxidation of dronedarone hydrochloride)
8 Emission spectra of Cerrium (III) (formed after oxidation of dronedarone hydrochloride)
9 Overlay emission spectra of Cerrium (III) (formed after oxidation of dronedarone hydrochloride)
10 Linearity graph of dronedarone hydrochloride
11 Emission spectra of Cerrium (III) (formed after oxidation of dronedarone hydrochloride tablets)
Development and validation of HPTLC method for
determination of dronedarone hydrochloride in tablet dosage form
12-16 Chromatograms of Standards of Dronedarone Hydrochloride obtained by HPTLC method
17 Linearity graph of dronedarone hydrochloride
18 Chromatogram of dronedarone hydrochloride in tablets
Development and validation of stability indicating RP-HPLC method for determination of dronedarone hydrochloride in tablet dosage form
19 Standard chromatogram of dronedarone hydrochloride
20 Linearity graph of dronedarone hydrochloride
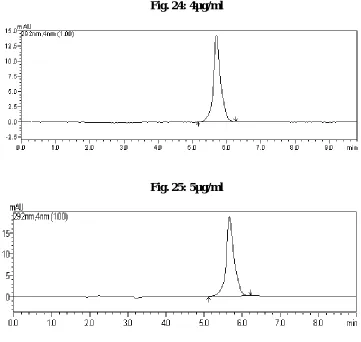
21-25 Chromatograms of standards of Dronedarone Hydrochloride
Figure No. Title
27 UV-spectrum of dronedarone hydrochloride
28 Chromatogram of dronedarone hydrochloride at 0 hrs of acid hydrolysis
29 Spectrum of dronedarone hydrochloride peak after acid hydrolysis at 0 time
30 Chromatogram of dronedarone hydrochloride after 2 hrs of acid hydrolysis
31 Spectrum of dronedarone hydrochloride peak after acid hydrolysis at 2 hrs
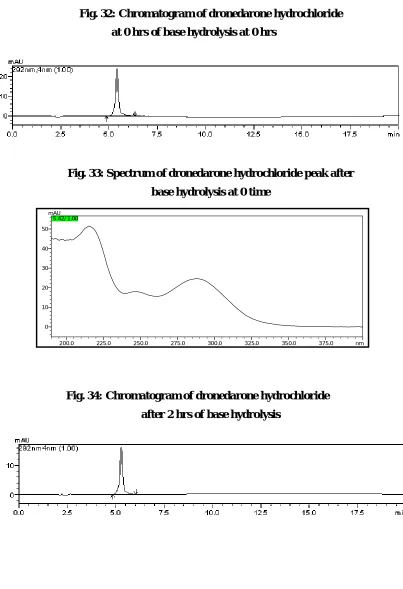
32 Chromatogram of dronedarone hydrochloride at 0 hrs of base hydrolysis at 0 hrs
33 Spectrum of dronedarone hydrochloride peak after base hydrolysis at 0 time
34 Chromatogram of dronedarone hydrochloride after 2 hrs of base hydrolysis
35 Spectrum of dronedarone hydrochloride peak after base hydrolysis at 2 hrs
36 Chromatogram of dronedarone hydrochloride at 0 hrs of neutral hydrolysis
37 Spectrum of dronedarone hydrochloride peak after neutral hydrolysis at 0 time
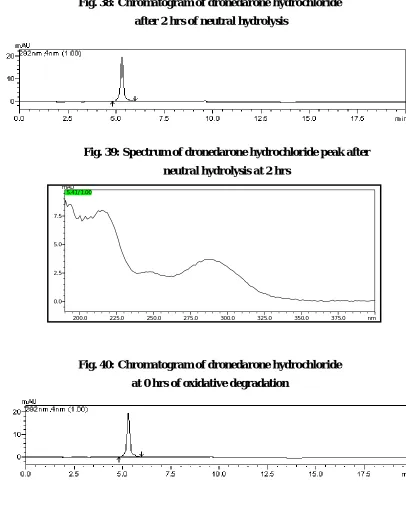
38 Chromatogram of dronedarone hydrochloride after 2 hrs of neutral hydrolysis
39 Spectrum of dronedarone hydrochloride peak after neutral hydrolysis at 2 hrs
40 Chromatogram of dronedarone hydrochloride at 0 hrs of oxidative degradation
41 Spectrum of dronedarone hydrochloride peak after oxidative degradation at 0 time
42 Chromatogram of dronedarone hydrochloride after 2 hrs of oxidative degradation
43 Spectrum of dronedarone hydrochloride peak after oxidative degradation at 2 hrs
44 Chromatogram of dronedarone hydrochloride after 6 hrs of photolytic degradation
45 Spectrum of dronedarone hydrochloride peak after photolytic degradation at 6 hrs
46 Chromatogram of simultaneous elution dronedarone hydrochloride with aspirin
Figure No. Title
48 Chromatogram of unbound dronedarone hydrochloride after in-vitro displacement interaction with aspirin
49 Chromatogram of unbound dronedarone hydrochloride after in-vitro displacement interaction with atorvastatin
Development of validated UV spectrophotometric method for the determination of levosimendan in injection form
50 Standard UV spectrum of levosimendan
51 Overlay UV spectrum of levosimendan standards (1 µg/ml -5 µg/ml)
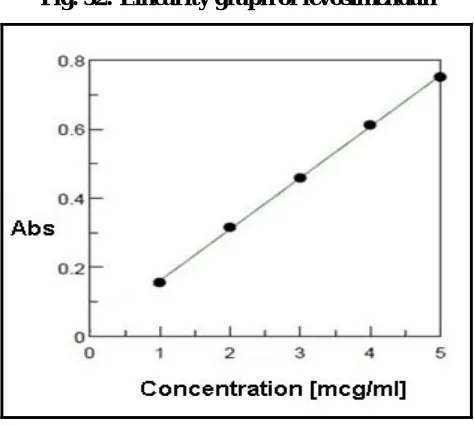
52 Linearity graph of levosimendan
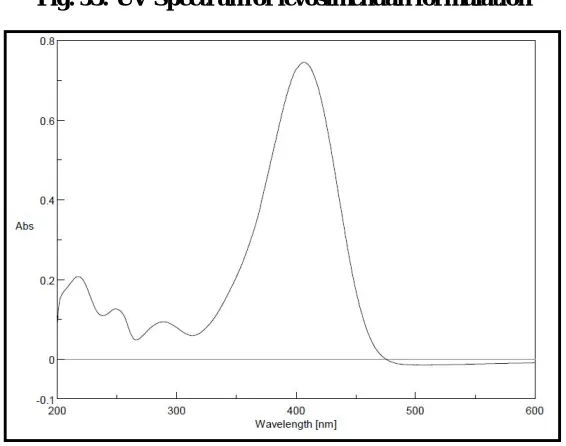
53 UV Spectrum of levosimendan formulation
Development of validated spectrofluorimetric method for the determination of levosimendan injections
54 Excitation spectra of cerium (III) (formed after oxidation of levosimendan)
55 Emission spectra of cerium (III) (formed after oxidation of levosimendan)
56 Overlay emission spectra of cerium (III) (formed after oxidation of levosimendan)
57 Linearity graph of levosimendan
58 Emission spectra of cerium (III) (formed after oxidation of levosimendan injection)
Development and validation of HPTLC method for
determination of levosimendan in injections
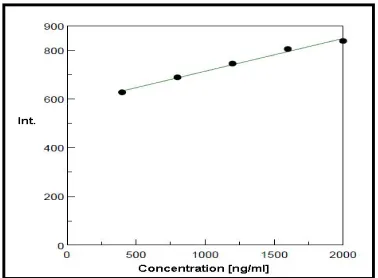
59 Linearity graph of levosimendan
60-64 Chromatograms of standards of levosimendan obtained by HPTLC
65 Chromatogram of levosimendan injection
Development and validation of stability indicating RP-HPLC method for determination of levosimendan in injection form
66 Standard chromatogram of levosimendan by HPLC method
67 Linearity graph of levosimendan
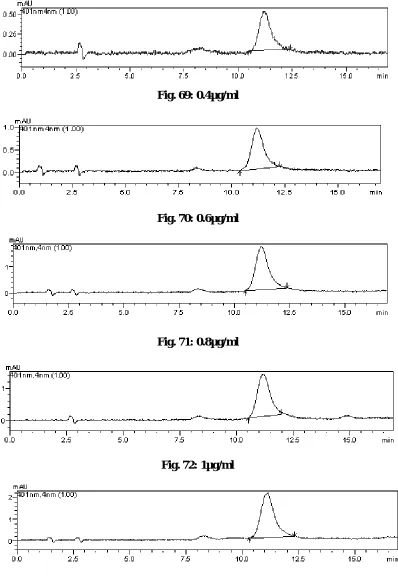
68-73 Chromatograms of standards of levosimendan obtained by HPLC method
74 Chromatogram of levosimendan injection
Figure No. Title
76 Chromatogram of levosimendan at 0 hrs of acid hydrolysis
77 Spectrum of levosimendan peak at 0 time of acid hydrolysis
78 Chromatogram of levosimendan after 2 hrs of acid hydrolysis
79 Spectrum of levosimendan peak 2 hrs of acid hydrolysis
80 Chromatogram of levosimendan at 0 hrs of base hydrolysis
81 Spectrum of levosimendan peak at 0 time of base hydrolysis
82 Chromatogram of levosimendan after 2 hrs of base hydrolysis
83 Spectrum of levosimendan peak after 2 hrs of base hydrolysis
84 Chromatogram of levosimendan at 0 hrs of neural hydrolysis
85 Spectrum of levosimendan peak at 0 time of neutral hydrolysis
86 Chromatogram of levosimendan after 2hrs of neutral hydrolysis
87 Spectrum of levosimendan peak after 2 hrs of neutral hydrolysis
88 Neutral hydrolysis - spectrum of degradant peak at 4.8min
89 Neutral hydrolysis - spectrum of degradant peak at 8.6min
90 Chromatogram of levosimendan at 0 hrs of oxidative degradation
91 Spectrum of levosimendan peak at 0 time of oxidative degradation
92 Chromatogram of levosimendan after 2 hrs of oxidative degradation
93 Oxidative stress- spectrum of degradant peak at 4.8 min
94 Chromatogram of levosimendan after 4 hrs of photolytic degradation
95 Spectrum of levosimendan peak after 4 hrs Photolytic stress
96 Chromatogram of simultaneous elution of levosimendan with aspirin
97 Chromatogram of simultaneous elution of levosimendan with clopidogrel
98 Chromatogram of simultaneous elution of levosimendan with atorvastatin
99 Chromatogram of unbound levosimendan after equilibrium dialysis with protein
100 Chromatogram of levosimendan unbound levosimendan after interaction with aspirin
101 Chromatogram of levosimendan unbound levosimendan after interaction with clopidogrel
Figure No. Title
Development of validated UV spectrophotometric method for the determination of rivaroxaban in tablet dosage form
103 UV-spectrum of Rivaroxaban standard
104 Overlay spectrum of rivaroxaban standards (5-25 µg/ml)
105 Calibration graph of rivaroxaban
106 Spectrum of rivaroxaban tablets
Development of validated spectrofluorimetric method for the determination of rivaroxaban in tablet dosage form
107 Excitation spectra of cerium (III) (formed after oxidation of rivaroxaban)
108 Emission spectra of cerium (III) (formed after oxidation of rivaroxaban)
109 Overlay emission spectra of cerium (III) (formed after oxidation of rivaroxaban)
110 Linearity graph of rivaroxaban
111 Emission spectra of cerium (III) (formed after oxidation of rivaroxaban tablets)
Development and validation of stability indicating HPTLC method for determination of rivaroxaban in tablet dosage form
112-116 Chromatograms of Standards of rivaroxaban
117 Linearity graph of rivaroxaban by HPTLC
118 Chromatogram of rivaroxaban tablets
119 Chromatogram of acid hydrolyzed rivaroxaban at 0 hr
120 Chromatogram of acid hydrolyzed rivaroxaban after 2 hrs
121 Chromatogram of base hydrolyzed rivaroxabanat 0 hr
122 Chromatogram of base hydrolyzed rivaroxabanafter 2 hrs
123 Chromatogram of neutral hydrolyzed rivaroxabanat 0 hr
124 Chromatogram of neutral hydrolyzed rivaroxabanafter 2 hrs
125 Chromatogram of oxidative stressed rivaroxaban at 0 hr
126 Chromatogram of oxidative stressed rivaroxaban after 2 hrs
127 Chromatogram of rivaroxaban after 6 hrs of photolytic degradation
Development and validation of RP-HPLC method for determination of rivaroxaban in tablet dosage form
128 Standard chromatogram of rivaroxaban
Figure No. Title
130-134 Chromatograms of Standards of rivaroxaban
135 Chromatogram of rivaroxaban formulation
136 Chromatogram of simultaneous elution rivaroxaban with aspirin
137 Chromatogram of simultaneous elution rivaroxaban with clopidogrel
138 Chromatogram of unbound rivaroxaban after equilibrium dialysis
139 Chromatogram of unbound rivaroxaban after in-vitro interaction with aspirin
140 Chromatogram of unbound rivaroxaban after in-vitro interaction with
Development of validated UV spectrophotometric method for the determination of ticagrelor in tablet dosage form
141 UV-spectrum of standard ticagrelor
142 Overlay spectrum of ticagrelor standards (0.2-1.0 µg/ml)
143 Calibration graph of ticagrelor
144 UV- spectrum of ticagrelor tablets
Development and validation of HPTLC method for
determination of ticagrelor in tablet dosage form
145-149 Chromatograms of Standards of ticagrelor
150 Linearity graph of ticagrelor
151 Chromatogram of ticagrelor tablets
Development and validation of stability indicating RP-HPLC method for determination of ticagrelor in tablet dosage form
152 Standard chromatogram of ticagrelor
153 Linearity graph of ticagrelor
154-159 Chromatograms of Standards of ticagrelor
160 HPLC Chromatogram of ticagrelor tablets
161 UV spectrum of ticagrelor
162 Chromatogram of ticagrelor at 0 hrs of acid hydrolysis
163 Spectrum of ticagrelorpeak at 0 time of acid hydrolysis
164 Chromatogram of ticagrelor after 2 hrs of acid hydrolysis
165 Spectrum of ticagrelorpeak after 2 hrs of acid hydrolysis
Figure No. Title
167 Chromatogram of ticagrelor at 0 hrs of base hydrolysis
168 Spectrum of ticagrelor peak at 0 time of base hydrolysis
169 Chromatogram of ticagrelor after 2 hrs of base hydrolysis
170 Spectrum of ticagrelor peak after 2 hrs of base hydrolysis
171 Chromatogram of ticagrelor at 0 hrs of neutral hydrolysis
172 Spectrum of ticagrelor peak at 0 time of neutral hydrolysis
173 Chromatogram of ticagrelor after 2 hrs of neutral hydrolysis
174 Spectrum of ticagrelorpeak after 2 hrs of neutral hydrolysis
175 Chromatogram of ticagrelor at 0 hrs of oxidative degradation
176 Spectrum of ticagrelor peak at 0 time of oxidative degradation
177 Chromatogram of ticagrelorafter 2 hrs of oxidative degradation
178 Spectrum of ticagrelorpeak after 2 hrs of oxidative degradation
179 Photolytic degradation after 4 hrs
1. INTRODUCTION
Drugs are the natural or synthetic chemical compounds which are indented
for pharmacotherapy, diagnosis or prevention of diseases. New drugs are
approved every year and are often used concomitantly with other drugs.
Pharmacotherapy is a complex process, thus appropriate selection of drug is more
challenging. Concomitant use of drugs may result in mild, moderate or severe
drug-drug interactions (DDI).Globally DDI’s have received greater attention from
various statutory bodies1. The new interactions between medications are
increasingly reported. The incidence of DDI-related adverse drug reactions was
found to be 6.5% and most of the events presented important clinical
consequences2. DDIs may results in emergency admission, increased financial
burden to patient and even results in death3. Clinically significant interaction
sometimes causes serious adverse reactions therefore a systematic knowledge of
drug interaction may help to prevent adverse effects4.
DDI’s might result termination of drug development, disapproval for
marketing and withdrwal of drugs from market. Therefore drug interactions
should be considered from the perspective of both investigational drug and
approved drugs which are expected to be used concomitantly with other drugs.
Prospective studies are needed to determine result of major drug interactions5.
Pharmacokinetics drug interactions occur when one drug alters the concentration
of another drug by altering absorption, distribution, bioavailability, metabolism
and excretion.
Distribution interactions involve interactions in protein binding of drugs.
Two major factors affecting protein binding include the presence of other drugs
and the effects of disease. Drug displacement may be clinically significant in case
of potent drugs. Displacement interactions may require icresed dose of a drug or
decreased dose depending on the pharmacokinetics of drug. Knowledge of altered
In order to predict clinically significant drug interaction that is suspected
to be resulted from protein binding displacement, it is important to validate the
findings using specific in-vitro protein binding studies6. In-vitro DDI studies requires specific analytical techniques with great sensitivities for accurate
estimation of drugs. So it is essential to establish the validated methods for the assessment of in-vitro drug interaction studies.
The analytical technique frequently employed for the estimation of drugs,
and drug combinations is high performance liquid chromatography (HPLC). The
HPLC method offer a multitude of advantages and it is suitable method for
quantitative analysis. The excellent sensitivity makes HPLC suitable for
estimation of drugs in biological fluids7. Advantages of using HPLC include
speed, automation and compatibility8. Thus HPLC method can be effectively
employed in the in-vitro interaction studies.
High Performance Thin Layer Chromatography (HPTLC) is well
established method due to its reliability and accuracy. The advantage of this
method is ability to run multiple samples at same time. It is economical due to
small quantity of mobile phase utilization9.
UV spectroscopy is routinely used analytical method. It is very simple and
does not involve laborious procedures10. Due to the simplicity, accuracy and
reliability UV- spectroscopic method is very useful in quantification of drug and
formulations. Derivative spectrophotometry offers enhanced resolution and bandwidth discrimination by converting normal spectra into first and second order
derivative spectrum.
Spectrofluorimetry method is commonly utilized in quantitative analysis of
drugs and metabolites due to its relatively low cost and greater sensitivity. This
method can be inherently applicable to lower concentration ranges11. The non
fluorogenic compounds can also be estimated by this method by either converting
Validation ensures quality and reliability of analytical techniques. It is a
process that demonstrate the established techniques are suitable and proved to be
exactly correlating with appropriate standards which is directed for their intended
use. It is necessary to validate the analytical method(s) as per ICH guidelines and
to provide proper and appropriate validation information12. The importance of validation is producing reliable, repeatable and accurate results for routine
analysis. The validation of analytical methods builds high degree of confidence
and reliability on developed method.
Development of stability indicating analytical method measure active
ingredients, that is clearly free from process impurities and degradation
products13. The current guidelines and regulatory requirements mandates
development of analytical methods which posses greater selectivity, sensitivity,
accurate, precise and robust14. Force degradation is essential for development of
stability indicating analytical method. Force degradation studies helps to
determine the degradation pathway and degradation products of the APIs that is probably obtained during storage and facilitate formulation development,
manufacturing and packaging15.
The incidence of cardiovascular diseases (CVDs) has increased and
globally it is one of the leading causes of death. The cardiovascular drugs are the
most widely prescribed drugs and it ranks second in the overall sales of drug in
India16. Cardiovascular drugs are one of the drug categories frequently involved in
drug related problems. Patients taking CVD drugs are more prone to potential
DDI and the factors related to DDI include age, polypharmacy and changes in
pharmacokinetics of drugs. Most of the elderly population is taking cardiovascular
medications and the vulnerability of this population to DDI’s is enormous17. The
potential DDI might results due to the narrow therapeutics index of drugs and
The DDI potential varies with patient ability to metabolize and excerete
the drug. The DDI potential also depends on duration of concomitant
administration of drugs18. It is essential to determine protein binding in order to
minimize the interaction of coadministered drugs. In order to determine
2. AIM AND OBJECTIVES
The current study aims on development of validated analytical methods for the selected cardiovascular drugs and its formulation. The cardiovascular drugs selected presently are dronedarone hydrochloride, rivaroxaban, levosimendan and
ticagrelor. These drugs are approved by CDSCO for the different indications to treat of cardiovascular diseases.
The objective of the study was development of simple and sensitive methods for determination of selected cardiovascular drugs in its formulations and application of most sensitive method for in-viro interaction studies. The specific objectives of the study are:
To develop UV spectrophotometric methods for the determination of dronedarone hydrochloride, rivaroxaban, levosimendan and ticagrelor.
To develop new spectroflurimetric methods for the estimation of
dronedarone hydrochloride, rivaroxaban and levosimendan.
To develop RP-HPLC and HPTLC methods for the determination of
dronedarone hydrochloride, rivaroxaban, levosimendan and ticagrelor. To apply validated analytical methods for the estimation of selected drugs
in formulations.
To establish the inherent stability characteristics of the selected drugs and
formulations through stress studies as per ICH recommendations.
3. LITERATURE REVIEW
3.1. Dronedarone Hydrochloride
Mrinalini C. D., et al (2015)19 has reported a validated stability indicating
UV spectrometric method and HPTLC method for determination of dronedarone
hydrochloride. Methanol was used as solvent and absorption maximum was observed at 288nm. The linear range of dronedarone was reported in range of 10-50µg/ml in UV method and 40-200 ng/band by HPTLC. The study compared the results of UV method and HPTLC method and concluded that UV method is more
sensitive.
Pravalika K., et al (2013)20 conducted a study on spectrophotometric
estimation of dronedarone hydrochloride in formulation. Dronedarone shows maximum wavelength at 288 nm using methanol as a solvent. The linearity was
reported in range of 10-35µg/ml.
A study on spectrophotometric estimation of dronedarone was carried out
by Arpan Patel., et al (2012)21. The analytical wavelength of 290 nm was applied
for the estimation of dronedarone. The linear range of 2-30 µg/ml was reported.
Rajyalakshmi C., et al (2013)22 carried out degradation study of
dronedarone by HPLC-UV method. A C18 column was used with mobile phase of ACN and phosphate buffer. The reported LOD was 0.018 µg/ml and LOQ was 0.06 µg/ml with a linearity range of 10-50 µg/ml.
A HPLC method for quantification of dronedarone was demostrated by
Emanual M. P., et al (2013)23. The reported method has linearity in the range of
5-15µg/ml of dronedarone and retention time of 4.7min.
Kishore K., et al (2014)24 performed a study for determination of
dronedarone by RP-HPLC technique. The λmax of the dronedarone was found to be 290 nm. The mobile phase of ACN: water was used in 70:30 ratio. The linearity of dronedarone was observed between 5-35µg/ml.
column. The ACN and buffer mixture were used as a mobile phase. Linear response was reported between 25-100 µg/ml.
Arpan P., et al (2012)26 has reported a HPLC method for determination of
dronedarone hydrochloride. The Hypersil C18 column with mobile phase comprised of buffer: ACN was used. The reported linearity range was 10-150 µg/ml.
A study on HPTLC method for estimation of dronedarone hydrochloride was carried out by Batuk D., et al (2012)27. Chromatographic separation was
carried out on silicagel G60F254 plates using acetone and methanol as mobile phases. The linear was response found in the concentration range of 200-800ng/band.
3.2. Levosimendan
The enantiomeric separation of levosimendan was described by Rambabu
C. et al (2013)28. The mobile phase consisting of Methyl-tert-butyl ether: ethanol:
trifluoro acetic acid was used. The elution times of S-Levosimendan and
R-Levosimendan were found to be 6.8 min and 11.0 minutes respectively
3.3. Rivaroxaban
Kasad P.A., et al (2013)29 carried out a study on determination of
rivaroxaban by area under curve spectrophotometric method. The study utilized methanol as a solvent and area between the wavelengths of 241nm-260nm was
measured.
A study on new spectrophotometric method for the quantification of rivaroxaban was reported by Sekaran C.B., et al (2013)30 conducted. In this method rivaroxaban in dimethyl sulphoxide was estimated at 270nm. The linearity
Satyanarayana P.V.V., et al (2013)31 reported a spectrophotometric technique for the estimation of rivaroxaban. The method utilized principle of the color formation of the rivaroxaban on binding with different reagents. The method reported linearity ranges of 2 to 90 ppm of rivaroxaban estimated using five
different reagents.
A RP-HPLC method for estimation of rivaroxaban was established by
Mustafa C., et al (2013)32. The isocratic elution was performed with ACN: water
in a ration of 55:45 v/v and the detection was done at 249nm. The rivaroxaban
was eluted at retention time of 3.37 min and the linearity was reported in concentration range of 5- 40 µg/ml.
Satyanarayana P.V.V., et al (2012)33 reported RP-HPLC method for the
quatification of rivaroxaban. The mobile phase of THF:methanol:ACN was employed in ratios of 10:40:50. The scanning was at 270 nm and the reported Rt of rivaroxaban was 2.55min. The reported linearity concentration ranges are 40
-100 µg/ml.
A novel HPLC method for estimation of rivaroxaban described by
Nallagatla V.B.R., et al (2013)34. The mobile phase consisted of Methanol: ACN
was employed. The retention time of rivaroxaban was reported at 5.35 min and linearity was reported between 10-100 µg/ml.
Pinaz A.K., (2013)35 developed RP-HPLC method for conducting
phytolytic-thermal degradation of rivaroxaban. An isocratic separation was conducted with mobile phase consisted of 50:50 v/v methanol: acetonitrile. PDA detector was used and the detection wavelength of 250 nm was fixed. The linearity was found between the range of 20-100 µg/ml.
Darshna V., et al (2014)36 has reported HPTLC method for estimation of
3.4. Ticagrelor
A spectrophotometric method was reported by Mrunal A.A., et al
(2014)37 to determine ticagrelor. Methanol was selected as a solvent and the
absorption maximum of ticagrelor was reported at 255nm. Linearity was obeyed in range of 2-7μg/mL. The recovery of ticagrelor ranged from 99.59% to 101.66%.
Lakshmana R., et al (2013)38 established HPLC method to determine
ticagrelor. The mobile phase composed of phosphate buffer and ACN was used along with the C18 column as a stationary phase. The method described linear response between 22.5-135 μg/mL. The percentage assay of ticagrelor was found to be 99.9%.
4. SCOPE & PLAN OF THE STUDY
SCOPE:
An extensive literature survey was carried out and various analytical methods reported were analyzed. There are some reported UV spectroscopy19-21, HPLC22-26 and HPTLC27 methods for the estimation of dronedarone hydrochloride. There are no reported methods for determination of Levosimendan.
There are also some reported UV spectroscopic methods29-31, HPLC32-35 and HPTLC36 for the quantification of rivaroxaban in its formulation. The UV spectrophotometric method37and validated stability indicating HPLC38 method was also reported for the determination of ticagrelor. Quantification of ticagrelor in human plasma using ultra-performance liquid chromatography was also
reported39. The reported analytical methods for the selected drugs involve usage of mobile phase systems which are costlier or less sensitive or tedious. There is a need for simple, sensitive and economical analytical methods for the determination of selected drugs. Hence the newer analytical method development for the selected drug will be useful in assay of their formulation and in-vitro drug
interaction studies with co-administered drugs.
PLAN OF STUDY:
Phase I: Development of analytical methods for the assay of selected
drugs.
UV-Visible method - It involves various parameters like selection of
solvent, fixing of wavelength, Beer’s law concentration showing linearity and range and application to formulations.
Fluorimetric method - It involves selection of fluoro tags for various
HPTLCmethod- The steps involved in method development are selection of pre-coated chromatographic plate, selection of solvent system, application of sample, detection of spots, scanning and documentation.
HPLC method - It involves the fixing up of experimental conditions such
as selection of solvent type, column type, mobile phase, effects of ionic strength, selectivity like solvent strength and temperature. It also involves ensuring limits of
parameters for system suitability.
Phase II: Validation of the developed method- After development of the
method, it has been validated as per guidelines for validation. Accuracy can be studied by recovery studies. Precision can be studied by evaluation of repeatability of the method.
Phase III: Application of the methods for the assay of formulations.
Phase IV: Application of the developed validated methods for the stability
indicating studies and in-vitro drug interaction studies.
Stability indicating studies: Forced degradation study by applying the
developed HPLC or HPTLC technique. The drugs will be subjected to acid, base and neutral hydrolysis, hydrogen peroxide induced oxidation and photochemical degradation. The analyte as well as degradation products may be resolved using validated RP-HPLC or HPTLC techniques.
In-vitro displacement interaction study: The in-vitro protein binding of
drugs are measured by equilibrium dialysis method using plasma proteins. Quantification of the free drug may be carried out using the newly developed and validated analytical technique. The fraction of unbound drug is then determined
after dialysis. The percentage displacement of study drug from protein in presence of interacting drug will be estimated after equilibrium dialysis of both drugs with protein.
Statistical Analysis: The data generated are analyzed through suitable
5. MATERIALS AND INSTRUMENTS
MATERIALS:
Reference standards used in the study were having HPLC purity >99% of dronedarone hydrochloride, rivaroxaban, levosimendan, ticagrelor, aspirin,
clopidogrel and atorvastatin were purchased from reputed suppliers with certificate of analysis. HPLC grade solvents like methanol, dimethyl sulphoxide and acetonitrile were supplied by S.D. Fine Chemicals. Rest of the chemicals and reagents used weresupplied byRanbaxy chemicals. Dialysis membrane tubes and
bovine serum albumin (BSA) obtained from Hi-Media lab. Formulations containing the selected cardiovascular drugs were procured from pharmacy.
INSTRUMENTS:
Jasco V-630 UV/VIS spectrophotometer
JASCO FP -750 spectrofluorimeter
Linomat 5 sampler applicator equipped with a 100µL syringe
Twin-trough glass chamber (CAMAG)
CAMAG TLC scanner 3
A Shimadzu LCMS – 2010EV system
Shimadzu digital Electronic Balance BL – 220 H
Systronic digital pH meter MK (VI)
Orbital shaker supplied by Sub zero lab instruments
Leelasonic ultrasonic sonicator
DRUG PROFILE
Generic Name : Dronedarone Hydrochloride40-42
Chemical Structure :
Molecular formula : C31H44N2O5S.HCl Molecular Weight : 593.22 g/mol
IUPAC Name : N-{2-butyl-3-[4-(3-dibutylaminopropoxy) benzoyl]benzofuran-5-yl}methanesulfonamide
hydrochloride Appearance : Fine white powder Physical state : Solid
Solubility : Soluble in methanol and Methylene Chloride. Category : Anti-arrhythmic agent
CDSCO approval date : 08/04/2010
Protein Binding : > 98 % binds mainly to albumin
Marketed Formulations:
Brand Name Formulation Strength
Generic Name : Levosimendan43-45
Chemical Structure :
Molecular formula : C31H44N2O5S.HCl
Molecular Weight : 280.28 g/mol
IUPAC Name : 2-[[4-[(4R)-4-methyl-6-oxo-4,5-dihydro-1H- pyridazin-3-yl] phenyl] hydrazinylidene] propanedinitrile
Appearance : Crystalline yellow powder Physical state : Solid
Solubility : Completely soluble in methanol. Category : Calcium sensitizer used in CHF CDSCO approval date : 30/04/2010
Protein Binding : 98% bound to plasma protein
Marketed Formulations:
Brand Name Formulation Strength
Generic Name : Rivaroxaban46-48
Chemical Structure :
Molecular formula : C28H36N4O2S Molecular Weight : 492.676 g/mol
IUPAC Name : 5-chloro-N-{[(5S)-2-oxo-3-[4-(3-oxomorpholin- 4-yl)phenyl]-1,3- oxazolidin-5- yl] methyl}
thiophene-2- carboxamide
Appearance : White to off-white crystalline powder Physical state : Solid
Solubility : Soluble in DMSO and is practically insoluble in water and aqueous media.
Category : Anticoagulant drug
CDSCO approval date :
30.10.2010
Protein Binding : > 95 % binds mainly to albumin Marketed Formulations:
Brand Name Formulation Strength
Generic Name : Ticagrelor49-50
Chemical Structure :
Molecular formula : C23H28F2N6O4S Molecular Weight : 522.56 g/mol
IUPAC Name : (1S,2S,3R,5S)-3-(7-{[(1R,2S)-2-(3,4- difluorophenyl)cyclopropyl]amino}-5-(propylsulfanyl)-3H -[1,2,3]triazolo[4,5-d]
pyrimidin-3-yl)-5-(2- hydroxyethoxy) cyclopentane-1,2-diol
Appearance : Fine white powder Physical state : Solid
Solubility : Freely soluble in methanol. Category : Platelet aggregation inhibitor
CDSCO approval date : 03.05.2012
Protein Binding : > 99 % to plasma proteins Marketed Formulations:
Brand Name Formulation Strength
6. EXPERIMENTAL METHODS
6.1.1. DEVELOPMENT OF VALIDATED UV SPECTROPHOTOMETRIC
METHOD FOR THE DETERMINATION OF DRONEDARONE
HYDROCHLORIDE IN TABLET DOSAGE FORM
6.1.1.1 Method development
The solvent selection was done by assessing the solubility of dronedarone
hydrochloride in different solvents. It was found that drug was completely soluble in methanol. Appropriate concentration of dronedarone hydrochloride in methanol was scanned to record the spectra. The normal spectrum was recorded using the standard solutions and converted to various derivative spectra, from which second order derivative spectrum was selected. The band at which highest absorption was observed is selected for analysis.
6.1.1.2 Preparation of standard solutions
Exactly weighed 10mg of dronedarone hydrochloride was taken and
dissolved in methanol. The volume was made up to 10ml. Further dilutions were done with methanol to achieve required concentrations.
6.1.1.3 Method validation
The validation was done as per ICH guidelines Q2(R1). The validation parameters studied are as follows;
Linearity: The working standard solutions of dronedarone hydrochloride
were scanned against blank and the absorbance was recorded at the λmax of 292 nm. The normal spectra obtained were converted to second order derivative spectra using the software. Calibration graph was obtained by plotting concentration against absorbance.
Specificity: Placebo was prepared51 with mixture of common excipients
Accuracy: A known concentration of reference was added to a pre-analyzed sample solution. The reference was added and recovery was calculated. The ratio of difference between total concentration of the analyte found and the concentration of the analyte present in pre-analyzed sample.
Precision: The precision was demostrated by repeatability (intra-day) and
intermediate precision (inter-day) studies. The intra-day precision studies were done by repeating measurements on the same day. Inter-day precision was carried out by measuring absorbance of three different concentrations on different days.
LOD and LOQ: It is calculated by the equation: LOD = 3.3(σ /S) and
LOQ = 10(σ /S), where, σ = Standard deviation of regression line and S = Slope of
the calibration curve.
Stability of solution: The stock solutions stored under room temperature
and refrigerated conditions (8°C±0.5°C) were subjected to stability study. The solutions were diluted to suitable concentration and the absorbance was measured at different time intervals.
6.1.1.4 Application of the UV spectrophotometric method for the assay of
dronedarone hydrochloride in tablet dosage form
The assay of dronedarone hydrochloride tablets was carried out by the validated second order derivative UV spectrophotometric method. Twenty tablets
of marketed formulation were weighed and powdered. The amount of powder equivalent to 10mg of dronedarone hydrochloride was taken and it was dissolved
in methanol. The solution was sonicated for 20 minutes and the volume was made up with methanol. A suitable aliquot of the filtered solution was diluted to achieve the required concentration. The absorbance of diluted solution was measured against blank at 292nm. The zero order spectrum recorded from the formulation, which was derivatized to obtain second order spectrum. The absorbance was used
6.1.2. DEVELOPMENT OF VALIDATED SPECTROFLUORIMETRIC
METHOD FOR THE DETERMINATION OF DRONEDARONE
HYDROCHLORIDE IN TABLET DOSAGE FORM
6.1.2.1 Method development
The method was based on the oxidation of dronedarone hydrochloride with CAS. The fluorescence intensity produced by cerium (III) was measured. The selection of solvent was done based on solubility of drug and methanol was selected to prepare stock solutions. Preparation of working standard was done based on trials with different solvents and water was selected. Oxidation of drug using 0.0005M
cerric ammonium sulphate in 0.05M sulphuric acid has been carried out by heating the mixture at 50 ºC using water bath for 20minutes. The spectrofluorimetric analysis was performed by scanning the oxidized samples in the region of 300-600 nm. The spectrum was recorded and fluorescence intensity were noted.
6.1.2.2 Preparation of reaction solutions
Preparation of cerric ammonium sulphate (CAS) solution: To prepare
0.0005M CAS solution, 0.0316 gm of CAS was dissolved in 0.05M sulphuric acid. The volume was made up to 100ml with 0.05M sulphuric acid.
Preparation standard solutions: From standard dronedarone hydrochloride
10mg was taken and dissolved in methanol. The volume was made up to 10ml with methanol. Working standard solution was prepared by appropriately diluting the stock
with water.
Preparation of reaction mixture: To the 2ml of CAS solution in 10ml
volumetric flasks, different volumes (1-10ml) of appropriately diluted drug solution
(2µg/ml) was added and diluted up to 10ml with water. The solution was heated at 40ºC for 30 minutes and cooled to room temperature.
6.1.2.3. Optimization of reaction condition
Acid and its concentration: Various acid like hydrochloric acid, nitric acid
Concentration and volume of CAS: Different concentrations (0.00025-0.001M) of cerric ammonium sulphate were used to evaluate its effect on fluorescence intensity. The effect of different volume of CAS solution (1-5ml) used for the reaction on fluorescence intensity was determined.
Effect of reaction temperature: The effect of reaction temperature on
fluorescence intensity of cerium (III) was evaluated by applying different temperatures (40 ºC -60 ºC) to reaction mixture.
Effect of heating time: The effect of heating time (10-50 min) on reaction mixture was studied. The optimum heating time that produces maximum intensity was
selected and applied for further studies.
Instrumental parameters: The band width and response time have been
varied to study their effect on fluorescence intensity.
6.1.2.4. Optimized conditions
The required volume of drug solution taken, 2ml of 0.0005M CAS solution on 0.05M suphuric acid was added to the volumetric flask containing drug solution. The solution was diluted to 10ml using water. and the flask was heated for 30 minutes in a water bath at 50 ºC. The mixture was further cooled and the intensity of cerium (III) was recorded. at prefixed excitation (λex=278 nm) and emission (λem=364nm)
wavelengths
6.1.2.5. Method validation
The developed spectofluorimetric method for determination of dronedarone
hydrochloride is further validated as per ICH guidelines.
Linearity: The fluorescence intensity of oxidized dronedarone hydrochloride
solutions were recorded against blank. Calibration graph plotted and the linearity concentrations were determined.
Specificity: The spectra obtained from placebo and assay sample were
compared with standard for any change in the spectra due to the presence of
Accuracy: A known concentration of reference was added to a pre-analyzed sample solution of dronedarone hydrochloride. The percentage recovery and %RSD value were calculated.
Precision: It wasevaluated by intra-day and inter-day studies. The intra-day precision studies were done by measuring fluorescence intensity three times for three different concentrations with in a day. Inter-day precision was carried out by measuring fluorescence intensity on three different days.
LOD and LOQ: On the basis of slope value obtained, LOD and LOQ were
determined from equation.
Stability of stocks: The stock solutions kept in bench top and refrigerated conditions (8°C±0.5°C) were subjected to the reaction after appropriate dilutions. The fluorescence intensity of the resulting reaction mixtures was recorded. The stability of the solution at different time intervals was determined by calculating the percentage
amount of drug remaining in the solution.
Instrumental parameters: The effect of band width on the fluorescence
intensity were studied by changing the band width 5,5 and 5,10 and also scanning speed was varied to different levels to check its effect on the fluorescence
measurement.
6.1.2.4 Application of the spectrofluorimetric method for the assay of
dronedarone hydrochloride in tablet dosage form
The assay of dronedarone hydrochloride tablets was carried out by the
validated spectrofluorimetric method. From the powdered tablets quantity equivalent to 10mg of drug was taken and it was dissolved in methanol. The solution was
6.1.3. DEVELOPMENT OF VALIDATED HPTLC METHOD FOR THE
DETERMINATION OF DRONEDARONE HYDROCHLORIDE IN TABLET
DOSAGE FORM
6.1.3.1. Method development
Based on the solubility of drug in different solvents, trials were done with acetonitrile, methanol and chloroform. It was found that dronedarone had better solubility in methanol and it was selected for the preparation of stock. Samples were spotted as bands using sampler applicator on a 10 × 10 cm silica gel G60F254 plate which was selected as a stationary phase. Linear ascending development was performed and scanning of plates was performed. It was found that at 292 nm dronedarone hydrochloride had a maximum absorbance and thus λmax of 292 nm was selected for further analysis.
Selection of mobile phase: The various composition of mobile phase tried
includes methanol: toluene, methanol: choloroform, methanol: n-hexane and methanol: water. Among all methanol: water resulted in good separation with compact spots and it was selected as a mobile phase for further study.
6.1.3.2. Optimization of chromatographic condition
Ratio of mobile phase: Effect of different ratios of methanol : water was studied tried, from which the ratio of (9:1v/v) was selected because it gave good separation with compact spots. The peaks are symmetric and the Rf value was found to be 0.8.
Optimization of chamber saturation: The above fixed mobile phase ratio
was taken in development chamber and different saturation time from 5 to 30 minutes were tried. 15 minutes of chamber saturation time was fixed for the method.
6.1.3.3 Fixed experimental conditions
Stationary phase : Pre-coated silica gel G60F254 plates Mobile phase : Methanol : water (9:1 v/v)
Band width : 6mm
Source of radiation : Deuterium lamp
6.1.3.4 Preparation standard solutions
From standard dronedarone hydrochloride 10mg was taken and dissolved using methanol. The volume was made up to 10ml. Further dilution of stock was done to get desired concentration.
6.1.3.5 Method validation
The validation was carried out by assessing linearity, repeatability, inter and intra-day precision, LOD, LOQ, plate stability and solution stability.
Linearity and Range:From 10μg/ml solution of dronedarone hydrochloride
1-10 μl was applied on a 10 ×10 TLC plate with Linomat 5 applicator. The plate was developed using Methanol : water (9:1v/v). The plate was scanned and peak areas were measured at 292nm.
Accuracy: It was determined by calculating recovery of Dronedarone
hydrochloride. The recovery of Dronedarone hydrochloride was estimated by comparing the peak area of standards. Calculation of percentage recovery and %RSD were done.
Repeatability: Repeatability was analyzed by repeating sample application
and sample measurement. Spotting a particular volume in linearity range was repeated six times and the repeatability was ensured. The peak areas were analyzed and % RSD was calculated. Repeatability of measurement was also performed by scanning of plate for six times and the %RSD value of result was calculated.
Intra-day & Inter-day precision: Intra-day precision was studied by spotting
three different volumes on the same day. Inter day precision was studied by performing the method on different days and % RSD was calculated.
LOD and LOQ: On the basis of slope obtained LOD and LOQ were
calculated using standard equation.
Stability of Solution: The stability of stock solutions stored under normal and refrigerated conditions (8°C±0.5°C) were analyzed. The solutions were diluted to suitable concentration for spotting. The required volume was spotted at various time intervals, plates were developed and scanned.
6.1.3.6. Application of the developed HPTLC method for the assay of
dronedarone hydrochloride in tablet dosage form
6.1.4. DEVELOPMENT OF VALIDATED STABILITY INDICATING
RP-HPLC METHOD FOR THE DETERMINATION OF DRONEDARONE
HYDROCHLORIDE IN TABLET DOSAGE FORM
6.1.4.1. Method development
Selection of stationary phase: Since dronedarone hydrochloride is polar in
nature reversed phase method was selected for the study. Based on molecular weight and solubility of dronedarone hydrochloride RP-HPLC method with C18 column was employed for the method development.
Selection of wavelength: The wavelength selection was done with the help of
UV spectrum of dronedarone hydrochloride. An UV spectrum of dronedarone hydrochloride was recorded and it was found that the drug has maximum absorbance at the wavelength of 292 nm. It was fixed for the detection of dronedarone hydrochloride.
Selection of mobile phase: Trials were done with different buffers and ACN
in various ratios. The disodium hydrogen phosphate buffer and ACN resulted in peak with good shape and hence it was selected for further analysis.
6.1.4.2. Initial conditions
A Hibar®RP – C18 HPLC column was selected as a stationary phase. The selected column has the advantage of high degree of retention, better reproducibility and ability to produce lower back pressure. The mobile phase selected were disodium hydrogen phosphate buffer and ACN in a ratio of 50:50%v/v. The detection was carried out at 292 nm and separation was achieved in room temperature.
Stock solution preparation: From standard drug 10mg was taken and it was
dissolved with methanol. The volume was made up to 10ml. Further dilutions were done with methanol.
Working standard preparation: From dronedarone hydrochloride stock, 1ml
was taken and the volume was made up to 10ml with methanol. Further serial dilutions were made to get required concentration ranges.
Preparation of buffer: To prepare 0.01M of disodium hydrogen phosphate