Do Dictatorships Redistribute More?
Pantelis Kammas and Vassilis Sarantides
ISSN 1749-8368
SERPS no. 2015001
1
Do dictatorships redistribute more?
Pantelis Kammas1 and Vassilis Sarantides2
March 28, 2016
Abstract: This paper seeks to examine the effect of the political regime on fiscal redistribution for a maximum of 144 developed and developing countries between 1960 and 2010. Using data on Gini coefficients before and after government intervention allows us to apply a measure of fiscal redistribution which reflects the effect of taxes and transfers on income inequality. We find that dictatorial regimes redistribute more than democracies through taxes and transfers. Our empirical findings remain robust across several different specifications and estimation techniques. Subsequently, we employ fiscal policy data in an attempt to enlighten this puzzling - at a first glance - empirical finding. Our results indicate that democracies and dictatorships actually follow different patterns of redistribution. Dictatorships redistribute income mostly through cash transfers, whereas democratic regimes basically rely on public good services (such as health and education) and consequently redistribute income mostly through in-kind public services. We interpret our empirical findings in the context of a simple theoretical framework that builds upon McGuire and Olson (1996).
JEL: P16, H5
Keywords: democracy, fiscal redistribution, public good provision
Acknowledgments: We have benefited from comments and suggestions by Toke Aidt, Stelios Arvanitis, Andy Dickerson, Sarah Brown, Marcus Drometer, George Economides, Erich Gundlach, Thanasis Lapatinas, Anastasia Litina, Alessandro Melcarne, Stelios Michalopoulos, Thomas Moutos Antonio Navas, Francisco Requena-Silvente, Petros Sekeris, Nikos Tsakiris and seminar participants at the University of Sheffield, the Athens University of Economics and Business, the Middlesex University, the 4th International Ioannina Meeting on Applied Economics, the 4th Pan-Hellenic Conference on Applied Economics “Democracy and the Economy”, the 13th Conference on Research on Economic Theory & Econometrics, the 2015 European Public Choice Society Conference and the 24th Silvaplana Workshop on Political Economy. Any remaining errors are ours.
1
University of Ioannina, Department of Economics, P.O. Box 1186, 45110 Ioannina, Greece. E-mail:
2 Corresponding author. University of Sheffield, Department of Economics, 9 Mappin Str, Sheffield S1 4DT, UK.
2
1. Introduction
Governing authorities can affect the distribution of income through a wide range of policy instruments, but most directly through implemented fiscal redistribution (i.e., cash transfers to households and taxes collected from them). Since the political system is a crucial determinant for
every governmental policy, a large number of theoretical and empirical studies investigate the interplay between political institutions and fiscal redistribution (see Acemoglu and Robinson, 2006; Boix, 2003; Lizzeri and Persico, 2004).
According to a strand of the theoretical literature, political institutions that concentrate political power within a narrow segment of the population (i.e., non-democratic regimes) generate less fiscal redistribution and greater inequality, while in contrast democratic regimes redistribute more and produce more egalitarian outcomes (see, e.g., Acemoglu and Robinson, 2006; Boix, 2003).3 Another strand of the theoretical literature investigates the impact of political institutions on the allocation of government budget between public goods and cash transfers (see, e.g., Bueno de Mesquita et al., 2003; Deacon, 2009; Lizzeri and Persico, 2004; McGuire and Olson, 1996). According to these studies, democracies favor spending on public goods (such as spending on education, health etc.) and consequently redistribute income mostly through in-kind public services, whereas dictatorships favor spending on cash transfers targeted to politically influential groups.4
Starting from Lindert (1994) a number of empirical studies have tested the relationship between political institutions and fiscal policy outcomes. Some studies have employed historical data to investigate the effect of democratization on government spending (e.g., Aidt et al., 2006; Aidt and Jensen, 2013; Boix 2003; Lindert, 1994; 2004) and taxation (Aidt and Jensen 2009a;
2009b), whereas others rely on modern data in order to examine the relationship under
3 The driving force behind this result is the mechanism highlighted by Romer (1975), Roberts (1977) and Meltzer
and Richard (1981), according to which the lower the income of the median voter, relative to the average income, the higher the demand for fiscal redistribution. Therefore, since in democracy the voting franchise is extended to poorer segments of the population, increasing the distance between the income of the median voter and the average income, the demand for redistribution increases.
4
3
consideration (see, e.g., Acemoglu et al., 2015; Baum and Lake, 2001; Bueno de Mesquita et al., 2003; Mulligan et al., 2004; Profeta et al., 2013).
Interestingly, the empirical evidence concerning the relationship between the political regime and total tax revenues appears to be mixed. Specifically, Mulligan et al., (2004) and Profeta et al., (2013) fail to provide evidence in favor of a clear-cut link between political institutions and tax policy, whereas Acemoglu et al., (2015) suggest that there is a positive and robust effect of democracy on the size of total tax revenues. Moreover, according to historical studies the extension of the voting franchise that took place in the late 19th and early 20th century
in Western European countries mostly affected the composition – rather than the size - of tax revenues in favor of direct taxation (see, e.g., Aidt and Jensen, 2009b; Aidt and Jensen, 2013). A clearer pattern appears in the relationship between political institutions and government spending. In particular, democracy seems to exert a positive and significant impact on those government spending accounts that could be viewed as redistributive (e.g., spending on health and education), as well as on specific education and health outcomes (see, e.g., Ansell, 2010; Baum and Lake, 2001; Bueno de Mesquita, 2003; Gallego, 2010; Lindert, 2004).5 However, according to Mulligan et al., (2010) non-democratic regimes spend more of their GDP on social security, and redistribute more income -though payroll taxation- compared to democracies.6
Obviously, both the theoretical and the empirical literature conclude that linking fiscal policy choices to variations in political institutions is a highly complicated research issue. If, on top of that, the research question attempts to address the effect of political institutions on redistribution, as a result of the implemented fiscal policies, then the task becomes even more ambitious.7 This is because political institutions influence many different aspects of the
5 To the best of our knowledge the only study that provides evidence in favor of a positive effect of totalitarian
regimes on education spending is Lott (1999). Following a similar rationale, Ross (2006) suggests that although democracies spend more money on education and health than non-democracies these benefits are mostly directed to middle -and upper- income groups.
6
More precisely, Mulligan et al., (2010) mostly highlight the importance of economic and demographic factors on social security policies, providing only weak evidence for the effect of political institutions. However, they suggest that if there is any observed difference between democracies and non-democracies, it is that the latter spend a little more of their GDP on social security, and moreover they redistribute more -through payroll taxes- to lower income groups.
7 The empirical literature investigating the relationship between political regime and income inequality fails to
4
implemented fiscal policy (i.e., the size as well as the composition of the government budget), and moreover income inequality can be affected through many alternative fiscal policy channels. The feature that distinguishes our analysis from the rest of the literature is that our preferred measure to capture the extend of fiscal redistribution is an outcome - not a fiscal - variable that isolates the most direct fiscal policy channel through which income is redistributed; namely through taxes and cash transfers. More specifically, our main dependent variable in this study equals to the difference between Gini coefficients before taxes and transfers, which reflects the actual effect of taxes and transfers on income inequality. Our preferred data are obtained from
the Standardized World Income Inequality Database (SWIID) as developed by Frederick Solt (Solt, 2009).8 It is worth noting that a similar measure of fiscal redistribution has been applied by other researchers in the past, to address though different research questions (see, e.g., Iversen and Soscise, 2006; Milanovic, 2000).
In turn, we categorize political regimes as democratic or dictatorial, based on three alternative dichotomous measures developed by Boix et al. (2012), Cheibub et al. (2010) and Papaioannou and Siourounis (2008), in order to examine the effect of institutions on fiscal redistribution for a maximum of 144 developed and developing countries over the period of 1960-2010. Our findings provide strong evidence that dictatorial regimes redistribute more than democracies through taxes and cash transfers. This result remains robust across several different specifications and estimation techniques. Among our robustness checks we present instrumental variables estimates that rely on the “democratization in waves” concept developed by Huntington (1993), as well as the “foreign democratic capital” theory suggested by Persson and Tabellini
(2009), to account for concerns about reverse causality.
Our second contribution in the literature is that in the second part of our empirical analysis we attempt to further illuminate our findings on actual fiscal redistribution by investigating the effect of the political institutions on specific fiscal policy variables. The merit of this strategy is twofold. First, we can enlighten the exact fiscal policy channel through which
political regimes redistribute income. Second, and more importantly, this strategy allows us to
before taxes and transfers), whereas they fail to establish any kind of relationship with net income inequality (i.e. Gini coefficient after taxes and transfers).
8
5
provide some insights for the contradicting findings of the existing literature. To this end, we investigate the impact of political institutions on fiscal revenues as well as on the allocation of government budget between public goods and cash transfers. Our analysis fails to provide evidence in favor of a relationship between political institutions and total tax revenues.9 In contrast, other empirical findings suggest that democracy exerts a positive and significant impact on government spending on education and health, whereas non-democratic regimes rely heavier on cash transfers. These findings are in accordance with a strand of the theoretical literature which suggests that democracies and dictatorships actually follow different patterns of
government spending (see, e.g., Bueno de Mesquita et al., 2003; Deacon, 2009; Lizzeri and Persico, 2004). Moreover, these results allow us to clarify the puzzling -at a first glance- empirical result of a positive and robust relationship between dictatorship and actual fiscal redistribution. Since democracies favor in-kind public services (education, health) their fiscal policies choices mostly affect gross income inequality (i.e., Gini coefficient before taxes and transfers). On the other hand, non-democracies rely more heavily on cash transfers that are expected to affect in a direct way net income inequality (i.e., Gini coefficient after taxes and transfers). Therefore actual fiscal redistribution (that equals the difference between gross income inequality and net income inequality) is expected to be higher in non-democratic regimes.10
Motivated by this evidence, in Section 4 we present a simple theoretical framework in which we interpret our empirical findings. More precisely, building upon Olson (1993; 2000) and McGuire and Olson (1996), we consider an endogenous growth model where the ruler -whether democratically elected or not- decides both the level of the tax rate and the share of the tax revenues directed to public production services. Our results are in line with those obtained by
9
Our analysis also suggests that political institutions do not affect the composition of the public budget between direct and indirect tax revenues.
10 A reasonable counter argument to this rationale is that since in non-democratic regimes citizens have no voting
6
McGuire and Olson (1996). Rulers that are characterized by a lower encompassing interest in the private consumption of the citizens (and consequently in the productivity of the whole society), direct a lower share of the tax revenues to public production services. In contrast, governments that do care for the function of the private markets direct a larger amount of resources to public production services and extract less from the public funds.11 According to Olson (1993), non-democratic regimes are usually characterized by a lower encompassing interest in the function of the private markets and consequently in the productivity of the economy.12 Following this rationale our theoretical framework suggests that non-democratic regimes direct a lower share of
the tax revenues to public production services compared to democracies.
The remainder of the paper is organized as follows: Section 2 illustrates the data and the econometric techniques employed; Section 3 discusses the empirical results. Section 4 introduces a theoretical framework that helps us to formalize the testable implications of the relevant literature. Finally, Section 5 summarizes the main points.
2. Data and Empirical Specification.
2.1 The Data
Investigating the effect of the political regime on the redistribution of income that takes place through fiscal policies appears to be an extremely ambitious and complicated research question. This is because political institutions influence many different aspects of implemented fiscal policy, and moreover income inequality is affected through many alternative fiscal policy channels. This study focuses on the most direct fiscal policy channel through which authorities redistribute income, namely on fiscal redistribution that takes place through taxes and cash transfers. Following Iversen and Soscise (2006) and Milanovic (2000), among others, we isolate this channel by taking the difference between gross income inequality (i.e., income inequality
11 Following the rationale of Olson (1993; 2000) and McGuire and Olson (1996) in democracies the prospective
majority that is required to win the national elections earns a significant amount of its income in private markets.
12 It must be noted that this view for democracies cannot be taken as a panacea. There are numerous historical
7
before taxes and transfers) and net income inequality (i.e., income inequality after taxes and transfers):
fiscal redistributionit = pretax and transfers Giniit - posttax and transfers Giniit (1)
Our data are obtained by the SWIID, developed by Frederick Solt (Solt, 2009). More precisely, Solt (2009) uses a systematic method, a “custom missing-data algorithm” to address the
non-comparability of the various surveys (e.g., Luxembourg Income Study, World Income Inequality
database etc.) that underlie the data. The SWIID maximizes the comparability of income inequality statistics for 174 countries for as many years as possible from 1960 to 2013 and provides highly reliable data that have been employed by many state of the art empirical studies (see, e.g., Acemoglu et. al., 2015; Brueckner et al., 2015; De Haan and Sturm, 2015).
In order to provide some simple descriptive statistics of the variable fiscal redistribution, we note that its mean value in our sample is 5.25 (the standard deviation is equal to 5.58), with higher values indicating a higher level of fiscal redistribution. Moreover, the descriptive statistics indicate that Denmark and Sweden are amongst the countries that achieve the maximum fiscal redistribution over the period examined with values that exceed 24 points, while, in sharp contrast, Sri Lanka present regressive fiscal redistribution that some years exceeds -10 points.13
For the main explanatory variable of our study, we use the dichotomous classification of regimes as democracy and dictatorship from three alternative data sources. In particular, we employ the dichotomous variable developed by Cheibub et al. (2010, henceforth CGV) that classifies regimes as democratic or dictatorial for 202 countries over the period 1946 to 2008. The key political factors that CGV takes into account in order to codify a period as democratic are: (i) popular elections of the executive and legislature, (ii) multiple parties competing in the election and (iii) unconsolidated incumbent advantage. We also use the dichotomous measure
developed by Boix et al. (2012, henceforth BMR) that provides information for 219 distinct countries from 1800 to 2007. The BMR dichotomous measure qualifies a country as democratic
if, in addition to the factors that were taken into account by CGV, at least half of the male
13 It is worth noting that Botswana, Burkina Faso, Ethiopia, Fiji, Sri Lanka and Thailand are the only countries in
8
electorate is enfranchised.14 Finally, our analysis also relies on the dichotomous measure developed by Papaioannou and Siourounis (2008, henceforth P&S) that provides information for 174 countries over the period 1960-2005, which subsequently we extend until 2010. The definition of P&S builds on the theory of Huntington (1993) of democratization in waves, and it identifies permanent changes in the democratic status. Hence, although the CGV and BMR
measures capture political transitions to democracy as well as reversals (i.e., transitions to non-democratic regimes), the P&S measure places the spotlight solely on permanent democratization episodes. According to P&S, although this approach may cause misclassification in some
countries, it enables them to measure the effects of regime transitions more properly.
To ensure robust econometric identification, our analysis employs a number of covariates that are expected to affect fiscal redistribution. In particular, we control for the level of economic development by employing the log of real GDP per capita (denoted as GDP per capita) obtained from the Penn World Tables. According to Wagner’s law, we expect richer countries to have larger public sectors, which in turn may affect the extent of fiscal redistribution. Moreover, given that a number of studies have shown a direct effect of democratization on economic growth (see, e.g., Acemoglu et al., 2014) controlling for GDP per capita reduces the potential omitted variable bias in our empirical specification. Our next control variable is the dependency ratio of the population (denoted as age dependency). It is measured as the percentage of the population younger than 15 years or older than 64 to the number of people of working age between 15 and 64 years. According to a number of studies, demographic factors consist a basic driving force behind the design of fiscal policy (see, e.g., Lindert, 1994; Mulligan et al., 2004; Mulligan et al., 2010). Finally, our analysis takes into account the effects of international market integration by including the ratio of imports plus exports to GDP (denoted as openness). It is well established in the literature that the demand for spending, especially for income transfer programmes, varies positively with the degree of globalization as a safety net against the exposure to the terms of trade risk (see, e.g., Rodrik, 1997; 1998).
It is worth noting that we have attempted to include in our model a series of other variables, such as the urbanization rate, the population size, the average years of schooling and
many others. However, none of these variables had a significant effect on our dependent
14 Both, the CGV and the BMR datasets, are different updates and revisions of the well-established dichotomous
9
variable, and due to other concerns as well (correlation of control variables, reduction of sample size), we do not include them in our estimations.15 Our unbalanced cross-country time series dataset includes observations for a maximum of 144 countries over the period of 1960-2010.16 A complete list of all variables used in our estimations is provided in the Appendix.
2.2 Econometric Model
To analyse the influence of political institutions on fiscal redistribution, we formulate the following empirical model:
𝑌𝑖𝑡 = 𝛼1𝐷𝑖𝑐𝑡𝑎𝑡𝑜𝑟𝑠ℎ𝑖𝑝𝑖𝑡−1+ 𝛽𝑋𝑖𝑡−1+ 𝛾𝑖+ 𝛿𝑡+ 𝜀𝑖𝑡 (2)
where denotes the dependent variable fiscal redistribution, in country i and year t. The
variable𝐷𝑖𝑐𝑡𝑎𝑡𝑜𝑟𝑠ℎ𝑖𝑝𝑖𝑡−1is dummy variable that takes the value one if a country is categorized
as non-democratic at year t-1, according to the CGV, BMR, and P&S dichotomous classification of regimes, and zero otherwise. Moreover, 𝑋𝑖𝑡−1 includes the additional covariates that are
expected to affect fiscal redistribution. Finally and correspond to country and time fixed
effects, respectively, and is the error term. In this specification year t represents the last
observation of each 5 year sub-period (1965, 1970,.., 2010) of our sample, whereas year t-1 the
first observation of each sub-period (1960, 1966,..,2006) (see also Acemoglu et al., 2015). We follow this specification for three reasons. First, the lagged value of the variable Dictatorship is preferred because we expect its effect not to be contemporaneous. Second, this approach allows us to mitigate concerns of reverse causality running form the explanatory variables to fiscal redistribution. Finally, as already mentioned, Solt (2009) employed a custom missing-data algorithm in order to standardize Gini estimates from all major existing resources of inequality data. In order to minimize reliance on problematic assumptions, Solt (2009) uses as much information as possible from proximate years within the same economy to estimate missing country-years. Our empirical specification that uses one observation of each 5 year sub-period of
15
All these empirical findings are available upon request.
16 Although we begin with all the countries from the World Bank’s World Development Indicators, we exclude from
our sample non-independent territories and very small-states (e.g., Andorra, Monaco, Puerto Rico, Timor-Leste, etc.). Subsequently, the sample size was restricted by the availability of the income inequality data.
it Y
i
t
it
10
our sample aims to reduce, to the degree possible, the problems from data imputation from observations within the same country.
The model could be dynamic due to the persistence in inequality and fiscal commitments that carry over from one year to the next. To capture this persistence, previous empirical studies have applied dynamic panel specifications (see, e.g., Aidt and Jensen, 2013; Amendola et al., 2013). Following the rationale of this literature, we include a lagged dependent variable in our model estimating the following equation:
𝑌𝑖𝑡 = 𝑎1𝑌𝑖𝑡−1+ 𝛼2𝐷𝑖𝑐𝑡𝑎𝑡𝑜𝑟𝑠ℎ𝑖𝑝𝑖𝑡−1+ 𝛽𝑋𝑖𝑡−1+ 𝛾𝑖+ 𝛿𝑡+ 𝜀𝑖𝑡 (3)
We seek a robust method to identify the extent of fiscal redistribution between democratic and dictatorial regimes. To establish baseline results, we estimate equation (2) using the standard within estimator. This method guarantees that our estimates are not contaminated by aggregate shocks and trends common to all countries or by time invariant country-specific characteristics.
In order to estimate equation (3), we cannot rely on a dynamic Fixed Effects (FE) model,
since the inclusion of a lagged dependent variable on the right hand side of the estimated equation introduces a potential bias by not satisfying the strict exogeneity assumption of the error term εit. As shown in the literature, the estimated bias of this formulation is of order 1/T, where T
is the time length of the panel, even as the number of countries becomes large (see, among others, Kiviet, 1995; Nickell, 1981). The time series length of our panel is on average below 7 observations per country and, hence, the bias is not negligible. To address this issue we rely on the generalized method of moments (GMM) for dynamic panel models, as proposed by Holtz-Eakin et al. (1988) and Arellano and Bond (1991). This econometric technique removes fixed effects using either first-differencing or forward orthogonal deviations. In our case, we apply the forward orthogonal deviations as proposed by Arellano and Bover (1995) as follows:
∆𝑌𝑖𝑡 = 𝑎1∆𝑌𝑖𝑡−1+ 𝛼2∆𝐷𝑖𝑐𝑡𝑎𝑡𝑜𝑟𝑠ℎ𝑖𝑝𝑖𝑡−1+ 𝛽∆𝑋𝑖𝑡−1+ ∆𝛿𝑡+ ∆𝜀𝑖𝑡 (4)
11
problems, it introduces a correlation between the new error term and the lagged dependent variable. To address this issue, Arellano and Bond (1991) suggest the use of lagged values of the explanatory variables in levels as instruments.17 Therefore, the lagged endogenous regressor is instrumented with second and further lags of the dependent variable, whereas all the other covariates are considered as exogenous.
Although the use of lagged values of the variable Dictatorship in empirical specifications (2) and (4) mitigate concerns of endogeneity to some extent, it does not resolve the issue. To further dispel these concerns, in section 3.2.3 we adopt a 2SLS identification strategy. The
challenge in our case is to find an external instrument that affects fiscal redistribution only through its effect on the political regime. Along these lines, we consider regional democratic diffusion as an attractive source of exogenous variation for the determination of the domestic political regime (see also Acemoglu et al., 2015).
3. Results
3.1 Baseline Results
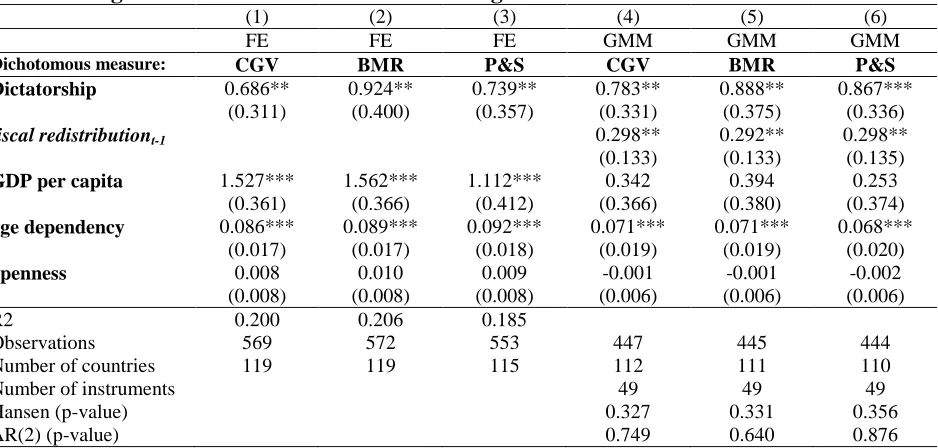
Our baseline results are reported in Table 1. In columns (1) to (3) of Table 1 we report the estimates of equation (2) where each time the variable fiscal redistribution is regressed on one of the three alternative measures of Dictatorship, as well as on theadditional covariates. As can be seen, in all alternative specifications Dictatorship bears a positive and highly significant coefficient highlighting the positive effect of non-democratic political institutions on fiscal redistribution. As far as the rest of the covariates are concerned, we observe that all of them enter with positive and significant coefficients which are in accordance with our theoretical priors.
[Insert Table 1, here]
17 An alternative to the difference-GMM is the Blundell and Bond’s (2000) system-GMM estimator, which
12
Moving one step forward, in columns (4) to (9) of Table 1 we add the lagged dependent variable into the set of controls. In columns (5), (7) and (9), we use the GMM estimator as described in equation (4), whereas in columns (4), (6) and (8) we report the Dynamic FE estimates for comparison reasons. The first thing to notice is that the lagged dependent variable enters in all regressions with a positive and statistically significant coefficient. Moreover, as expected, the coefficient of the lagged dependent variable in the GMM estimates is higher than those in the FE estimates. Regarding the main variable of interest, as can be easily verified, all three measures of Dictatorship, namely CGV, BMR and P&S, retain their positive and
statistically significant effect on fiscal redistribution. As far as the rest of the covariates are concerned, our empirical findings suggest that in the presence of the lagged dependent variable, only the age dependency retains its statistically significant effect on fiscal redistribution. The consistency of the GMM estimator depends on the validity of the assumption of no serial correlation in the error term (i.e., no second-order autocorrelation in the differenced idiosyncratic errors) and on the validity of the instruments. The Arellano–Bond test of second order serial correlation indicates that there is no second-order serial correlation among the differenced residuals, and the Hansen test of over-identifying restrictions suggests that our instruments are valid. Hence, although the lagged dependent variable is highly significant in all alternative specifications, illustrating that there is a considerable degree of persistence in the redistributive mechanisms, the positive relationship between the variables Dictatorship and fiscal redistribution remains unaffected in all specifications.
Concerning the magnitude of the long-run effect of the variable Dictatorship, according to the static specification in columns (1) to (3) of Table 1, this lies between 1.09 and 1.6 points. To obtain the long-run effect in the dynamic specification, the coefficient of the variable
Dictatorship is divided by (1 – fiscal redistributiont-1). According to the GMM estimates, the
long-run effect is slightly higher lying between 1.4 and 1.95 points. Given that the mean value of
absolute fiscal redistribution in the sample is 5.25 points (with a standard deviation of 5.58), it is
clear that this effect is quantitatively sizable.
3.2 Sensitivity analysis
13
the set of the control variables gross income inequality. In that way, we can exclude the possibility that our results are driven by differences in market inequality between democratic and dictatorial regimes. Finally, we take an instrumental variables approach in order to mitigate further concerns for potential endogeneity and omitted variable bias in our results.
3.2.1. Testing for outliers
Our first step in the sensitivity analysis is to ensure that our findings are not influenced by outlier observations. For this reason, we re-estimate equations (2) and (4) without countries with a
standardized residual above 1.96 or below -1.96.18 More precisely, in columns (1) to (3) of Table 2 we replicate the static FE estimates of Table 1, whereas in columns (4) to (6) we replicate the GMM estimates of Table 1. By repeating the regressions without the identified outlier observations we drop up to 34% of our sample. As can be easily verified, Dictatorship bears again a positive and highly significant coefficient. However, we note that the implied long-run effect of the variable Dictatorship on fiscal redistribution is much lower in comparison to Table 1. Moreover, as expected, the R-squared of the FE estimates has significantly been improved by the exclusion of the outliers. Regarding the rest of the control variables, in Table 2 our empirical findings remain qualitatively identical to those depicted in Table 1.19
[Insert Table 2, here]
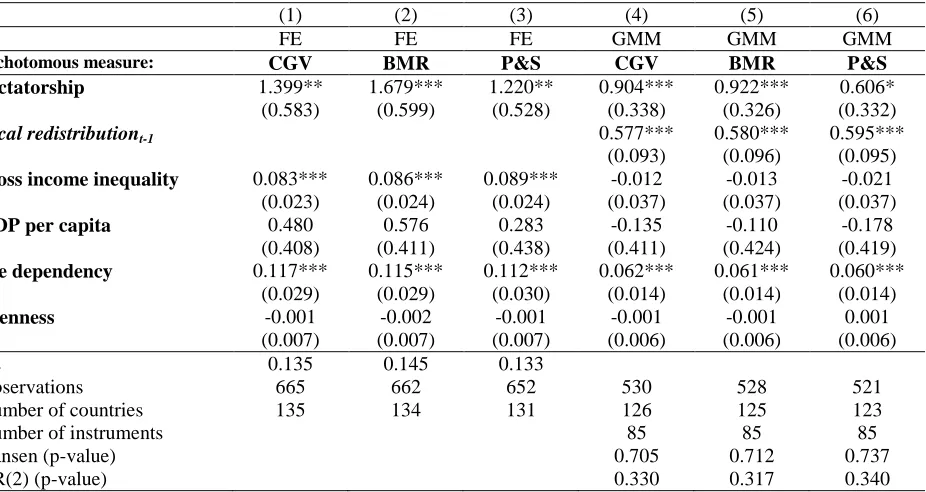
3.2.2. Adding gross income inequality in the set of control variables
Our next robustness check is to add in the set of the control variables gross income inequality. According to Meltzer and Richard (1981) higher levels of income inequality (i.e., larger distance between the median’s voter and the average income) lead to increased demand for fiscal
redistribution. Therefore, gross income inequality is expected to exert a positive impact on fiscal redistribution. Moreover, controlling for gross income inequality our analysis seeks to isolate a
large number of potential fiscal policy channels through which political institutions may affect
18 We prefer this cut-off point, instead of the standard textbook way where standardized residuals have an absolute
value greater than 3 (see, e.g., Maddala, 2001), in order to ensure further the precision of our results.
19
14
income redistribution. As we have already discussed, democracy exerts a positive impact on specific government spending accounts (such as government spending on health and education) that are expected to affect directly gross income inequality (see, e.g., Ansell, 2010; Baum and Lake, 2001; Gallego, 2010). Therefore, by including gross income inequality in our set of controls, our analysis mitigates a large number of potential fiscal policy channels that may introduce significant noise to the obtained empirical findings.
[Insert Table 3, here]
In Table 3 we replicate the static FE estimates and the GMM estimates of Table 1. As can be seen, the empirical results regarding the variable Dictatorship remain qualitatively identical to those presented in Table 1. Moreover, gross income inequality enters with a positive and statistically significant coefficient in columns (1) to (3).20 This finding is in accordance with the rationale developed by Meltzer and Richard (1981), which suggests that more unequal countries are expected to redistribute more. However, this result becomes statistically insignificant in
columns (4) to (6) when the lagged dependent variable enters in the specification with a positive and statistically significant coefficient. Regarding the rest of the controls variables, once again
age dependency bears a positive and statistically coefficient in all specifications highlighting the robust effect of demographic factors on fiscal redistribution.
3.2.3 The 2SLS identification strategy
The empirical strategy with the lagged dependent variable on the right hand side of the estimated equation, in addition to the full set of country and time fixed effects, rules out certain types of contaminating factors for our results. However, one could still argue that our results can be affected by potential reverse causality running from fiscal redistribution to the political regime, by the measurement error of the alternative regime-type variables that we use in our empirical analysis as well as potential omitted variable bias. To deal with these concerns, in this sub-section we follow a 2SLS identification strategy.
The challenge in our case is to find an instrument that is adequately correlated with the regime within the country, while it remains uncorrelated with the unobserved time-varying
20 Although the variable gross inequality is treated as endogenous in the GMM estimates, the way it is treated does
15
component that affects fiscal redistribution. In other words, we need a variable that affects fiscal redistribution only through its effect on the regime within the country. Following the “democratization in waves” concept developed by Huntington (1993), as well as the “foreign democratic capital” theory suggested by Persson and Tabellini (2009), we conclude that regional
democratic diffusion appears to be an attractive source of exogenous variation in the determination of the domestic regime. To this end, we apply the inverse distance weighting formula in order to develop the variable Democracy abroad for country i in year t as follows:
𝑍𝑖𝑡 = ∑𝑗≠𝑖𝑊𝑖𝑗𝐷𝑗𝑡
∑𝑗≠𝑖𝑊𝑖𝑗 (5)
where Djt is a dummy variable that takes the value one if according to the dichotomous
regime-type data that we employ, country j (different from i) is classified as democratic and 0 otherwise. Moreover, Wij is the inverse distance in kilometres between the capitals of country i and j.
Therefore, our instrument 𝑍𝑖𝑡 takes values between 0 and 1, with higher values indicating that a
country has more democratic countries in the geographic neighbourhood. More than that, a wave of democratization that takes place within a geographic neighbourhood is expected to increase the value of 𝑍𝑖𝑡 through time. It is worth that Acemoglu et al. (2015) have applied a similar
instrument in their study to tackle the aforementioned econometric issues, whereas Ansell (2010) and Aidt and Jensen (2013), as in our case, add the lagged value of the instrumented variable in the vector of instruments.
In Table 4 we re-estimate our basic specification as described in equation (2), with and without the inclusion of the variable gross income inequality. More precisely, in columns (1) to (3) of Table 4 we re-estimate our basic specification presented in columns (1) to (3) of Table 1, whereas in columns (4) to (6) we add in the set of the control variables gross income inequality. We abstain from employing a dynamic specification, since the inclusion of a lagged dependent variable on the right hand side of the equation introduces a potential bias in our estimates (see, e.g., Nickell, 1981). The first-stage results are reported in the lower part of the Table 4.
As can be easily verified, the lagged value of Dictatorship enters with a positive and highly significant coefficient in all alternative estimates. Moreover, the coefficient of the variable
16
and valid to predict the endogenous variable Dictatorship. For this reason, first we refer to the first stage F-statistics of the excluded instruments. According to Staiger and Stock (1997), the first stage F-statistic should be at least 10 for weak identification not to be a problem. As can be seen, the first-stage F statistics in Table 4 are high enough to guard against the problem of weak instruments. Second, since the number of excluded instruments exceeds the number of endogenous variables, a Hansen test statistic can be calculated to test the validity of the overidentifying restrictions. The null hypothesis is that the instruments are valid and thus uncorrelated with the error term. In columns (1)-(2) and (4)-(5) the overidentification test does
not reject the null hypothesis, giving some confidence in the overall set of instruments. However, the low p-value for the overidentification test in the columns that we use the P&S measure of dictatorship cast some doubt on the exogeneity of the instruments in this specification.
[Insert Table 4, here]
The results reported in Table 4 verify once again the positive effect of the variable
Dictatorship on fiscal redistribution. It is worth noting that the 2SLS coefficients of the variable
Dictatorship are higher than those obtained with the within estimator. We interpret the larger coefficients in the 2SLS estimates as a possible measurement error problem in the right hand side endogenous variable, which leads to an attenuation bias in the OLS estimates (see Angrist and Krueger, 1999). Finally, the results for the rest of the covariates are in line with those presented in Tables 1-3.
3.3 Fiscal Policy Channels
17
detail), and employs as dependent variables a number of fiscal policy measures that reflect the level as well as the composition of fiscal policy.
First, our analysis employs data from the ICTD Government Revenue Dataset (ICTD). ICTD covers 188 countries over the period 1980-2013 and it has been compiled by sources like the IMF Government Finance Statistics (GFS) and the IMF Article IV Reports. This is a new and high quality source for internationally comparable disaggregated tax data that draws both on central and general government data as appropriate in order to provide the most accurate possible picture of national revenue collection (see, Prichard et al., 2014). Most researchers dealing with
developing countries have historically focused on central government data only, in order to maximize data coverage. The contribution of this dataset is that it provides data at the general government level - when available - which allows researchers to avoid the underestimation of revenue collection in federal states. Second, we employ data from the Economic Freedom of the World project (EFW) that reports measures for the size of the general government every five years since 1970, and annually since 2000, until 2012 for a maximum of 153 countries.
These two databases use as one of their primary sources the GFS for fiscal data before and after 1990. Therefore, both face the same issue of comparability of data before and after this period. Although for data until 2000 financial information was calculated according to the Government Finance Statistics Manual 1986 (GFSM 1986) classification, since then the Government Finance Statistics Manual 2001 (GFSM 2001) framework has been used. The new classification has been applied retrospectively to data from 1990 onwards. However, it is difficult to bridge the two frameworks since fiscal variables are measured on a ‘cash’ basis in the GFSM 1986 and on an ‘accrual’ basis in the GFSM 2001 classification.21
For this reason we also employ data from the Global Development Network Growth Database (GDNGD), which is a reliable source for disaggregated fiscal revenue and expenditure data for 123 countries over the period 1972-2000. Its primary source is GFS and it covers consolidated central government accounts based entirely in the GFSM1986 classification.
Concerning the fiscal revenues side, we employ in our analysis measures which allow us to capture the size the tax system. More precisely, we obtain from the ICTD the variables total
revenues and total tax revenues (denoted as revenues_ICTD and tax revenues_ICTD,
18
respectively), both scaled by GDP and expressed as percentages.22 We obtain the respective variables from the GDNGD, which are denoted as revenues_GDNGD and
tax_revenues_GDNGD. According to the standard Meltzer and Richard (1981) argument, we expect all these alternative variables to be negatively affected by non-democratic institutions. This is because in democracy the voting rights are extended to poorer segments of the population, which in turn increase the distance between the income of the median voter and the average income and thus the demand for fiscal redistribution (see, e.g., Boix, 2003; Acemoglu and Robinson, 2006).23
Concerning the expenditures side, we use the following four variables. First, the fiscal variable social security and welfare affairs and services as a share of GDP (denoted as social _services_GDNGD) obtained from the GDNGD. This measure includes central government’s payments, both in cash and in kind, which intend to compensate for reduction or loss of income or inadequate earning capacity.24 Second, we employ the variable subsidies and transfers as a share of GDP (denoted as services_subsidies_EFW) obtained from the EFW database, which includes subsidies and social benefits in cash and in kind of the general government. Third, we construct a similar variable from the GDNGD by summing the variables subsidies and transfers to households and nonprofit institutions (denoted as transfers_subsidies_GDNGD). This variable concerns the central government and it has the advantage of including only in cash payments.25 Finally, we sum health and education expenditures as a share of GDP from the GDNGD in order to construct the variable health_education_GDNGD. According to a strand of the relevant theoretical literature democracies favor spending on public goods services (such as on health and education) and consequently redistribute income mostly through in-kind public services. In contrast, dictatorships rely heavier on cash transfers (see, e.g., Bueno de Mesquita et al., 2003; Deacon, 2009; Lizzeri and Persico, 2004).
22
An additional advantage of the ICTD is that it flags the observations that are not credible for international comparisons. Using this information we exclude from the analysis observations for which the variables prob1, prob2 and prob3 take the value of 1. For details see pp. 30-32 in Prichard et al. (2014).
23 However, the empirical evidence is mixed. Specifically, Mulligan et al., (2004) and Profeta et al., (2013) fail to
provide evidence in favor of any link between political institutions and tax policy, whereas Acemoglu et al., (2015) suggest that there is a positive and robust relationship between democracy and total tax revenues.
24 For more information regarding the expenditure categories that compose the fiscal variable social security and
welfare affairs and services see page 46 in the following link:
https://www.imf.org/external/pubs/ft/gfs/manual/1986/eng/pdf/ch4a.pdf
25 Unfortunately, we cannot exclude the transfers to non-profit institutions from the calculation because the database
19
In the analysis that follows we modify the estimated equation (2) of section 3.2 as follows:
𝑌𝑖𝑡,𝑡+4= 𝛼1𝐷𝑖𝑐𝑡𝑎𝑡𝑜𝑟𝑠ℎ𝑖𝑝𝑖𝑡+ 𝛽𝑋𝑖𝑡,𝑡+4+ 𝛾𝑖 + 𝛿𝑡+ 𝜀𝑖𝑡 (6)
where 𝑌𝑖𝑡,𝑡+4represents a fiscal variable in country i over a five year period. The variable 𝐷𝑖𝑐𝑡𝑎𝑡𝑜𝑟𝑠ℎ𝑖𝑝𝑖𝑡is a dummy variable that takes the value 1 if a country is categorized as
non-democratic in the beginning of each five year period, and 0 otherwise. Moreover, 𝑋𝑖𝑡,𝑡+4 is the
vector of socio-economic variables, as described in section 3.1, in country i over a five year
period. Finally, and correspond to country and time fixed effects, respectively, and is
the error term.
We prefer the specification of equation (6) in this section for two reasons. First and foremost, as mentioned in section 2.2, one of the reasons that we chose to take one observation of our dependent variable for each 5-year sub-period of our sample is the custom missing algorithm employed by Solt (2009), which uses as much information as possible from proximate years within the same economy to estimate missing observations. Therefore, the strategy adopted in section 3 allows us to reduce, to the degree possible, the problems from data imputation from observations within the same country. Given that we do not face this issue with fiscal data, we
resort to non-overlapping 5-year averages over the period 1970-2010 so as to smooth over some of the cyclical features of the data (see, e.g., Kneller et al., 1999).26 Second, given that fiscal data have missing observations and gaps, taking five-year averages, instead of one observation for each 5-year period, allows us to maximize the available number of observations. It is worth mentioning that we do not estimate a dynamic specification in this section, because introducing a lagged dependent variable either does not affect our results or it reduces our sample so significantly that makes its use irrelevant. Moreover, given that EFW database provides one observation every five years until 2000, in specifications that we employ the variable
transfers_EFW, we use the first observation of each 5-year sub-period of our sample in both sides of the estimated equation.
26 Our fiscal dataset starts in 1970, instead of 1960, because this is the first year that that one of our fiscal datasets,
EFW, goes back in time. i
20
The results for the revenue variables are presented in Table 5, whereas those for the expenditure variables in Table 6. As can be seen in Table 5, Dictatorship bears a non-significant coefficient in all alternative specifications. Therefore, based on the results presented in columns (1)-(12), our analysis fails to provide evidence that political institutions influence the level of fiscal revenues. These empirical findings are in line with previous studies suggesting that political institutions do not play an important role in the design of tax policy (see, e.g., Mulligan et al., 2004; Profeta et al., 2013; Scheve and Stasavage, 2012). Related to these results, it is worth mentioning that for brevity we do not report estimates that concern the composition of tax
revenues. However, in specifications that we use direct and indirect tax revenues as dependent variables, once again, the variable Dictatorship is statistically insignificant.27 Regarding the rest of the covariates, as expected, the variable GDP per capita is positive and significantly related to total revenues and the variable tax_revenues_GDNGD. The variable openness is statistically insignificant in all specifications, while the variable age_dependency enters with a negative and significant coefficient in some of the empirical specifications.
[Insert Table 5, here]
In Table 6 our analysis investigates whether political institutions influence the allocation of government budget between specific type of public goods and cash transfers. As can be easily verified in columns (1)-(6), the variable Dictatorship enters with a non-significant coefficient in all alternative specifications. Therefore our analysis fails to provide any clear cut relationship between political regime and social spending accounts that include both in cash and in kind transfers (i.e., social_services_GDNGD and services_subsidies_EFW).
In contrast, the variable Dictatorship is positive and statistically significant in columns (8) and (9), where the dependent variable transfers_GDNGD includes only in cash transfers to the population. Moreover, according to the results in columns (10)-(12) dictatorial regimes are
negatively related to health and education spending. Therefore, our empirical findings suggest that democracies and dictatorships actually follow different patterns of redistribution through the
implemented fiscal policy. More precisely, dictatorial regimes redistribute income mostly through cash transfers, whereas democratic regimes basically rely on public good services (such
21
as health and education) and consequently redistribute income mostly through in-kind public services. To the best of our knowledge the only other study that has provided similar evidence regarding the effect of the political regime on the composition of public spending is by Kaufman and Segura-Ubiergo (2001) for a sample of Latin American countries over the period 1973-1997. Regarding the negative effect of Dictatorship on health and education spending, our results are in line with many previous empirical studies that have provided similar evidence for these specific spending accounts (see, e.g., Ansell, 2010; Baum and Lake, 2001; Bueno de Mesquita, 2003; Gallego, 2010; Lindert, 2004). Finally, our control variables do not seem to depict any
robust relationship with any of the fiscal variables in Table 6.
[Insert Table 6, here]
Summarizing, our empirical findings presented in Tables 5 and 6 suggest that political institutions do not exert any impact on fiscal revenues or their composition, but they do influence the allocation of government spending between public goods and cash transfers. These empirical findings help us to further illuminate the puzzling –at a first glance-empirical results presented in Tables 1 to 4. Democratic regimes rely heavier on in-kind public services (education, health) and their policies basically affect gross income inequality (i.e., Gini coefficient before taxes and transfers), whereas dictatorships redistribute income mostly through cash transfers. As a result, actual fiscal redistribution that takes place through cash transfers and taxes is expected to increase in non-democratic regimes.
4. A theoretical framework along the lines of McGuire and Olson (1996)
Motivated by the empirical evidence presented above, this Section investigates theoretically why political regimes follow different patterns of fiscal policy. To this end, our analysis presents a simple theoretical model that builds upon Olson (1993; 2000) and McGuire and Olson (1996),
which highlights the encompassing interest of the ruler for the productivity of the whole economy as a crucial factor. More precisely, we consider an endogenous growth model where
22
his own purposes. Thus, these resources are affecting the welfare of the ruler either directly (by increasing his own consumption) or indirectly (by increasing his ability to “buy” political support). In any case these resources are directed away from productive activities.
4.1 Households
The intertemporal utility of the representative household is:
0
(log )
t t t
U c
(7)where ct is the private consumption at time t, and 0 1 is the discount rate.
At each time t, the household rents its predetermined capital, kt, to the firm and receives
r kt t, where rt is the return to capital. It also supplies inelastically one unit of labor services per
time-period so that labor income is wt. Further, it receives profits made by firms, t. Thus, the household’s budget constraint is:
kt1 ct 1 t r kt t wt t (8)
where kt1 is the end-of-period capital stock and 0t 1 is the income tax rate. For simplicity,
we assume full capital depreciation. The initial capital stock, k0, is given.
The household chooses the paths of ct and kt1 to maximize (7) subject to (8). In doing so, it
acts competitively by taking prices, profits and policy variables as given. The first-order conditions of the household’s problem are:
1 1 1
1 1
t t t
t c
r c
(9)
23
4.2 Firms
The representative firm maximizes the usual profit, t, function:
t t t t t
t y rk wl
(10)
As in the literature introduced by Barro (1990), we assume that public services provide production externalities to private firms. We also assume that technology at the firm’s level takes a Cobb-Douglas form. Thus, the firm’s production function is:
1 1
t t t t
y Ak l G (11)
where yt is output at t, lt is the labor input at t, gt is public production services at t, A0 and
0 1.
The firm chooses kt and lt. In doing so, it acts competitively by taking prices and policy
variables as given. The first-order conditions of the firm’s problem are:
t t t
k y
r
(12a)t t t
l y
w (1
) (12b)4.3 Government budget constraint
To finance the public good the ruler taxes the household’s income at a rate 0t 1. Thus,
t t t t t t t
R G r k w (13a)
Without loss of generality, we assume that a share 0bt 1 of total tax revenues finances public
production services, Gt, and the rest 0(1bt)1 is used by the ruler for his own purposes.
24
t t t t t t t
G b r k w (13b)
1
t t t t t t t
R b r k w (13c)
where inspection of (13a)-(13c) reveals that t and bt can summarize fiscal policy at t.
4.4 Competitive decentralized equilibrium (for given economic policy)
Given the paths of the policy instruments {t,bt}t0, a competitive decentralized equilibrium
(CDE) is defined to be a sequence of allocations { , ,y c kt t t1,G Rt, t t}0 and prices { ,rt wt}t0 such
that: (i) households maximize utility and firms maximize profits by taking prices, policy and
public services as given; (ii) all budget constraints are satisfied; (iii) all markets clear.28 This CDE is summarized by the following equations that give the paths of output, private consumption, private capital accumulation:
t t
tt A b k
y 1 1 (14a)
t
t t
tt A b k
c 1 1 1 1 (14b)
t
t t
tt A b k
k 1 1
1 1 (14c)
1 1
t t t t t t
G b A b k
(14d)
1
11
t t t t t t
R b A b k
(14e)
In this solution, yt, ct, kt1 , Gtand Rt depend on the beginning-of-period capital stock and the
current value of the policy instruments only.29
28 In the labor market, the market-clearing condition is
1
t
l .
29
25
4.5 Optimal Fiscal Policy
We now endogenize policy by assuming that the ruler chooses the paths of tand bt in order to
maximize his own well-being (we specify ruler’s objective function in Equation (9) below). In doing so the ruler takes into account the CDE as summarized by (14a)-(14e).
4.5.1 The ruler’s problem
Following McGuire and Olson (1996) we assume that the ruler (whether democratically elected or not) maximizes the following intertemporal objective function:
0
log (1 ) log
t
t t
t
W F c F R
(15)
where 0 1 is the discount rate of the ruler and 0F1 is a parameter that captures the
degree of the encompassing interest of the ruler in private consumption of the citizens and consequently in the productivity of the whole society.30 Obviously, the second term of the objective function captures the incentive of the ruler to extract the maximum amount of resources from the public funds and to use it for his own purposes. As can be easily verified when parameter F tends to zero the ruler gains utility solely through rent extraction.31 In contrast, when F is larger than zero, the ruler also cares for the welfare of their citizens (who earn a significant amount of their income in private markets) and this is the case of the “redistributive
democracy" as defined by McGuire and Olson (1996).32
We will use dynamic programming to solve the ruler’s problem. From the governor’s
point of view, the state at any time t is the predetermined economy-wide capital stock, kt .Then
V(kt) denote the value function at t. This function must satisfy the Bellman equation:
30 Olson (1993) suggests that in democratic regimes candidates need a majority to win and they might be able to
“buy” a majority by transferring income from the population to this prospective majority. However, the competition for vote buying will not generate that large distortion of incentives through taxation as in autocracies. This is because in democracies the majority earns a significant share of the market income of the society and this gives to the democratically elected government a more encompassing interest the function of the private markets and consequently in the productivity of the economy.
31
According to McGuire and Olson (1996) this is the case of a “pure autocracy”.
32 Though essentially ad hoc, this characterization of policy-makers’ preferences is a convenient way of
26
1 ,
( ) max[ log (1 ) log ( )]
t t
t t t t
b
V k F c F R V k
(16)
where ct, kt+1 and Rt follows (14b), (14c) and (14e) respectively.
Inspection of the above problem reveals that the value function in (16) is expected to be of the log-linear form V(kt)=u0+u1logkt where u0 and u1 are undetermined coefficients. Using this
conjecture for the value function into (16), the first order conditions for θt and bt are
respectively:33
1 (1 )
t a a F
(17a)
1
1 (1 )
t
a b
a a F
(17b)
As can be easily verified, the chosen policy instruments are independent of the state of the economy kt and they are constant over time θt=θ and bt=b for all t. Moreover, we note that
0
t
F
and t 0
b F
.Thus a higher encompassing interest of the ruler in private consumption and
consequently in the productivity of the private markets leads: (i) to lower level of tax rates and (ii) to higher share of tax revenues used to finance public production services relative to rents’ extraction. It is worth noted that higher tax rates do not necessarily induce higher tax revenues. This is because in this model national income (i.e., the tax base) apparently is endogenous to the implemented fiscal policy.
Our results are in line to those obtained by McGuire and Olson (1996). Rulers that are characterized by a lower encompassing interest in the welfare of the citizens -and consequently
in the productivity of the whole society- direct a lower share of the tax revenues to public production services and they impose higher tax rates. In contrast, governments that do care for the function of the private markets direct a larger amount of resources to public production
33 Using the conjecture V(k
27
services and extract less from the public funds. Following the rationale of Olson (1993) and McGuire and Olson (1996) autocracies are characterized by a lower encompassing interest in the function of the private markets. Therefore, autocracies direct a lower share of the tax revenues to public production services and extract more from the public funds for political economy purposes.
5. Conclusions
Our analysis examines the relationship between political institutions and fiscal redistribution for
a maximum of 144 developed and developing countries between 1960 and 2010. Backed by strong empirical findings, obtained from several different specifications and robustness checks, we suggest that dictatorial regimes redistribute more than democracies through taxes and cash transfers. Subsequently, our analysis provides some insights about this empirical finding. Focusing on the potential fiscal policy channels though which redistribution takes place, we conclude that democracies and dictatorships follow different patterns to redistribute income. More precisely, dictatorships redistribute income mostly through cash transfers, whereas democratic regimes rely more on public good services (e.g. health, education).