Regression
Sattarpoom Thaiparnit
aand Mahasak Ketcham
b,*
Department of Information Technology Management, King Mongkut's University of Technology North Bangkok, 1518 Pibulsongkram Road, Bangsue, Bangkok 10800, Thailand
E-mail: a[email protected], b[email protected] (Corresponding author)
Abstract. This paper proposes the chlorophyll prediction in Pathumthani1 rice based on the image processing technique. The algorithm is developed to analyse the colour in the image by separating the components from rice leaf and computing the average value of red, green, and blue colours (RGB colours). The relationship between the average value and the amount of the chlorophyll is measured by using the chlorophyll meter SPAD-502 with multiple linear regressions. The results showed that the average value of the RGB colours is highly correlated with the amount of the chlorophyll from the rice leaf. To evaluate the accuracy, the chlorophyll prediction has been tested with 60 different rice leaves and the accuracy of the proposed method is 96.12%.
Keywords: Chlorophyll prediction, image processing, regression analysis.
ENGINEERING JOURNAL Volume 21 Issue 3 Received 15 September 2016
Accepted 3 November 2016 Published 1 June 2017
1.
Introduction
1.1. The Relationship between Chlorophyll and Nitrogen
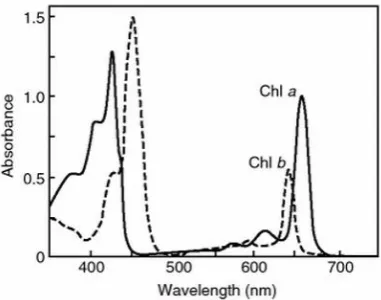
The green pigments found in plants is a result of the absorption of chlorophyll within the plant cells. Chlorophyll is responsible for photosynthesis process assimilated from sunlight to create synthetic substance and transfer from leaf to the other parts so as to make the plant growth [1]. The chlorophyll contains nitrogen element as an important component [2]. When the plant loses the nitrogen, the amount of the chlorophyll will be decreased, which causes the pale-yellow leaf called Chlorosis and affects the productivity of the plant. The nitrogen management, which affects the quality and quantity of the highest production, in rice cultivation occurs when the farmers know that the quantity of the nitrogen in all the stages during the rice growth by assessing the nitrogen from the leaf [3]. Rice is a plant that is sensitive to the change of the nitrogen content which expresses in the changing of the leaf colour [4]. Therefore, the change of the nitrogen content in the rice would affect both the chlorophyll and the leaf colour. Currently, the chlorophyll meter SPAD-502 is a well-known device that is used to determine the nitrogen content of the leaf. It is simple, fast, safe, and efficient in its operations [5]. The device can be used to determine the nitrogen content in many plants such as rice [6], grains [7], and potatoes [8]. Therefore, the chlorophyll meter is a tool that is used to obtain the chlorophyll content of the leaf without a leaf damaged. The chlorophyll meter takes the advantage of the absorption and the reflection principle of a different wavelength since a chlorophyll properties can absorb a wavelength between 420 to 460 nm and 630 to 660 nm and reflect a green wavelength. Figure 1 shows the absorption and reflection reaction of chlorophyll a and chlorophyll b [9].
Fig. 1. The Absorption and Reflection Reactions of the Chlorophyll.
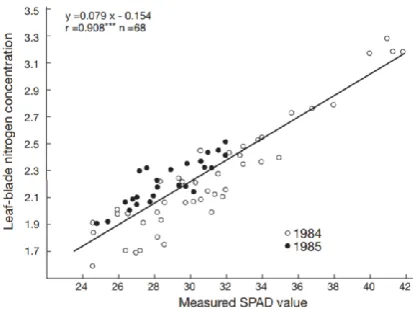
[image:2.595.201.392.367.517.2]Fig. 2. Correlation between SPAD value and Nitrogen concentration.
1.2. Regression Analysis
Regression Analysis is a statistical method used to determine the relationship between two or more quantitative variables to predict the value of one variable from other variables.Regression analysis is widely used in fields such as medicine, science, business, economic and social sciences [11]. For example, the regression analysis is used to predict the factors affecting the use of Information Technology in small and medium businesses [12]. Furthermore, regression analysis is used in predicting science and social science, as the Lifetime prediction of a metal sheet [13], the adsorption of Free Fatty Acid from Crude Palm Oil on Magnesium Silicate Derived from Rice Husk [14], the factors that influence satisfaction in the lives of the American people [15], and the size of the leaf in soybean [16]. There are two types of variables in the regression analysis; independent variables and the dependent variable. The dependent variable is the unknown variable that requires relationship equations and is the result of the demand forecast. Regression analysis between an independent variable and a dependent variable is called simple linear regression analysis. While the use of the chlorophyll meter is a reliable way to estimate the quantity of the nitrogen, the device is costly. Therefore, this method is not widely used in agriculture [17]. Digital image processing is another way that can be used to estimate the quantity of nitrogen content of the rice leaf. The study showed that the average green value (G) in the image is an inverse pattern with the amount of the chlorophyll measured by the chlorophyll meter (SPAD-502) [18]. In this paper, we focus on Pathumthani1 rice. We present the design of the image processing technique by selecting the rice leaf in the different areas and analysing the average red, green, and blue colours (RGB colours). Then the relationship between the average colour and the quantity of the chlorophyll is evaluated to create the model for the chlorophyll prediction. To capture the image, a webcam camera that has a resolution of 1.3 million pixels is used and installed inside the structure with a stable light control.
2.
Proposed Method
The relationship between the average value of RGB colours and the amount of the chlorophyll measured by using the SPAD-502 is conducted with the Pathumthani1 rice. This process is divided into two parts as follows;
The design of the image processing.
The analysis of the relationship between the average colour value and the amount of the chlorophyll, and the model for the chlorophyll prediction.
(A)The Design of the Image Processing
[image:3.595.193.400.80.235.2]histogram value of the average value of the colours of the captured image [19]. The threshold that defines more than one values is called Multiple Threshold. This type of the threshold is usually utilised when separating the component of the image from more than two parts [20]. In image segmentation, the system obtains the components of the image and the colours of the rice leaf are analysed to compute the average value of the RGB colours [21]. In this paper, the images are taken from the rice leaf by using the designated tool. The captured image has 1.3 million pixels. The light conditions are controlled for resolving the problem of the instability of the light. The tool used in image capture is shown in Fig. 3.
Fig. 3. (A) The Designated Device to Capture a Leaf; (B) The Installation a Web Camera in a Lab.
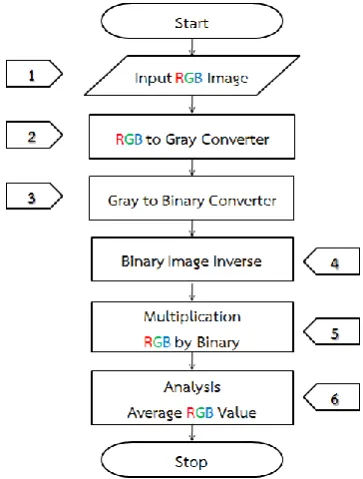
The image of the rice leaf is captured from the designated tool is processed to separate the elements of the leaf from the background [22]. It processes by adjusting the background colour to obtain a clear vision of different surfaces of the rice leaf [23], then separating the elements of the surface, and analysing its value. The algorithm for separating the surface of the leaf is shown in Fig. 4.
Fig. 4. Diagram of Image processing algorithm for paddy leaf chlorophyll using the colour model.
The process of the average value of the RGB colours is described below:
1) Input RGB Image
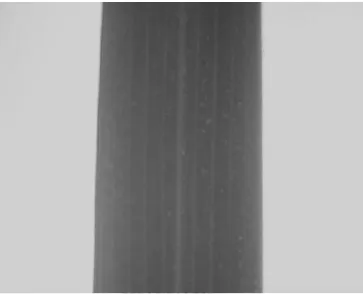
[image:4.595.163.433.178.280.2] [image:4.595.206.388.384.624.2]Fig. 5. The Rice Leaf Image Used in the Processing.
2) Convert RGB to Grayscale
The image that contains RGB colours is imported into the system, then converted the grayscale colour model by using conversion technique to calculate the average of the red green, and blue values as shown in Eq. (1) [24]. The result of the converted colour model is shown in Fig. 6.
( , ) ( , ) ( , ) ( , )
3
R x y G x y B x y
gray x y (1)
where R x y
, is the value of red of x, y coordinates in the two-dimensional space;
,G x y is the value of green of x, y coordinates in the two-dimensional space;
,B x y is the value of blue of x, y coordinates in the two-dimensional space.
Fig. 6. The Converted Grayscale Image.
3) Convert Grayscale to Binary Image
After converting to the grayscale image, the image is then converted into a binary image. The system converts the multi-colour that has the scale between 0 and 255 to a binary image that has only two values of which 0 represents black, and 255 represents white. These values are divided by the threshold (T) [25]. The conversion process and the result of black and white colour are shown in Eq. (2), and Fig. 7, respectively.
0 ( , )
( , )
255 ( , ) T
if F x y T
F x y
if F x y
(2)
[image:5.595.207.389.451.598.2]1
( , )
1 1
M N
F F x y
M N x y
(4)
21
, 1 1
M N
F x y F M N x y
(5)
And C is an optimal constant variable of the colour in the range of 5-10.
Fig. 7. The Example of Black and White Image.
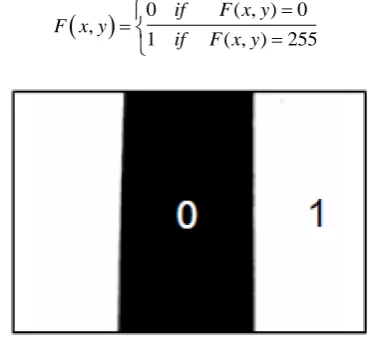
The next procedure is to adjust the value of the black and white of grayscale to the binary value. Let 255 equals to 1 in binary provided by Eq. (6). The values of the surface of the rice leaf and its background equal to 0 and 1, respectively. The result is shown in Fig. 8.
0 ( , ) 0,
1 ( , ) 255
if F x y
F x y
if F x y
(6)
Fig. 8. The Converted Binary Image.
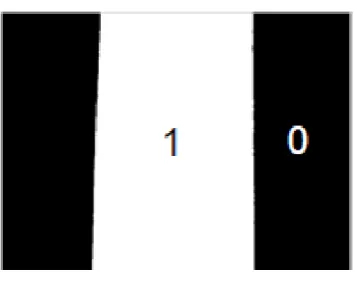
4) Inverse Binary Image
The binary image is then inverted by using an image enhancement provided by multiplication as shown in Eq. (7). The result of the inversion of the binary is shown in Fig. 9.
, 0 ( , ) 11 ( , ) 0
if F x y
F x y
if F x y
[image:6.595.208.387.168.299.2] [image:6.595.202.387.388.559.2]Fig. 9. The result of the Inversion of the Binary Image.
5) Multiplication of RGB Image with Image.
This procedure multiplies the original image to the black background and divides the image’s components explicitly. It adjusts the background colour of the original image to 0 by using multiplication as shown in Eq. (8). Figure 10 shows the result that combines the black background with the actual colour of the leaf.
_ ( , ) _ ( , ) _ ( , )
F Ojiginal x y F Original x y F Binary x y (8)
where F_Ojiginal x y( , ) is the original image;
_ ( , )
[image:7.595.214.392.76.218.2]F Binary x y is the binary image.
Fig. 10. Multiplication of Original and Binary images.
6) Analysis of the Average Value of RGB
This procedure presents an analysis of the RGB colours of the leaf image by averaging all values, including the red, green, and blue as shown in Eq. (9).
( , )
1 1
_
m n
F x y
x y
Average Colors
m n
(9)
where Average_Colors is the average red, green and blue value; ( , )
F x y is the red, green, and blue image in colour space.
(B)The Analysis of the Relationship between the Average Colour Value and the Amount of the Chlorophyll
The relationship between the average colour value and the amount of the chlorophyll can be derived by planting 40 pots of Patumthani1 rice. The nitrogen fertilisation is divided into four types, including 1 kg/1600m2, 4 kg/1600m2, 8 kg/1600m2, 12 kg/1600m2. The chlorophyll is measured by using the
[image:7.595.82.504.358.484.2]Fig. 11. The chlorophyll meter SPAD-502.
Fig. 12. Five points in measuring the rice leaf.
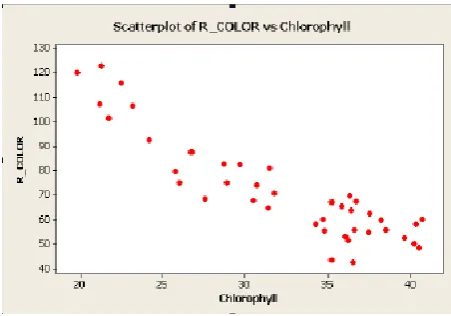
Then the 60 samples are randomly selected from the previous stage will be measured the chlorophyll by using the chlorophyll meter SPAD-502 and photography equipment. The value and chlorophyll from the 60 samples are obtained to analyse the correlation between the variables. The analysis of linear regression in [26] is applied to study the relationship. The distribution of the average value of the RGB colour and chlorophyll is shown in Figs. 13-15. The image result and the colour value are shown in Table 1.
[image:8.595.184.410.488.646.2]Fig. 14. Scatter Diagram of the Average of Green Colour and Chlorophyll.
Fig. 15. Scatter Diagram of the Average of the Blue Colour and Chlorophyll.
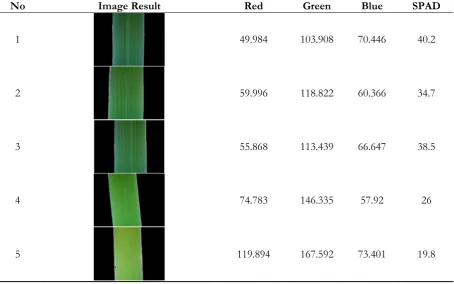
Table 1. The Image Result and Colour Value.
No Image Result Red Green Blue SPAD
1 49.984 103.908 70.446 40.2
2 59.996 118.822 60.366 34.7
3 55.868 113.439 66.647 38.5
4 74.783 146.335 57.92 26
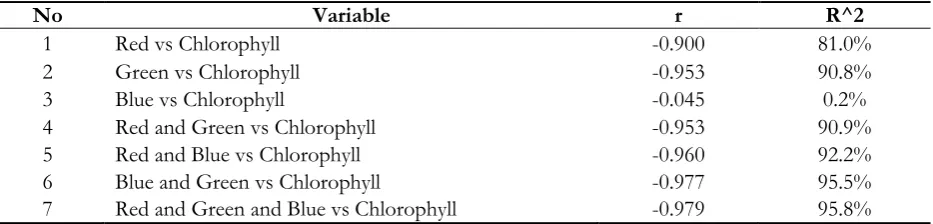
[image:9.595.73.528.489.773.2]The scatter diagram in Fig. 13 presents the distribution of the average of the red colour and chlorophyll, which indicates that the data are inversely correlated with each other; a high value of the colour will be consistent with the amount of chlorophyll at the low level. Then Fig. 14 shows the distribution of the average of the green colour and chlorophyll that are also inversely correlated with each other. However, The Blue colour does not correlate with the chlorophyll level as shown in a Fig. 15. When analysing the average value of the colours and chlorophyll with the linear regression, the average value of the three colours has a different relationship with the chlorophyll value. The percentage of correlation is demonstrated as the R^2 coefficient shown in Table 2.
Table 2. The Coefficient Determination of Variables: R^2.
No Variable r R^2
1 Red vs Chlorophyll -0.900 81.0%
2 Green vs Chlorophyll -0.953 90.8%
3 Blue vs Chlorophyll -0.045 0.2%
4 Red and Green vs Chlorophyll -0.953 90.9%
5 Red and Blue vs Chlorophyll -0.960 92.2%
6 Blue and Green vs Chlorophyll -0.977 95.5%
7 Red and Green and Blue vs Chlorophyll -0.979 95.8%
According to Table 2, the coefficients of the red, green, and blue are mostly correlated with the chlorophyll. Therefore, the linear regression model is created to predict the chlorophyll value by calculating the average of the red, green, and blue values. The linear model is shown in Eq. (10).
59.3 0.87 0.251 0.166
1 2 3
Chlorophyll x x x (10)
where x1 is the average red value; 2
x is the average green value; 3
x is the average blue value.
3.
Experimental Result
From the experiment, the amount of the chlorophyll tested with the random selection of the 60 leaves by using the chlorophyll meter. The error can be calculated from Eq. (11) and the accuracy can be calculated from Eq. (12). Table 3 shows the experimental result of the proposed model that can accurately measure the amount of chlorophyll at 96.12% and the average error is 3.88%.
%Error m t 100
t
(11)
%Accuracy 1 m t 100
t
(12)
where m is the measured value (from development device); t is the true value (from SPAD-502).
Table 3. The experimental result.
No Chlorophyll Real Chlorophyll Prediction %Accuracy % Error
1 34.4 34.68 99.19% 0.81%
2 34.7 32.63 93.67% 6.33%
3 32.2 29.10 89.38% 10.62%
... ... .... … ...
59 35.6 35.59 99.98% 0.02%
[image:10.595.67.534.215.327.2] [image:10.595.66.528.657.755.2]rice leaf and predict the amount of the nitrogen. We plan to further develop the model that evaluates the nutrient requirements of plants.
References
[1] M. Pessarakli, “Photosynthetic efficiency and crop yield,” in Handbook of Plant and Crop Physiology, 2nd ed. New York: Marcel Dekker, 2001, ch. 10, pp. 821-834.
[2] R. D. Slocum, R. Kaur-Sawhney, and A. W. Galson, “The physiology and biochemistry of polyamines in plants-arch,” Biochem. Biophys., pp. 283-303, 1984.
[3] M. Pagola, R. Ortiz, I. Irigoyen, H. Bustince, E. Barrenechea, P. Aparicio-Tejo, C. Lamsfus, and B. Lasa, “New method to assess barley nitrogen status based on image color analysis comparison with SPAD-502,” Comput. Electron. Agric., vol. 65, pp. 213-218, 2009.
[4] T. Mae and A. Makino, “Nitrogen utilization growth and yield in rice plant,” Research Signpost, pp. 243-253, 2010.
[5] F. Hassain, K. F. Broson, and Y. B. Singh, “Use of chlorophyll meter sufficiency indices for nitrogen management of irrigated rice in asia,” Journal of Agronomy, vol. 92, pp. 875-879, 2000.
[6] M. Esfahani, H. A. Abbasi, B. Rabiei, and M. Kavousi, “Improvement of nitrogen management in rice paddy fields using chlorophyll meter (SPAD),” Paddy and Water Environment, vol. 6, no. 2, pp. 181-188, 2008.
[7] L. M. Arregui, B. Lasa, A. Lafarge, I. Iraneta, E. Baroja, and M. Quemada, “Evaluation of chlorophyll meters as tools for N fertilization in winter wheat under humid Mediterranean conditions,” European Journal of Agronomy, vol. 24, no. 2, pp. 140-148, 2006.
[8] J. Wu, D. Wang, C. J. Rosen, and M. E. Bauer, “Comparison of petiole nitrate concentration, SPAD chlorophyll reading, and QuickBird satellite imagery in detecting nitrogen status of potato canopies,” Elsevier in Field Crop Research, vol. 101, no. 1, pp. 96-103, 2007.
[9] H. K. Lichtenthaler and C. Buschmann, “Chlorophylls and carotenoids: Measurement and characterization by UV-VIS spectroscopy,” Current Protocols in Food Analytical Chemistry, 2001. doi:10.1002/0471142913. faf0403s01
[10] J. Markwell, J. C. Osterman, and J. L. Mitchell, “Calibration of the Minolta SPAD-502 leaf chlorophyll meter,” Photosynthesis Research Journal, vol. 46, no. 3, pp. 467-472, 1995.
[11] B. Abraham and J. Ledolter, Introduction to Regression Modelling, 1st ed. Singapore: Thomson Corporation,
2006.
[12] M. Ghobakhloo, J. Benitez-Amado, and D. Arias-Aranda, “reasons for information technology adoption and sophistication within manufacturing SMEs,” Department of Management School of Economics and Business, University of Granada, Spain, 2011.
[13] C. Suvanjumrat and R. Rugsaj, “Lifetime estimation for metal sheet cladding and roofing in Wang-Noi combined cycle power plant,” Engineering Journal, vol. 20, no. 2, pp. 147-158, 2016. doi: 10.4186/ej.2016.20.2.147
[14] W. Clowutimon, P. Kitchaiya, and P. Assawasaengrat, “Adsorption of free fatty acid from crude palm oil on magnesium silicate derived from rice husk,” Engineering Journal, vol. 15, no. 3, pp. 15-25, 2011. doi: 10.4186/ej.2011.15.3.15
[15] E. Suh, E. Diener, S. Oishi, and H. C. Triandis, “The shifting basis of life satisfaction judgments across cultures: Emotions versus norms,” Journal of Personality and Social Psychology, vol. 74, no. 2, p. 482, 1998.
[17] D. Maiti, D. K. Das, T. Karak, and M. Banerjee, “Management of nitrogen though the use of leaf color chart (LCC) and soil plant analysis development (SPAD) or chlorophyll meter in rice under irrigated ecosystem,” The Scientific World, vol. 4, pp. 838-846, 2004.
[18] S. Thaiparnit and J. Srinonchat, “Apply image processing to determine the correlation of chlorophyll,” in IEEE 6th International Conference on Electrical Engineering/Electronic and Information Technology, 2009, pp.
1116-1119.
[19] J. Ashburner and K. J. Friston, Human Brain Function, 2nd ed. Elsevier, 2003, pp. 695-706.
[20] B. S. Chaabane, M. Sayadi, F. Fnaiech, and E. Brassart, “Color image segmentation using automatic thresholding and the fuzzy C-means techniques,” in IEEE 14th Mediterranean Electrotechnical Conference,
2008, pp. 857-861.
[21] A. Chowdhury, S. Cho, and U. Chong, “A background subtraction method using color information in the frame averaging process,” IEEE 6th International Forum on Strategic Technology, 22-24 Aug. 2011, pp.
1275-1279.
[22] P. C. Tay and H. Shen, “A novel background subtraction method to detect microcalcifications,” IEEE Southwest Symposium on Image Analysis and Interpretation, 2012, pp. 141-144.
[23] S. Yao, I. R. Khan, and F. Farbiz, “Clothing segmentation and recoloring using background subtraction and back projection method,” inIEEE 18th International Conference on Image Processing, 2011,
pp. 3137-3140.
[24] T. Kumar and K. Verma, “A theory based on conversion of RGB image to gray image,” Journal of Computer Applications, vol. 7, no. 2, pp. 7-10, 2010.
[25] A. Sanguannam and J. Srinonchat, “Analysis ball grid array defects by using new image technique,” in IEEE 9th International Conference on Signal Processing, 2008, pp. 785-788.