Open Access
Research article
An investigation of the effects of lipid-lowering medications:
genome-wide linkage analysis of lipids in the HyperGEN study
Jun Wu*
1, Michael A Province
1, Hilary Coon
2, Steven C Hunt
3,
John H Eckfeldt
4, Donna K Arnett
5, Gerardo Heiss
6, Cora E Lewis
7, R
Curtis Ellison
8, Dabeeru C Rao
9, Treva Rice
9and Aldi T Kraja
1Address: 1Division of Statistical Genomics, Washington University School of Medicine, Campus Box 8506, 4444 Forest Park Boulevard, Saint
Louis, MO63108, USA, 2Department of Psychiatry, University of Utah, Salt Lake City, UT, USA, 3Cardiovascular Genetics, University of Utah, Salt
Lake City, UT, USA, 4Department of Laboratory Medicine & Pathology, University of Minnesota, Minneapolis, MN, USA, 5University of Alabama
at Birmingham, Birmingham, AL, USA, 6Department of Epidemiology, University of North Carolina, Chapel Hill, NC, USA, 7Division of
Preventive Medicine, University of Alabama at Birmingham, Birmingham, AL, USA, 8Section of Preventive Medicine and Epidemiology, Boston
University School of Medicine, Boston, MA, USA and 9Division of Biostatistics, Washington University School of Medicine, Saint Louis, MO, USA
Email: Jun Wu* - [email protected]; Michael A Province - [email protected]; Hilary Coon - [email protected]; Steven C Hunt - [email protected]; John H Eckfeldt - [email protected]; Donna K Arnett - [email protected]; Gerardo Heiss - [email protected]; Cora E Lewis - [email protected]; R Curtis Ellison - [email protected];
Dabeeru C Rao - [email protected]; Treva Rice - [email protected]; Aldi T Kraja - [email protected] * Corresponding author
Abstract
Background: Use of anti-hyperlipidemic medications compromises genetic analysis because of
altered lipid profiles. We propose an empirical method to adjust lipid levels for medication effects so that the adjusted lipid values substitute the unmedicated lipid values in the genetic analysis.
Results: Published clinical trials were reviewed for HMG-CoA reductase inhibitors and fibric acid
derivatives as mono-drug therapy. HMG-CoA reductase inhibitors showed similar effects in African Americans (AA) and non-African Americans (non-AA) for lowering total cholesterol (TC, -50.7 mg/dl), LDL cholesterol (LDL-C, -48.1 mg/dl), and triglycerides (TG, -19.7 mg/dl). Their effect on increasing HDL cholesterol (HDL-C) in AA (+0.4 mg/dl) was lower than in Non-AA (+2.3 mg/dl). The effects of fibric acid derivatives were estimated as -46.1 mg/dl for TC, -40.1 mg/dl for LDL-C, and +5.9 mg/dl for HDL-C in non-AA. The corresponding effects in AA were less extreme (-20.1 mg/dl, -11.4 mg/dl, and +3.1 mg/dl). Similar effect for TG (59.0 mg/dl) was shown in AA and non-AA. The above estimated effects were applied to a multipoint variance components linkage analysis on the lipid levels in 2,403 Whites and 2,214 AA in the HyperGEN study. The familial effects did vary depending on whether the lipids were adjusted for medication use. For example, the heritabilities increased after medication adjustment for TC and LDL-C, but did not change significantly for HDL-C and TG.
Conclusion: Ethnicity-specific medication adjustments using our empirical method can be
employed in epidemiological and genetic analysis of lipids. Published: 10 September 2007
BMC Genetics 2007, 8:60 doi:10.1186/1471-2156-8-60
Received: 10 November 2006 Accepted: 10 September 2007 This article is available from: http://www.biomedcentral.com/1471-2156/8/60
© 2007 Wu et al; licensee BioMed Central Ltd.
This is an Open Access article distributed under the terms of the Creative Commons Attribution License (http://creativecommons.org/licenses/by/2.0), which permits unrestricted use, distribution, and reproduction in any medium, provided the original work is properly cited.
Background
There is extensive epidemiological evidence showing that a dyslipidemic profile, characterized by elevated plasma levels of total cholesterol (TC), triglycerides (TG) and LDL cholesterol (LDL-C), and reduced levels of HDL choles-terol (HDL-C), is strongly associated with an increased risk of atherosclerosis and coronary heart disease [1]. Genetic contributions to plasma lipid levels also have been documented, with the magnitude as assessed by her-itability being quite variable (26% to 83%) [2-4]. Simi-larly, genome scans from different populations have reported a variety of quantitative trait loci (QTLs) related to lipid profiles [5-13].
However, it is known that use of anti-hyperlipidemic medications by participants in such family studies distorts their blood lipid levels. Consequently, investigators may exclude subjects on medications during recruitment, or remove them at the time of the genetic analyses. Not only do such exclusions results in a smaller sample size, they also may discard the participants who are most likely to carry causative variants of dyslipidemia. To increase the power of the analysis by including these potentially informative subjects, some studies were designed to inter-rupt lipid lowering medication for specific time intervals before the blood samples were taken. Other methods that have been implemented are to adjust the lipid levels for medication by using medications as covariates in a linear regression model. This method tends to minimize the dif-ferences in lipid levels between medicated and unmedi-cated groups, but not necessarily adjust lipid levels toward their original values. To our knowledge, only one study has performed a genome-wide scan for LDL-C after increasing the measured levels by 25% for medicated sub-jects [13]. The lod score for their highest peak increased from 3.27, observed when analyzing 1977 white subjects not on lipid lowering medications, to 3.72 after including 350 medicated subjects.
The aim of the present study is to recover or impute the original unmedicated lipid levels using an empirical approach. The measured (biased) lipid values of individ-uals on lipid-lowering drugs are "adjusted" by increasing (or decreasing) the measured value by the same amount that clinical trials studies report decreases (or increases) for a given class of drugs using ethnic-specific data. That is, the approach statistically infers or projects what the origi-nal lipid value would have been prior to medication treat-ment. The impact of the medication adjustments will be evaluated by computing heritabilities and by conducting genome-wide linkage analyses in three samples: by excluding medicated subjects; by including medicated subjects after adjusting lipid values for medication use; and by including medicated subjects without any
medica-nal lipid measurement by adjusting for medication effects can provide more precise estimates of the medication-free values of the phenotypes, with an expected increase in power to detect genes involved in the lipid metabolism.
Methods
Subject description
The Hypertension Genetic Epidemiology Network (HyperGEN) study is part of the National Heart, Lung and Blood Institute (NHLBI) Family Blood Pressure Program. The design and methods have been described in detail elsewhere [14]. In the present report 2,403 White and 2,214 African American participants represent 1,924 pairs of White hypertensive siblings in 1,242 nuclear families and 1,889 pairs of African American hypertensive siblings in 1,801 nuclear families. Among all participants with measured serum lipid levels, 402 subjects reported that they were taking medications to lower blood lipid levels. This included 385 subjects taking one medication, 16 sub-jects on combination drug therapy of two medications, and 1 subject reporting the use of three drugs. IRB approv-als were obtained for all participating centers, and all par-ticipants gave their written informed consent.
Measurement of Lipids and Other Phenotypes
All blood assays on samples were performed at the Central Biochemistry Laboratory at the University of Minnesota. TG levels were colorimetrically determined by using a per-oxidase-coupled method on a centrifugal analyzer [15]. TC was measured by using a commercial cholesterol oxi-dase method [16]. LDL-C was estimated by the Friedewald equation [17], or by ultracentrifugation for subjects with TG above 400 mg/dl [18]. HDL-C was quantified by COBAS FARA (Roche Diagnostic Systems) after precipita-tion of the other lipoprotein fracprecipita-tions by dextran sulfate [19].
Anthropometric measurements were collected with sub-jects wearing lightweight suits. Body mass index (BMI) was subsequently calculated as weight in kilograms divided by height in meters squared. Waist circumference was measured to the nearest centimeter at the level of the umbilicus, and hip circumference was measured at the level of the maximal circumference of the gluteus. All other measurements were collected using a common, standardized protocol administered by trained personnel. Genotyping
The NHLBI Mammalian Genotyping Service (Marshfield, Wisconsin) genotyped 391 markers at approximate 10-cM intervals throughout the genome, with an average marker heterozygosity of 76%. Detailed information on the gen-otyping methods, instruments, and software used can be found at the Marshfield Laboratory World Wide Web site
in the pedigrees were carried out at the HyperGEN Data Coordinating Center at Washington University in Saint Louis, by using ASPEX [21], GRR [22], MAPMAKER/SIBS [23], and PEDCHECK [24].
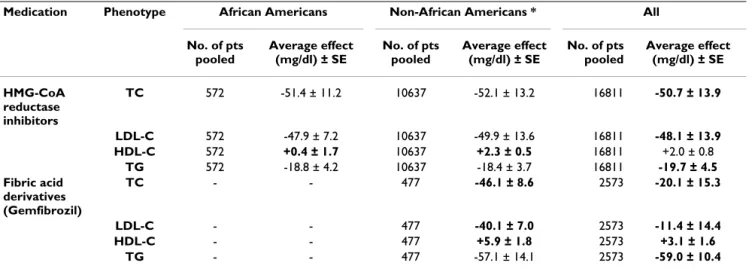
Adjustment for the effects of lipid-lowering medications The majority of the participants in the HyperGEN study, that were using anti-hyperlipidemic medications, were prescribed two groups of medications: HMG-CoA reduct-ase inhibitors (statins) and/or fibric acid derivatives (Table 1). Therefore, we only focused on lipid-lowering effects of these two groups of medications. Clinical trials on the long-term effects of mono-drug therapy using these anti-hyperlipidemic medications published in English during 1989–2003 were searched online through PubMed. The search terms used included lipids, efficacy, mono-drug therapy, combination drug therapy, as well as the names of medication classes. We excluded clinical tri-als with duration of less than 8 weeks and those without placebo control. Clinical trials for medication combina-tions were also excluded unless they reported the data for mono-drug therapy as well. Tables A1 and A2 in Appendix A [see Additional File 1] summarize 32 clinical trials that have investigated the effects of HMG-CoA inhibitors and fibric acid derivatives as mono-drug therapy with com-monly used dosages. A total of 19,384 participants, aged 18 to 80 years, with high blood lipid levels were pooled. The clinical trials were double-blinded, randomized with a course which varied from 8 to 280 weeks. Gemfibrozil was the only fibric acid derivative used by the subjects in the HyperGEN study; this medication was well repre-sented in non-African Americans of the HyperGEN, but only two African Americans used the drug (Table 1). Therefore we reviewed only the clinical trials for the effects of this medication in non-African Americans (see Addi-tional File 1 Table A2).
The weighted (by sample size) average absolute change for each lipid variables, which took into account placebo effect, was calculated by medication groups based on
eth-nicity (African Americans vs. non-African Americans, and vs. all ethnicities) (Table 2). Each phenotype of lipids responded to different classes of drugs differently, and the response also varied considerably by ethnicity. Non-Afri-can AmeriNon-Afri-cans included mainly Whites and Hispanics. The clinical trials for all ethnicities include more trials, because some studies had samples that could not be cate-gorized into either African Americans or non-African Americans. HMG-CoA inhibitors showed similar reduc-tions of TC, LDL-C and TG in African Americans and nonAfrican Americans. Thus, the following effect estimates, -50.7 mg/dl, -48.1 mg/dl, and -19.7 mg/dl, were used for all ethnicities in performing the adjustments, respectively. However, non-African Americans appeared to be more responsive than African Americans to HMG-CoA inhibi-tors effecting HDL-C. The ethnicity specific average effects (+2.3 mg/dl for non-African Americans and +0.4 mg/dl for African Americans) were used to obtain the adjusted HDL-C. Gemfibrozil appeared to be more effective as an anti-hyperlipidemic agent for TC, LDL-C, and HDL-C in non-African Americans than in populations with all pooled ethnicities. For non-African Americans subjects receiving Gemfibrozil, the measured levels of TC, LDL-C, and HDL-C were adjusted by the following respective esti-mates: -46.1 mg/dl, -40.1 mg/dl, and +5.9 mg/dl. Instead, the measured lipid levels of two African Americans who took Gemfibrozil were adjusted by the effect for all ethnic-ities: -20.1 mg/dl for TC, -11.4 mg/dl for LDL-C, and + 3.1 mg/dl for HDL-C. Both African Americans and non-Afri-can Amerinon-Afri-cans were adjusted by -59.0 mg/dl for TG. For the participants receiving mono-drug therapy of anti-hyperlipidemics, the levels of TC, HDL-C, LDL-C, and TG were adjusted with the effect estimates, where the sign (+/ -) indicates the increasing or lowering effect of a medica-tion to a specific lipid component. When an individual took a combination therapy of two drugs, the total effect was estimated by selecting the medication with higher effect on the lipids and conservatively adding up half effect of the other medication. Unadjusted measurements Table 1: Mechanisms of action for the major groups of antihyperlipidemic medications and their frequency of use by the subjects in HyperGEN
Medication group Mechanism Frequency of use
African Americans
Caucasians
Bile sequestrants A partial removal of bile acids from the enterohepatic circulation by preventing their absorption
1 12
Fibric acid derivatives Increasing fatty acid oxidation to decrease formation of VLDL (very low density lipoprotein) triglycerides
2 39
HMG CoA reductase inhibitors Inhibiting HMG CoA reductase, the rate-limiting step in cholesterol biosynthesis
101 264
were used for 12 African Americans and 2 Whites who took Bile Sequestrants or Nicotinic Acid Derivatives. The third medication effect, which was presented for only one participant, was not considered in our study.
Statistical Methods and Linkage Analysis
TG with and without medication adjustments were trans-formed using natural logarithm to an approximate nor-mal distribution. Each phenotype was then adjusted for its mean and variance to remove the effects of age as well as the effects of BMI, current smoking and drinking status, the use of estrogen replacement therapy, diabetes status, and the field center. Stepwise multiple regressions were performed for the adjustment within each ethnicity and sex group, retaining only the terms significant at the 5% level. The adjusted variables were finally standardized to a mean of 0 and a standard deviation (SD) of 1. Four to ten outliers greater than 4 SD-s from the mean and at least 1 SD from the nearest data point were excluded within each ethnic group for the lipid phenotypes.
Heritability (h2), defined as the percent of variance due to
additive familial effects, was estimated through the maxi-mum-likelihood methods available in the software SEG-PATH under the most parsimonious model using the following equation [25]:
where rparent-offspring, rsibling, and rspouse denote the average parent-offspring, the average sibling and the spouse corre-lations, respectively. Two heritability estimates were
difference was greater than the sum of their standard errors.
Genome-wide linkage analyses, both with and without adjustments for medication effects, were performed for each lipid phenotype by using variance component link-age analysis as implemented in SEGPATH [26]. Linklink-age analysis was carried out separately within ethnicity by using ethnicity-specific marker allele frequencies derived from the corresponding random sub-samples. Multipoint IBD estimates were used in the linkage analysis.
Results
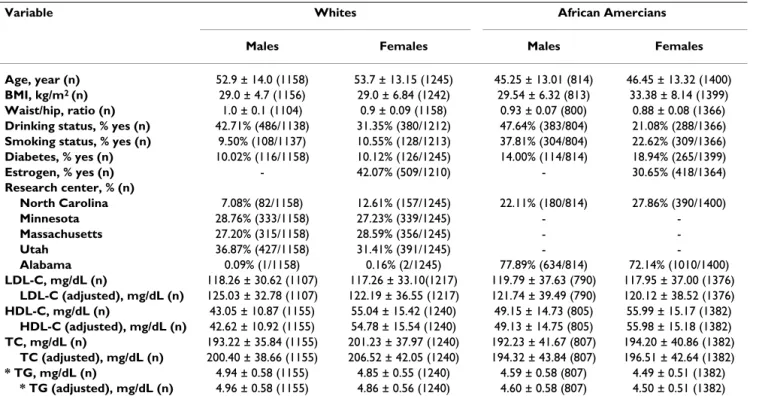
Table 3 presents the selected characteristics of participants in the HyperGEN study by ethnic group and gender, and the effects of adjustment for medication for each lipid parameter. The average age was approximately 53 years in Whites and 46 years in African Americans. African Ameri-can females had higher levels of BMI than the other groups. Alcohol consumption, smoking status, diabetes, estrogen use, and field center also showed significant eth-nic differences. When lipid levels in subjects on lipid-low-ering medications were adjusted for medication effects, there were observable elevations in the mean of TC and LDL-C, but very slight changes in the mean of HDL-C and in the log transformed TG.
The effects of medication adjustments on the heritabilities of lipids are summarized in Table 4. Three groups of data were analyzed: 1) Excluding medicated participants; 2) All participants without any adjustment for medication effects; 3) All participants with adjustment for medication effects. Compared to the estimates without medication
h r r r r r
parent offspring sibling spouse spouse spou 2 1 1 2 = + + + + − ( )( )
sse parent offspringr −
Table 2: Average effects estimated from published clinical trails by ethnicity for HMG-CoA reductase inhibitors and fibric acid derivatives
Medication Phenotype African Americans Non-African Americans * All
No. of pts pooled Average effect (mg/dl) ± SE No. of pts pooled Average effect (mg/dl) ± SE No. of pts pooled Average effect (mg/dl) ± SE HMG-CoA reductase inhibitors TC 572 -51.4 ± 11.2 10637 -52.1 ± 13.2 16811 -50.7 ± 13.9 LDL-C 572 -47.9 ± 7.2 10637 -49.9 ± 13.6 16811 -48.1 ± 13.9 HDL-C 572 +0.4 ± 1.7 10637 +2.3 ± 0.5 16811 +2.0 ± 0.8 TG 572 -18.8 ± 4.2 10637 -18.4 ± 3.7 16811 -19.7 ± 4.5 Fibric acid derivatives (Gemfibrozil) TC - - 477 -46.1 ± 8.6 2573 -20.1 ± 15.3 LDL-C - - 477 -40.1 ± 7.0 2573 -11.4 ± 14.4 HDL-C - - 477 +5.9 ± 1.8 2573 +3.1 ± 1.6 TG - - 477 -57.1 ± 14.1 2573 -59.0 ± 10.4
* Non-African Americans mainly include Whites, Hispanic.
Table 3: Characteristics of subjects by ethnicity and sex in the HyperGEN study
Variable Whites African Amercians
Males Females Males Females
Age, year (n) 52.9 ± 14.0 (1158) 53.7 ± 13.15 (1245) 45.25 ± 13.01 (814) 46.45 ± 13.32 (1400)
BMI, kg/m2 (n) 29.0 ± 4.7 (1156) 29.0 ± 6.84 (1242) 29.54 ± 6.32 (813) 33.38 ± 8.14 (1399)
Waist/hip, ratio (n) 1.0 ± 0.1 (1104) 0.9 ± 0.09 (1158) 0.93 ± 0.07 (800) 0.88 ± 0.08 (1366)
Drinking status, % yes (n) 42.71% (486/1138) 31.35% (380/1212) 47.64% (383/804) 21.08% (288/1366)
Smoking status, % yes (n) 9.50% (108/1137) 10.55% (128/1213) 37.81% (304/804) 22.62% (309/1366)
Diabetes, % yes (n) 10.02% (116/1158) 10.12% (126/1245) 14.00% (114/814) 18.94% (265/1399) Estrogen, % yes (n) - 42.07% (509/1210) - 30.65% (418/1364) Research center, % (n) North Carolina 7.08% (82/1158) 12.61% (157/1245) 22.11% (180/814) 27.86% (390/1400) Minnesota 28.76% (333/1158) 27.23% (339/1245) - -Massachusetts 27.20% (315/1158) 28.59% (356/1245) - -Utah 36.87% (427/1158) 31.41% (391/1245) - -Alabama 0.09% (1/1158) 0.16% (2/1245) 77.89% (634/814) 72.14% (1010/1400) LDL-C, mg/dL (n) 118.26 ± 30.62 (1107) 117.26 ± 33.10(1217) 119.79 ± 37.63 (790) 117.95 ± 37.00 (1376) LDL-C (adjusted), mg/dL (n) 125.03 ± 32.78 (1107) 122.19 ± 36.55 (1217) 121.74 ± 39.49 (790) 120.12 ± 38.52 (1376) HDL-C, mg/dL (n) 43.05 ± 10.87 (1155) 55.04 ± 15.42 (1240) 49.15 ± 14.73 (805) 55.99 ± 15.17 (1382) HDL-C (adjusted), mg/dL (n) 42.62 ± 10.92 (1155) 54.78 ± 15.54 (1240) 49.13 ± 14.75 (805) 55.98 ± 15.18 (1382) TC, mg/dL (n) 193.22 ± 35.84 (1155) 201.23 ± 37.97 (1240) 192.23 ± 41.67 (807) 194.20 ± 40.86 (1382) TC (adjusted), mg/dL (n) 200.40 ± 38.66 (1155) 206.52 ± 42.05 (1240) 194.32 ± 43.84 (807) 196.51 ± 42.64 (1382) * TG, mg/dL (n) 4.94 ± 0.58 (1155) 4.85 ± 0.55 (1240) 4.59 ± 0.58 (807) 4.49 ± 0.51 (1382) * TG (adjusted), mg/dL (n) 4.96 ± 0.58 (1155) 4.86 ± 0.56 (1240) 4.60 ± 0.58 (807) 4.50 ± 0.51 (1382)
BMI = Body Mass Index; TC = Total Cholesterol; HDL-C = High Density Lipoprotein Cholesterol; LDL-C = Low Density Lipoprotein Cholesterol; TG = Triglycerides.
Table 4: The effect of medication correction on heritability of lipids: the HyperGEN study
Phenotype Excluding medicated subjects Including medicated subjects
N Heritability SE N Unadjusted with
medications Adjusted with medications Significance Heritability SE Heritability SE African Americans TC 2088 0.57 0.07 2184 0.49 0.06 0.59 0.06 * HDL-C 2080 0.30 0.05 2177 0.28 0.05 0.29 0.05 LDL-C 2067 0.65 0.07 2162 0.55 0.06 0.69 0.07 * TG 2088 0.50 0.05 2183 0.48 0.06 0.50 0.05 Whites TC 2092 0.52 0.06 2391 0.36 0.04 0.51 0.05 * HDL-C 2086 0.47 0.06 2385 0.50 0.05 0.48 0.05 LDL-C 2034 0.53 0.06 2319 0.37 0.04 0.47 0.05 * TG 2104 0.44 0.06 2390 0.32 0.04 0.34 0.04
* The estimates of heritability are significantly different with and without medication adjustment.
BMI = Body Mass Index; TC = Total Cholesterol; HDL-C = High Density Lipoprotein Cholesterol; LDL-C = Low Density Lipoprotein Cholesterol; TG = Triglycerides.
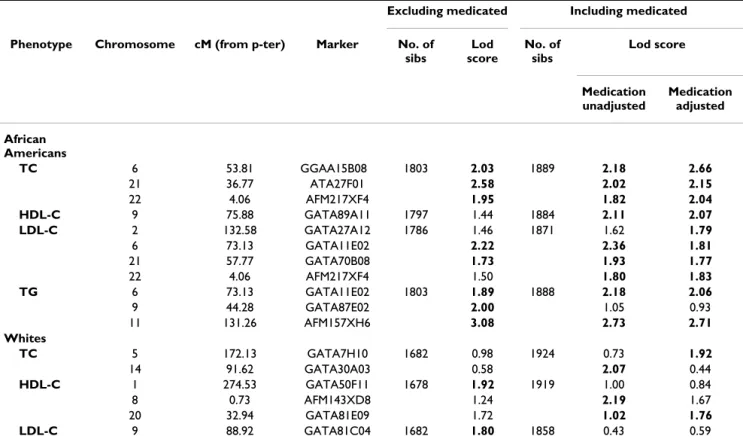
cantly by 20% and 25% for TC and LDL-C, respectively, when medication adjustments were applied. In African Americans this significant improvement was 36% for TC and 27% for LDL-C. By contrast, the heritability estimates after medication adjustments for HDL-C and TG stayed similar in both races. The heritability estimates for the adjusted lipid levels were similar to those when excluding medicated participants, suggesting that the medication adjustment may recover the phenotypic correlations within pedigrees previously obscured by medication. A lod score of 1.75 (P < 0.0023) was set a priori as the threshold for promising linkages, which previously was shown to reduce the risk of type II errors to one false pos-itive per genome scan (based on the assumption of dis-crete marker density with approximately 400 markers) [27]. Accordingly, all promising lod scores from the multipoint variance components linkage analysis for three samples, are presented in Table 5. Genome scan results of the four lipid traits for three groups of data are depicted in Figures A1-4 [see Additional File 1 Appendix A]. The strongest linkage signal (lod score = 3.08) was obtained for TG in African Americans excluding medi-cated subjects. This was localized at 131 cM from p-tel-omere (pter) on chromosome 11 (near marker
AFM157XH6). The lod score dropped to 2.73 when med-icated subjects were included without adjustment, and dropped to 2.71 when data were adjusted for the use of lipid-lowering medications. In contrast, the peak for TC on chromosome 6 at the region 53.81 cM p-ter (near marker GGAA15B08) increased in African Americans from 2.18 to 2.66 after the medication adjustment.
Discussion
The purpose of this study was to propose and explore a method to adjust blood lipid measurements for the effects of anti-hyperlipidemic medications. To our knowledge, our empirical approach to adjust medication effects on lipids has not been applied before in the genetic epidemi-ology studies, although examples of other complex traits exist. Several approaches have been attempted to adjust blood pressure for the use of antihypertensive medica-tions. We reported a similar empirical method to adjust blood pressure based on a summary of over 160 clinical trials on effects of anti-hypertensive medication [28]. A nonparametric algorithm by ranking (the adjusted) blood pressure was implemented by Levy et al. in the Framing-ham Heart Study [29]. Hunt et al. compared three meth-ods, including the use of a threshold method assigning a fixed blood pressure (140/90 mm Hg) for all medicated Table 5: Genome scan results (lod score ≥ 1.75) for lipids with and without medication correction by ethnicity: the HyperGEN study
Excluding medicated Including medicated
Phenotype Chromosome cM (from p-ter) Marker No. of
sibs Lod score No. of sibs Lod score Medication unadjusted Medication adjusted African Americans TC 6 53.81 GGAA15B08 1803 2.03 1889 2.18 2.66 21 36.77 ATA27F01 2.58 2.02 2.15 22 4.06 AFM217XF4 1.95 1.82 2.04 HDL-C 9 75.88 GATA89A11 1797 1.44 1884 2.11 2.07 LDL-C 2 132.58 GATA27A12 1786 1.46 1871 1.62 1.79 6 73.13 GATA11E02 2.22 2.36 1.81 21 57.77 GATA70B08 1.73 1.93 1.77 22 4.06 AFM217XF4 1.50 1.80 1.83 TG 6 73.13 GATA11E02 1803 1.89 1888 2.18 2.06 9 44.28 GATA87E02 2.00 1.05 0.93 11 131.26 AFM157XH6 3.08 2.73 2.71 Whites TC 5 172.13 GATA7H10 1682 0.98 1924 0.73 1.92 14 91.62 GATA30A03 0.58 2.07 0.44 HDL-C 1 274.53 GATA50F11 1678 1.92 1919 1.00 0.84 8 0.73 AFM143XD8 1.24 2.19 1.67 20 32.94 GATA81E09 1.72 1.02 1.76 LDL-C 9 88.92 GATA81C04 1682 1.80 1858 0.43 0.59
participants, and a random assignment of systolic blood pressure between 140–160, and a random assignment of diastolic blood pressure between 90–100 mm Hg [30]. The investigators concluded that excluding medicated measurements or the use of unadjusted blood pressure both lowered lod score results as compared to adjusting blood pressure measurements. Cui et al. examined the adjustment effects by adding an arbitrary 10 mm Hg and 5 mm Hg to systolic and diastolic blood pressures respec-tively, according to a publication on clinical trials [31,32]. The adjusted blood pressure resulted in an increase of both genetic and shared environmental variance compo-nents, while the unadjusted blood pressure for antihyper-tensive treatments obscured the relationship among phenotypes and genotypes.
The heritabilities of lipids, estimated in our study by excluding all the participants who took lipid-lowering medications, should be less biased heritabilities. How-ever, by excluding subjects there is a smaller sample size and some valuable genetic information may be lost, espe-cially alleles of the subjects affected more by dyslipidemia. Including medicated participants would introduce bias, because of a confounding of the medication effects with the lipid levels. That is, the measured lipid levels are arti-ficial. This could cause a reduction in the genetic variance component as was seen for TC and LDL-C when we used the whole sample without performing medication adjust-ments. Heritabilities for TC and LDL-C were significantly improved after medication adjustments to the similar level as those obtained when excluding the medicated subjects. This indicates that the adjustment with our empirical method recovered relationships among pheno-types and genopheno-types obscured by the use of medications. Therefore, our method can provide the benefit of a greater power in genetic analysis by increasing the sample size as well as the information content.
The lod score for the TC peak in African Americans, cen-tered at 53.81 cM on chromosome 6, increased from 2.03 to 2.66 when the medication adjustments were applied. This linkage signal is about 25 cM from a suggestive signal which was reported in a bivariate analysis of TG and LDL-C (LOD = 2.0) from 1,747 African American siblings in the Hypertension Genetic Epidemiology Network study [33]. Another study provided evidence of linkage (LOD = 2.14) at 102 cM on chromosome 6 for combined hyperli-pidemia of TC and TG in 113 Caucasian families [5]. In contrast, the peak with a lod score of 3.08 dropped slightly to 2.71 when including those measures with med-ication adjustments for TG in African Americans on chro-mosome 11 at 131 cM from p-ter. This peak replicates a suggestive signal (LOD = 1.93) detected in French Canadi-ans [6], and 30 cM from the region (LOD = 3.34) that have previously been identified in Turkish families [34].
We performed meta-analysis across African American and Caucasian families but there was no improvement in the LOD scores (results not shown).
Blood lipid levels are the result of a complex interaction among genetic and various environmental factors. The power of genome scans for detecting true signals is gener-ally low with small-to-modest effect for complex traits like blood lipids. In addition, lipid-lowering treatment repre-sents a pharmacologically induced alteration – typically of large magnitude – of the plasma lipid levels which further reduces the power to detect the true signals. One of the methods to overcome the confounding of medication effects with the measured lipid levels is to adjust the meas-ured blood lipids by trying to recover the untreated levels as closely as possible. Although we noticed that the lod scores of blood lipids went both ways before and after medication adjustment in the present study, we expect lod scores for the medication adjusted analysis to be closest to their optimal (true) estimates. To evaluate our empirical approach of adjusting the treated lipid phenotypes, the heritability is a more appropriate parameter, since it reflects the effect size in linkage analysis. The higher herit-abilities for TC and LDL-C when medication adjustments were made in the present study indicate an improvement in effect size of the linkage analysis with this empirical method. This is consistent with what is known about the HMG-CoA reductase inhibitors. First, as shown in Table 1 most of the medicated participants in the HyperGEN study took HMG-CoA reductase inhibitors and the effects is strongest on LDL-C and TC as shown in Table 3. Second, these inhibitors primarily target LDL-C (and by extension TC). For example, Table 2 shows larger mean and variance effects due to medication use for LDL-C and TC in the clinical trials literature.
Although our study has accounted for all participants and adjusted lipid measurements for aggregate medication effects, nevertheless there are limitations in the present study. The effects of anti-hyperlipidemics were estimated as group means rather than as individual responses to the medications, which are notoriously dose-dependent. Instead of producing precise untreated phenotype meas-urements, an adjustment with the average effects of med-ications may further serve as a shift by a constant and obscure the association between the phenotype and geno-type. Also, we focused only on two groups of lipid-lower-ing medications, i.e., the most commonly used by subjects in the HyperGEN study. Under different circumstances an overall weighted average effect of other groups of anti-hyperlipidemic medications could be used. Another issue is that the present study did not ascertain the effect of the different patient groups which may influence antihyperli-pidemic responses. Although dose-specific effects should be estimated when the information is available, the doses
used in each of the source clinical trials were pooled to estimate the general efficacy for each group of medica-tions because we do not have all the desired data in the HyperGEN study, such as dosage of anti-hyperlipidemics used by subjects. Similarly, we had to assume that the medicated subjects in the HyperGEN study had been pre-scribed, and were adhering, to the most commonly rec-ommended doses. However, various strategies have been implemented to improve the compliance significantly during the clinical trials. The efficacy estimated from clin-ical trials is likely to overestimate the results observed in a general population of hyperlipidemic individuals under the treatment, such as in the HyperGEN study. Therefore, applying those estimates of drug effects would tend to over adjust the lipid values for studies using general pop-ulations.
Conclusion
In conclusion, this study provides a summary of a large number of clinical trials on the average effects of anti-hyperlipidemic medications on the actual lipid pheno-types, and an empirical method to adjust measured lipids for such medication effects. An illustrative example of how to apply this methodology is presented for the HyperGEN data. The medication adjustments using this method resulted in an improvement in the heritability estimates for TC, LDL-C, and TG. Genome scans with the imputed lipid measurements revealed some promising regions, such as a QTL with a peak lod score 2.66 at 53.81 cM from p-ter on chromosome 6 for TC and a region with lod score of 2.71 centered at 131 cM on chromosome 11 for TG in African Americans. The method described and the medication-use adjustments derived from a large body of clinical trials can be employed in other epidemiologic and genetic studies to obtain more accurate estimates of the lipid measurements as well to preserve the power of the study.
Authors' contributions
All authors contributed equally. All authors read and approved the final manuscript.
Additional material
Acknowledgements
We are thankful to the study participants and the Primary Centers and Investigators of HyperGEN:
University of Utah (Network Coordinating Center, Field Center, and Molecular Genetics Lab): Steven C. Hunt, Ph.D. (Network Director and Field Center P.I.); Mark F. Leppert, Ph.D. (Molecular Genetics P.I.); Jean-Marc Lalouel, M.D., D.Sc; Robert B. Weiss, Ph.D.; Roger R. Williams, M.D. (late); Janet Hood.
Boston University (Field Center): Richard H. Myers, Ph.D. (P.I.); R. Curtis Ellison, M.D.; Yuqing Zhang, M.D.; Jemma B. Wilk, D.Sc.; Luc Djoussé, M.D., D.Sc.; Greta Lee Splansky, M.S.
University of Alabama (Field Center): Cora E. Lewis, M.D., M.S.P.H. (P.I.); Albert Oberman, M.D., M.P.H.; Donna K. Arnett, Ph.D.; Phillip Johnson; Christie Oden.
University of Minnesota (Field Center and Biochemistry Lab): James S. Pan-kow, Ph.D. (Field Center P.I.); Michael B. Miller, Ph.D.; Michael Li, Ph.D.; John H. Eckfeldt, M.D., Ph.D.; Anthony A. Killeen, M.D., Ph.D.; Catherine Leiendecker-Foster, M.S.; Jean Bucksa; Greg Rynders.
University of North Carolina (Field Center): Kari E. North, Ph.D. (P.I); Barry I. Freedman, M.D.; Gerardo Heiss, M.D., Ph.D.
Washington University (Data Coordinating Center): D.C. Rao, Ph.D. (P.I.); Michael A. Province, Ph.D.; Aldi T. Kraja, Ph.D.; Ingrid B. Borecki, Ph.D.; Charles Gu, Ph.D.; Treva Rice, Ph.D; Ping An, M.D; Jun Wu, M.D.; Karen L. Schwander, M.S.; Derek Morgan; Stephen Mandel; Shiping Wang M.S.; Mat-thew Brown.
National Heart, Lung and Blood Institute: Susan E. Old, Ph.D.; Cashell Jaquish, Ph.D.; Dina Paltoo, Ph.D.
This hypertension network is funded by cooperative agreements (U10) with NHLBI: HL54471, HL54472, HL54473, HL54495, HL54496, HL54497, HL54509, HL54515.
References
1. National Heart, Lung and Blood Institute: National Institure of Health. Third report of the National Cholesterol Education Program (NCEP) Expert Panel on detection, and treatment of high blood cholesterol in adults (Adult Treatment Panel III). NIH Publication No. 02-5215, September 2002. . 2. Rao DC, Laskarzewski PM, Morrison JA, Khoury P, Kelly K, Wette R,
Additional file 1
Appendix A and Appendix B. Appendix A includes Table A1 and A2 show-ing the detailed results from individual clinical trials for HMG-CoA Inhibitors and Fibric Acid Derivatives as mono-drug therapy, along with Figure A1-A4 for multipoint genome scan results of lipids in HyperGEN based on SEGPATH software. Appendix A may also be found on the fol-lowing website: http://www.biostat.wustl.edu/hypergen/results.html. Appendix B lists the citations for all clinical trials summarized in Table A1 and A2.
Click here for file
[http://www.biomedcentral.com/content/supplementary/1471-2156-8-60-S1.pdf]
Publish with BioMed Central and every scientist can read your work free of charge "BioMed Central will be the most significant development for disseminating the results of biomedical researc h in our lifetime."
Sir Paul Nurse, Cancer Research UK Your research papers will be:
available free of charge to the entire biomedical community peer reviewed and published immediately upon acceptance cited in PubMed and archived on PubMed Central yours — you keep the copyright
Submit your manuscript here:
http://www.biomedcentral.com/info/publishing_adv.asp
BioMedcentral lipoprotein concentrations. Am J Hum Genet 1982,
34(6):888-903.
3. Hunt SC, Hasstedt SJ, Kuida H, Stults BM, Hopkins PN, Williams RR: Genetic heritability and common environmental compo-nents of resting and stressed blood pressures, lipids, and body mass index in Utah pedigrees and twins. Am J Epidemiol 1989, 129:625-38.
4. Perusse L, Rice T, Despres JP, Bergeron J, Province MA, Gagnon J, Leon AS, Rao DC, Skinner JS, Wilmore JH, et al.: Familial resem-blance of plasma lipids, lipoproteins and postheparin lipopro-tein and hepatic lipases in the HERITAGE Family Study.
Arterioscler Thromb Vasc Biol 1997, 17:3263-9.
5. Naoumova RP, Bonney SA, Eichenbaum-Voline S, Patel HN, Jones B, Jones EL, Amey J, Colilla S, Neuwirth CK, Allotey R, Seed M, Bet-teridge DJ, Galton DJ, Cox NJ, Bell GI, Scott J, Shoulders CC: Con-firmed locus on chromosome 11p and candidate loci on 6q and 8p for the triglyceride and cholesterol traits of combined hyperlipidemia. Arterioscler Thromb Vasc Biol 2003, 23:2070-7. 6. Bosse Y, Chagnon YC, Despres JP, Rice T, Rao DC, Bouchard C,
Perusse L, Vohl MC: Genome-wide linkage scan reveals multi-ple susceptibility loci influencing lipid and lipoprotein levels in the Quebec Family Study. J Lipid Res 2004, 45:419-26. 7. Newman DL, Abney M, Dytch H, Parry R, McPeek MS, Ober C:
Major loci influencing serum triglyceride levels on 2q14 and 9p21 localized by homozygosity-by-descent mapping in a large Hutterite pedigree. Hum Mol Genet 2003, 12(2):137-44. 8. Coon H, Leppert MF, Eckfeldt JH, Oberman , Myers RH, Peacock JM,
Province MA, Hopkins PN, Heiss G: Genome-Wide Linkage Analysis of Lipids in the Hypertension Genetic Epidemiology Network (HyperGEN) Blood Pressure Study. Arterioscler
Thromb Vasc Biol 2001, 21:1969-1976.
9. Pollin TI, Hsueh WC, Steinle NI, Snitker S, Shuldiner AR, Mitchell BD: A genome-wide scan of serum lipid levels in the Old Order Amish. Atherosclerosis 2004, 173:89-96.
10. Soro A, Pajukanta P, Lilja HE, Ylitalo K, Hiekkalinna T, Perola M, Can-tor RM, Viikari JS, Taskinen MR, Peltonen L: Genome scans pro-vide epro-vidence for low-HDL-C loci on chromosomes 8q23, 16q24.1-24.2, and 20q13.11 in Finnish families. Am J Hum Genet 2002, 70:1333-1340.
11. Almasy L, Hixson JE, Rainwater DL, Cole S, Williams JT, Mahaney MC, VandeBerg JL, Stern MP, MacCluer JW, Blangero J: Human pedi-gree-based quantitative-trait-locus mapping: localization of two genes influencing HDL-cholesterol metabolism. Am J
Hum Genet 1999, 64:1686-1693.
12. Rainwater DL, Almasy L, Blangero J, Cole SA, VandeBerg JL, Mac-Cluer JW, Hixson JE: A genome search identifies major quanti-tative trait loci on human chromosomes 3 and 4 that influence cholesterol concentrations in small LDL particles.
Arterioscler Thromb Vasc Biol 1999, 19:777-783.
13. Coon H, Eckfeldt JH, Leppert MF, Myers RH, Arnett DK, Heiss G, Province MA, Hunt SC: A genome-wide screen reveals evidence for a locus on chromosome 11 influencing variation in LDL cholesterol in the NHLBI Family Heart Study. Hum Genet 2002, 111:263-269.
14. Williams RR, Rao DC, Ellison RC, Arnett DK, Heiss G, Oberman A, Eckfeldt JH, Leppert MF, Province MA, Mockrin SC, Hunt SC: NHLBI family blood pressure program: methodology and recruit-ment in the HyperGEN network. Hypertension genetic epi-demiology network. Ann Epidemiol 2000, 10:389-400.
15. McGowan MW, Artiss JD, Strandbergh DR, Zork B: A peroxidase-coupled method for the colorimetric determination of serum triglycerides. Clin Chem 1983, 29:538-42.
16. Allain CC, Poon LS, Chan C, Richmond W, Fu PC: Enzymatic determination of total serum cholesterol. Clin Chem 1974, 20:470-475.
17. Friedewald WT, Levy RI, Fredrickson DS: Estimation of the con-centration of low-density lipoprotein cholesterol in plasma, without use of the preparative ultracentrifuge. Clin Chem 1972, 18:499-502.
18. David JA, Naito NK: Separation of lipoprotein (Lp) fraction by the Beckman TL-100 table-top ultracentrifuge (UC). Clin
Chem 1986, 32:1094.
19. Warnick GR, Benderson J, Albers JJ: Dextran sulfate-Mg2+
precip-itation procedure for quantprecip-itation of high-density-lipopro-tein cholesterol. Clin Chem 1982, 28:1379-1388.
20. [http://research.marshfieldclinic.org/genetics].
21. Hinds D, Risch N: The ASPEX package: affected sib-pair exclu-sion mapping v1.88. 1999 [ftp://lahmed.stanford.edu/pub/aspex/ doc/usage.html].
22. Abecasis GR, Cherny SS, Cookson WO, Cardon LR: GRR: graphi-cal representation of relationship errors. Bioinformatics 2001, 17:742-743.
23. Kruglyak L, Lander ES: Complete multipoint sib-pair analysis of qualitative and quantitative traits. Am J Hum Genet 1995, 57:439-454.
24. O'Connell JR, Weeks DE: PedCheck: a program for identifica-tion of genotype incompatibilities in linkage analysis. Am J
Hum Genet 1998, 63:259-266.
25. Province MA, Rao DC: General purpose model and a computer program for combined segregation and path analysis (SEG-PATH): automatically creating computer programs for sym-bolic language model specifications. Genet Epidemiol 1995, 12:203-219.
26. Province MA, Rice TK, Borecki IB, Gu C, Kraja A, Rao DC: Multivar-iate and multilocus variance components method, based on structural relationships to assess quantitative trait linkage via SEGPATH. Genet Epidemiol 2003, 24:128-138.
27. Rao DC, Province MA: The future of path analysis, segregation analysis, and combined models for genetic dissection of com-plex traits. Hum Hered 2000, 50:34-42.
28. Wu J, Kraja AT, Oberman A, Lewis CE, Ellison RC, Arnett DK, Heiss G, Lalouel JM, Turner ST, Hunt SC, Province MA, Rao DC: A sum-mary of antihypertensive medication effects on measured blood pressure. Am J Hypertens 2005, 18:934-941.
29. Levy D, DeStefano AL, Larson MG, O'Donnell CJ, Lifton RP, Gavras H, Cupples LA, Myers RH: Evidence for a gene influencing blood pressure on chromosome 17. Genome scan linkage results for longitudinal blood pressure phenotypes in subjects from the framingham heart study. Hypertension 2000, 36:477-483. 30. Hunt SC, Ellison RC, Atwood LD, Pankow JS, Province MA, Leppert
MF: Genome scans for blood pressure and hypertension: the National Heart, Lung, and Blood Institute Family Heart Study. Hypertension 2002, 40:1-6.
31. Cui JS, Hopper JL, Harrap SB: Antihypertensive treatments obscure familial contributions to blood pressure variation.
Hypertension 2003, 41:207-210.
32. Neaton JD, Grimm RH Jr, Prineas RJ, Stamler J, Grandits GA, Elmer PJ, Cutler JA, Flack JM, Schoenberger JA, McDonald R, Lewis CE, Lieb-son PR: Treatment of Mild Hypertension Study. Final results. Treatment of Mild Hypertension Study Research Group.
JAMA 1993, 270:713-724.
33. North KE, Miller MB, Coon H, Martin LJ, Peacock JM, Arnett D, Zhang B, Province M, Oberman A, Blangero J, Almasy L, Ellison RC, Heiss G: Evidence for a gene influencing fasting LDL choles-terol and triglyceride levels on chromosome 21q.
Atheroscle-rosis 2005, 179:119-25.
34. Yu Y, Wyszynski DF, Waterworth DM, Wilton SD, Barter PJ, Kes-aniemi YA, Mahley RW, McPherson R, Waeber G, Bersot TP, Ma Q, Sharma SS, Montgomery DS, Middleton LT, Sundseth SS, Mooser V, Grundy SM, Farrer LA: Multiple QTLs influencing triglyceride and HDL and total cholesterol levels identified in families with atherogenic dyslipidemia. J Lipid Res 2005, 46:2202-13.