Ames Laboratory ISC Technical Reports Ames Laboratory
12-1957
An automatic recording titrator
Gerald Ross UmbreitIowa State College J. S. Fritz Iowa State College
Follow this and additional works at:http://lib.dr.iastate.edu/ameslab_iscreports Part of theChemistry Commons, and theEngineering Commons
This Report is brought to you for free and open access by the Ames Laboratory at Iowa State University Digital Repository. It has been accepted for inclusion in Ames Laboratory ISC Technical Reports by an authorized administrator of Iowa State University Digital Repository. For more information, please [email protected].
Recommended Citation
Abstract
An automatic recording titrator is described which is applicable to all types of potentiometric titrations. Particular attention has been paid to the maintenance of accurate potential recording of the entire titration curve as well as accurate recording of the volume of titrant used. As a result the instrument is well-suited for analytical research where the complete curve, rather than just the equivalence point of the titration is of interest.
Disciplines
Chemistry | Engineering
1
I
ow()..
sc:
p,-1-
ISC..-J
()~/THE 1
AN AUTOMATIC RECORDING TITRATOR
By
· Gerald Ross Umbreit J. s. Fritz
December 1957
Ames Laboratory Iowa State College Ames, Iowa
UNITED STATES ATOMIC ENERGY COMMISSION Technical Information Service
Work performed under Contract No. W-7405-eng-82.
LEGAL NOTICE
This report was prepared as an account of Government sponsored work. Neither the United States, nor the Commission, nor any person acting on behalf of the Commission:
A. Makes any warranty or representation, expressed or implied, with respect to the accu-racy, completeness, or usefulness of the information contained in this report, or that the use of any Information, apparatus, method, or process disclosed in this report may not Infringe privately owned rights; or
B. Assumes any llab111ties with respect to the use of, or for damages resulting from the use of any Information, apparatus, method, or process disclosed In this report.
As used In the above, "person acting on behalf of the Commission" Includes any em-ployee or contractor of the Commission, or emem-ployee of such contractor, to the extent that such employee or contractor of the Commission, or employee of such contractor prepares, disseminates, or provides access to, any information pursuant to his employment or contract with the Commission, or his employment with such contractor.
This report has been reproduced directly from the best available copy.
Printed in USA. Price $1.50. Available from the Office of Technical Services, Department of Commerce, Washington 25, D. C.
AEC Technical tnrormation Service Extension
Oak Ridge, Tenneuee
ISC-1021
iii
An Automatic Recording Titrator*
Gerald Ross Umbreit and J.
s.
FritzAbstract
An automatic recording titrator is described which is
applicable to all types of potentiometric titrations.
Par-ticular attention has been paid to the maintenance of
accu-rate potential recording of the entire titration curve as
well as accurate recording of the volume of titrant used. As
a result the instrument is well-suited for analytical research
where the complete curve, rather than just the equivalence
point of the titration is of interest.
Simplicity of the instrument is maintained by use of
com-mercially available components for the major functions of
amplifying and recording. · Each of the major components retains
its separate identity, and thus may be used for other applications
without alterations. Acceptable substitutes for each of the major
components are suggested, and the relative merits of each are
discussed. Suggestions for improving the instrument are also
discussed.
TABLE OF CONTENTS
Page
INTRODUCTION •••• • • • • • • • • • • • • • • • • • • • • • • • • • • • • • • • • • • • • • • • • • • • 1
D~SCRIPTION OF THE INSTRUMENT. • • • • • • • • • • • • • • • • • • • • • •
•
• • • • • • 10OPERATION •••••••••
.
. . .
. .
.
.
.
.
. . .
.
. . .
. . .
.
.
.
. .
.
. . .
.
.
.
.
.
21APPLICATIONS ••• • • • • • • • • • • • • • • • • • • • • • • • • • • • • • • • • • • • • • • • • • • • •
26
DISCUSSION •••••••••••••••••••••••••••••••••••••••••••••••••43
Recommendations for Improvements ••••••••••••
Acceptable Substitutes for Components •••••••
. .
• • • • • •.
.
.
.
. .
• • •.
.
•43
45
1
INTRODUCTION
The increasing need of modern industry for rapid,
accu-rate and dependable methods for quality control, along with
the increasing pace of research in recent times,has made
the instrumentation of analytical procedures a subject of
prime interest. In-line instruments that not only record,
but also are capable of controlling the composition of a
plant stream are being used in ever increasing numbers.
Of the standard analytical methods in use, potentiometric
measurements are among the most readily adaptable to this
type of instrumentation.
The amount of information obtainable from a complete
potentiometric titration curve, and the speed with which
an automatic titrator can perform the titration make these
instruments extremely valuable as analytical tools.
Robinson (
38, P•447)
says of potentiometric titrations:When performed manually so as to give a detailed plot versus reagent volume, the potentiometric titration is a tedious and time-consuming
opera-tion having two distinct disadvantages. For
In general, there are two types of automatic titrators
that are described in the literature or are available from
commercial sources. These can be classified as recording
instruments or end-point sensing devices. The designation
as a recording instrument is restricted for purposes of this
discussion to the type of instrument that records the entire
titration curve as it would normally be determined by
manual methods. End-point sensing devices are instruments
that control a valve or stopcock on a titrant reservoir
either by reacting when a pre-set end-point potential is
reached, or by reacting to the sharp change in potentia]
which is encountered at the end-point.
For general applications, the recording type of
in-strument requires automatic performance of several
func-tions. It must incorporate a potentiometric recorder
which may also be equipped with certain warning or
con-trolling devices, and is generally equipped with a
motor-driven strip chart on which the titration curve is recorded.
An amplifier must be include~ in addition to that which is
normally a part of the recorder, to prevent loading of the
electrode circuit by the recorder. Means must also be
provided to deliver the titrant and to correlate the
titrant delivery with chart spacing. A commercial
instru-ment that fulfills these requirements is manufactured by
the Precision Scientific Company
(34, 35).
This3
titrator described by Robinson (38) and patented by Robinson
and Briggs (39). Other instruments of this type for general
applications are described by Duggan and Stevens
(8),
byKordatzki and Wulff (22) and Neilands and Cannon (32).
Lingane (24, 25) described an instrument which is
applic-able to all types of potentiometric titrations except
where the use of the glass electrode is involved. Eades
et al. (10) described an instrument that records the results
of up to 225 samples consecutive,ly by means of an automatic
sample changer.
Several instruments of this type are reported that
have been designed for specialized applications (1, 9,
46-48).
In general, these instruments have been designedfor remote operations with radioactive systems, or for
analytical control applications where only one component
of the system is analyzed.
Some of the earlier attempts at instrumentation of this
type are rather interesting. Kordatzki and Wulff (22)
de-scribed such an instrument in 1932. In principle, its
operation was as follows: Titrant is forced into the sample
slowly but continuously by means of a falling steel cylinder
which successively displaces mercury, paraffin oil and
titrant. The potential change is continuously recorded on a
chart, the travel of the chart is proportioned to the volume
of titrant delivered since the falling cylinder drives the
this instrument were reproduced in the paper. Still earlier,
in 1922, Keeler (19) described an instrument that was
designed to control the composition of a plant stream. The
functions of the instrument were the same as the titrators
described above, but the instrument was so regulated that
when the potential of the system being measured drifted
be-yond preset limits, a valve on a reservior of acid was
opened. The instrument functioned well as a titrator
when a suitable method of titrant delivery was used. Here
also, several very good titration curves were reproduced
in the paper. Hydrogen electrodes were used for
measure-ments of acidity in both cases cited above, and elaborate
amplifying systems such as are needed with the glass
elec-trode, were not required.
The end-point sensing device is not generally designed
to transmit a voltage signal which will permit the recording
of the normal titration curve. This type of instrument is
more specifically adapted to the routine type of work
generally encountered in a control laboratory. Here the
equivalence of titrant with sample is of prime importance,
rather than the shape of the titrant curve itself. Many
of these instruments are equipped to drive recorders, but
these are mainly for industrial purposes where the recorder
also acts as a controller and operates other equipment
whenever the potential of the system being measured drifts
5
type of instrument is a method of stopping delivery of
titrant from a reservoir at the exact end-point of the
titration. There are two methods of accomplishing this
which are inherently based on the electronic circuitry
of the instrument.
The circuit can be designed to trigger a relay when
the input signal from the electrodes reaches a certain
pre-determined value. This requires a pre-setting of the
instru-ment to respond to the end-point potential before the
titra-tion is attempted. Among commercially available
instru-ments, the Beckman titrator is an example of this type.
Others are described in the literature by several authors
(7, 14, 31, 33, 41, 43, 45).
Several of these authorsdescribe instruments for highly-specialized applications,
but all instruments require this pre-setting of the
end-point potential. Lingane
(24, 25)
described the alterationof a recording titrator to permit its use as an end-point
sensing device of this type.
The circuitry may also be designed to react to the
rapid change in potential produced at the end-point of
the titration. The derivative circuit designed by
Malm-stadt (26) and adapted for several analytical applications
(27-29)
functions by computing the second-derivative voltageof the ordinary potentiometric curve. This triggers a
relay system that stops delivery of titrant from the buret.
commer-instrument is equipped to drive a recording potentiometer
for the purpose of recording the derivative curve.
These two basic types of instrument can be adapted,
with slight alterations, for several other analytical
measurements. Automatic photometric titrations are reported
by several authors (16,
30, 42).
Linde et al.(23)
describe an apparatus for automatic thermometric titrations. Juliardand Van Cakenberghe (17) described an instrument for
auto-matically performing conductometric titrations. In all
these cases the instrumentation required is the same as
described for the recording titrator. The only difference
being that the signal for operation of the instrument is
obtained from sources other than the electrodes used for
potentiometric titrations.
One of the most important components of any automatic
titrator is a titrant delivery system. In conjunction with
end-point sensing devices, this delivery system requires
that the total volume used for the titration be measurable,
and that the flow of titrant be accurately ~topped
at the end-point. The rate of titrant feed should be
regulated, sufficiently so that numerous false end-points
are not obtained before the true end-point is reached.
In general, end-point sensing devices permit relatively
rapid titrant flow for the major part of the titration.
7
dAscribed by Audran and Dighton (3) and by Blaedel and
Malm-stadt (6) in addition to those described by some of the
authors listed in the previous paragraphs.
The recording titrator requires rigid correlation of
titrant delivery wit.h chart spacing. In general, the chart
is driven by a synchronous motor which moves the chart at
a uniform rate. The simplest means of correlating chart
spacing with titrant volume would then be the use of a
constant-flow buret which is actuated by the same switch
that controls the recorder chart motor. Of the several
methods of accomplishing this uniform rate of delivery,
two appear to be the most important.
The first of these is the constant-head buret. Burets
of this type are described by Barreda and Taylor (4) and by
Shapiro and Brannock
(42).
These burets are all based onvaria-tions of the familiar Marri.otte bottle classically used in
carbon-hydrogen determinations. The use of a calibrated
orifice in conjunction with this constant-head titrant
delivery system is described by Eades et al. (10). This
type of titrant delivery system has not been too widely
accepted because the accuracy of the system is generally
infArior to that obtained by motor-driven syringe burets.
The most satisfactory method of obtaining constant
titrant delivery is by means of a motor-driven syringe.
The use of a well-made syringe driven by a synchronous
Allen (2) however, feels that imperfections in the barrel
or piston of the syringe might introduce irregularities.
He suggests a precision-ground glass rod driven through a
gasket into an oversize barrel as an alternative.
The basic construction of a titrant delivery system
of this type is quite simple. A threaded shaft is turned
by a motor through a gear train or a belt and pulley system.
The threaded shaft, in turn, drives a movable threaded
block which pushes the piston of the syringe. A
cam-driven syringe has also heen described (3~). The inclusion
of a revolution counter on the motor or gear system adapts these systems ideally for use with an end-point sensing
instrument ( 18, 2
4,
25).One of the problems of automatic titrations is the
finite rate of attainment of equilibrium near· the end-point.
With some end-point sensing devices this results in
over-titrating the sample by 0.1 to
0.3
ml. (14,43).
If thetitrant is standardized instrumentally rather than
manu-ally, this difficulty is avoided.
A method of slowing the rate of titrant delivery near
the end-point while maintaining the titrant volume to chart
spacing correlation is a desirable feature of some of the
recording instruments. This is accomplished by two
different approaches. Lingane
(24)
and Neilands and Cannon(32) used a clutch and gear shift system for changing the
9
is shifted simultaneously, and the volume to spacing ratio
is maintained. Duggan and Stevens
(8)
accomplishedthischange in rate similarly. They used two synchronous motors
of different speeds incorporated in the syringe drive. The
second method is described by Ro~inson
{J8}
who used aSelsyn motor-generator combination on the buret drive, and
a Selsyn motor actuated by the genere.tor for the chart
drive. The recorder is equipped with an unbalance detector
that stops delivery of titrant whenever the balancing
potentiometer is more than
5
mv. behind the input signal.A brake is provided on the buret driving motor-generator
combination to prevent motion when the power is turned off
by the unbalance detector. This method is more complicated
mechanically and electrically, but appears to be superior
in operation.
The instrument to be described in this report is of
the recording type as defined earlier. It represents an
attempt to provide this type of instrumentation with
maxi-mum flexibility in application at minimaxi-mum cost. It is also
designed to examplify simplicity of construction such that
it could be reconstructed by the average analytical chemist
DESCRIPTION OF THE INSTRUMENT
The instrument that has been constructed incorporates
several component parts. These are an amplifier, a
strip-chart recording potentiometer, a constant-flow syringe-type
buret, a range and zero adjusting circuit which is
self-contained, and a self-contained control circuit which contains
all the operating switches. For the amplifying and
record-ing functions, commercially available instruments are used.
·.rhe complete instrument is pictured in Figure 1.
The amplifier is a Kay Lab model 202B microvoltmeter
and amplifier. The manufacturer of this instrument has
been succeeded by Kintel Laboratories, Inc. {21). Thi~
instrument was chosen primarily for its excellent
adapt-ability for the purposes of the titrator, and secondarily
for its flexibility for other uses. It has
14
voltageranges from 300 microv·olts to 1000 volts. The meter
regis-ters positive or negative values for any range so that the
input signal leads do not need to be reversed. The amplifier
output is 1 volt for full-scale deflection of the meter on
any range. The stability and accuracy exceed the
speci-fications of other instruments of the same type that were
investigated {12, 13, 20). The input impedance tor all
ranges from 300 mv. to 1000 volts is 100 megohms. This ie
11
the glass electrode. The impedance of the glass electrode
varies from 18 to 200 megohns ($, p.251) depending on the
type used. It is felt that the glass electrode system is
not overloaded by using this meter, but the voltage values
registered are only proportional to the actual voltage of
the electrode system. The use of electrode systems requiring
the glass electrode is permitted by proper compensation of
this proportionality in the range-and zero-adjusting circuits.
The recorder is a Bristol Model 560 wide-strip
Dyna-master D-C potentiometer and D-C bridge. The choice of
this recorder is somewhat arbitrary because there are
several other commercially available instruments of this
type that can meet the required specifications. The
recorder has a 12~nch chart width of which 11 inches are
calibrated from 0 to 100. The chart speed can be changed
by interchange of gears to any of
7
speeds from3/8
to4
1/2inches per minute. Full-scale deflection of the pen requires
1 second. The recorder has a fixed range of 10 mv. These
specifications provide a recorder with great flexibility
in application.
Some alterations have been made on the recorder to
adapt i t for these purposes without limiting its possible
adaptations for other purposes. These alterations are noted
in Figures 2 and
4.
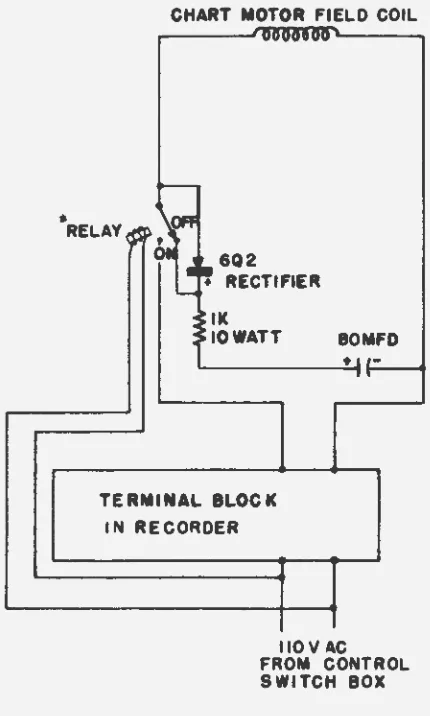
The internally-supplied power forthe chart motor has been disconnected and power supplied
CHART MOTOR FIELD COIL
6Q2 + RECTIFIER
IK
IOWATT 80MFD
•
F---TERMINAL BLOCK IN RECORDER
110 V AC FROM CONTROL SWJTCH BOX
Figure 2. Electronic Brake
"'POTTER+ BRUMFIELD DPDT RELAY
i-J
[image:19.563.248.463.70.428.2]to permit the synchronization of chart spacing with titrant
delivery. An electronic braking circuit has also been added
to the chart motor. The connections for this system are
taken at the same terminal block in the instrument as that
whfubaltered for the chart motor power supply. This circuit
is easily placed inside most recorders. In this case it
is inside the recorder door mounted on a plate behind the
chart motor. This brake serves to stop the chart
instan-taneously whenever the power is turned off. It prevents
backlash in the motor and gear train driving the chart,
and maintains the volume to spacing ratio when the buret
is turned off during the course of the titration. This break
functions by charging the large condenser while the
instru-ment is in operation, and discharging this condenser through
one of the field coils of the motor when the power is
turned off. The D-C current produced momentarily stops
the rotating armature within a quarter-turn or less.
The range and zero adjusting circuits provide for
proper placement of the titration curve on the chart, and
permit the recorded curve to cover the major portion of the
chart width. The details of this circuit are illustrated in
Figure
3·
The range selecting portion of this circuit isessentially a voltage-dividing system that uses the
"
'
SHIELDED CABLE
rr
--=---==---~~I I I I I I I I
l~l INDICATOR ELECTRODE II
II
REFERENCE ELECTRODE
'...L
_l
-
=-KAYLAB MODEL 202 B MICRO-VOLTMETER AMPLIFIER
USED ON 3V RANGE
(IV RANGE FOR
·GLASS ELECTRODE
-:
G..
~
1700~ 0-200MV1eon
POTENTIAL) 1!5K~
1.3V (MALLORY MERCURY !50QT-
BATTERY)HELIPOT I
15K
BATTERY ON-OFF
SWITCH
BRISTOL IOMV POTENTIOMETER RECORDER
Figure ). Range and zero adjusting ciruuit with complete signal circuit
1--'
[image:21.566.54.696.86.432.2]the known amplifier output. The switch designated as G-M
is used in the M position in all cases where the glass
electrode is not required. The G position permits use of
electrode systems requiring the glass electrode. The zero
and asymmetry potential adjustments are used to standardize
the instrument with standard buffer solutions in the same
manner as with an ordinary pH meter. The details of
standardizing will be discussed in a later section. The
zero adjusting circuit is designed to permit the placement
of the zero potential of the titration anywhere on the full
chart width, or in the case of a titration in which the
total range of the curve is above or below zero, the zero
position can be set up to an equivalent of 1.25 chart widths
beyond either limit of the calibrated portion of the chart.
The control circuit provides switching arrangements
for independent or simultaneous operation of the chart and
buret, and for reversing the buret for re-filling with
titrant. The control circuit also contains provisions for
limiting the forward and reverse travel of the buret to
prevent breakage and to stop the chart at the upper limit
of travel. These provisions are accomplished by the
place-ment of microswitches at the top and bottom of the channel
through which the threaded block moves. These switches are placed
as shown in Figure
5,
and included in the circuit shownin Figure
4.
The upper microswitches are on a movableTO CHART DRIVE MOTOR
RED
1
1
BLACKTERMINAL BLOCK
IN RECORDER
W~BLACK
ORIGINAL WIRESr--_ _ _ _. FROM INTERNAL
RECORDER SW. ON DEAD POSTS
C MS T2 (CHART STOP)
~
•
•cs CBS
C - common terminal
1
NC - normally closed
NO - normally open TO IIOVAC
LINE
CS - chart only on-off
I
BS
WHITE YELLOW
....-BURET
NO TOR
' I RED
GREEN
(BURET STOP)
12fMST~NC
7
RS
-r IMFD.
~~B~URET STOP)
NO NC
CS, CBS, BS and RS in box; 8 conductor cable using
only
7
from box to buret, 2 wires from box to chart motorMSt and MSb - microswitches top and bottom of buret frame
[image:23.567.55.669.66.465.2]BS - buret only on-off CBS - chart and buret on-off RS - buret motor reversing switch
Figure
4.
Control circuit1-'
wasting chart or titrant. The microswitch that controls
the chart is set to trigger shortly before the
buret-con-trolling microswitch, because the buret movement operates
both switches.
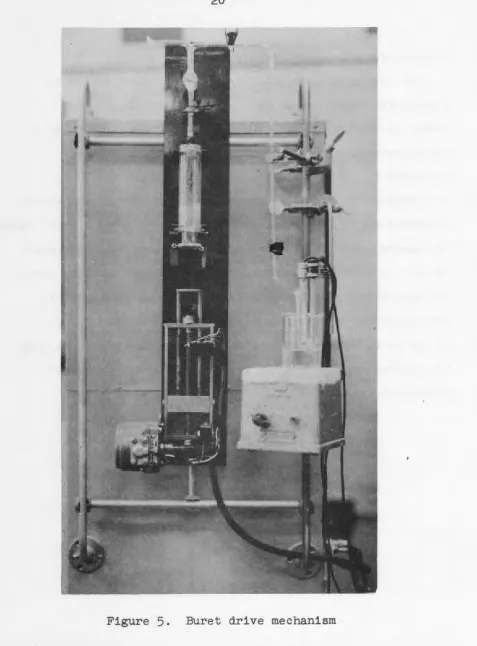
Figure
5
shows the syringe drive mechanism. The buretis a
50
ml. Luer syringe Which is available from alllab-oratory suppliers. It is fitted with a ground-glass ball
joint which is secured to the tip of the syringe with a
small ground-glass joint and sealed with Dekhotinsky cement.
A 3-way stopcock fitted with ground-glass sockets at all
3 positions fits the ball joint on the syringe. This
permits filling the buret or delivery of titrant by turning
the stopcock to the proper position. To direct titrant into
the sample beaker, 1 mm. glass tubing is used. To keep the
parts required for this purpose small enough for structural
rigidity, 12/1 standard ground-glass ball and socket joints
are used. The syringe piston is driven into the barrel in
the following manner: A Brown 60 rpm. reversible synchronous
motor fitted with a worm gear drives a shaft with 40 threads
per inch by means of a 100-tooth spiral gear fixed to the
bottom of the shaft. The worm gear passes 4 teeth of the
spiral gear with every revolution of the motor. The shaft,
in turn, drives a threaded block through the guiding
channels. A disc fixed to this block by two rods pushes
19
delivery rate of approximately 1 ml. per minute.
The description of this instrument is intended to be
a guide for construction of a similar instrument. Any
number of variations may be adopted to suit the needs of
a particular application. This instrument is designed
primarily to carry out titrations requiring
5
to 20 ml.of titrant. The recorder chart speeds are chosen to provide
a titration curve which uses Rbout 10 inches of the chart length
as compared to the 11 inch chart width. For these purposes
the 1/2 or 1 inch per minute chart speeds are normally used.
If other titrant delivery rates are desired, the
specifi-cations of the chart speed ranges on the recorder should
be chosen to correspond to the titrant delivery rate so that
the recorded curves are not greatly distorted in either
21
OPERATION
Operations preliminary to the actual titration require
filling of the buret, and removal of air bubbles from the
tubing which directs titrant into the sample beaker. The
titrant reservoir is connected to one side of the 3-way
stopcock by means of a ground-glass ball joint. The syringe
piston is pushed the maximum distance into the barre~with
the stopcock opened to the titrant delivery side, to permit
the expulsion of air. The stopcock is then turned to permit
solution from the titrant reservoir to be drawn into the
syringe by pulling the piston down toward the lower limit
of travel. The stopcock is then turned back to the titrant
delivery side, the piston is pushed into the barrel until
air bubbles have been expelled, and the titrant delivery
tubing is completely filled with titrant. The stopcock is
again turned, and the syringe filled with titrant by pulling
the piston to its lower limit of travel.
When these procedures have been completed, the range
switch is turned to zero, and the amplifier, battery switch
and recorder are turned on. The recorder on-off switch is
inside the door of the recorder. It is important that the
battery switch be turned on before the recorder. For
titrations employing electrodes other than the glass
elec-trode, the G-M switch is turned toM (metal electrodes).
is done by placing the electrodes first in the sample
solution, and noting the potential of the starting point of
the titration on the voltmeter, using the approximate range.
The final potential to be encountered is then determined
by nlacing the electrodes in an equivalent blank solution
containing a small amount of the titrant, and noting the
potential on the voltmeter as before. This fixes the
potential range to be covered, and the position of the
zero-potential point of the titration. The ranges available
for use on the machine are 200, 500, 1000 and 1500 mv. The
next larger range to the actual range of the titration must
be chosen for the total curve to be recorded on the chart.
If the potential range of the titration encompasses the
point of zero potential, the pen is moved to the appropriate
position on the scale by use of the zero adjusting
poten-tiometer, noting that the 0 to 100 calibration on the front
of the recorder will represent the range to be chosen
(e.g. If the range to be used is 1000 mv., each major
division on the scale will represent 100 mv.). The
stop-cock above the syringe is turned to the delivery side;
slack in the burst driving mechanism is taken up by running
i t for a moment andthen wiping the delivery tip dry. The
sample is then placed so that the electrodes and the buret
delivery tip project below the surface of the sample
solution. The recorder pen is released so that i t rests
23
of the calibration lines is directly under the point of
the pen. The range switch is then turned to the desired
range designation, and the buret and chart are started
simultaneously by turning the chart and buret on-off switch
(CBS) to the on position. When the titration is complete,
the switch is turned off.
When the potential range of the titration is all above
or below the point of zero potential, the zero adjustment
is not made until after the range switch is turned to the
appropriate position. At this point, the recorder pen will
move rapidly to the upper or lower limit of its travel.
It is brought back on scale as quickly as possible with the
zero adjustment. The position to which the pen is brought
will then represent the potential of the starting point.
The pen should be positioned so that the remainder of the
titration curve will fall on the calibrated portion of the
chart. The titration then proceeds as before. In a few
cases it will be necessary to reverse the electrode leads
into the voltmeter in order for the pen to be posit~oned
on the calibrated portion of the chart,as described above.
No titrations have been encountered where one or another
of ~he procedures described does not permit recording of
the total titration curve.
When the glass electrode is used, the voltmeter must
be turned to the 1 volt range for the titration. If direct
for the two points on each range. The range switch position
that gives the greatest pen travel within the calibrated
limits will be chosen, and the t i t ration carried out as
before. This will give an arbitrary potential range which
is only proportional to the actual potential of the electrode
system.
To record the titration curve in accurate pH terms,
pH buffers must be used as with all pH meters. For this
purpose, the voltmeter is used on the 1 volt range, and the
G-M switch is turned to the G (glass electrode) position.
Two buffer solutions are required, usually pH
4
and 7 orpH
7
and9.
If the total pH range of 0 to14
is desired,the 1000 mv. range will be used. The asymmetry potential
adjustment is turned to the limit so that the total
resis-tance represented by the asymmetry potential potentiometer
is in the circuit. The electrodes are immersed in the pH
7
buffer solution, and the range switch is turned to the 1000
mv. position. 'rhe pen is moved to give the desired
place-ment of pH
7
with the zero adjustment. The range switchis then turned to the off position, and pH
4
or 9 bufferis substituted for the pH
7
buffer. The range switch isagain turned to the 1000 mv • position, and the pen is moved
to the desired placement of pH
4
or 9 with the asymmetry25
sample can be titrated in the usual manner, and the pH of
any point on the titration curve is accurately recorded.
If lesser pH ranges are to be covered, the 500 or 200 mv.
ranges can be used to permit the recorded curve to utilize
most of the available chart width.
The electrodes should not be handled unless the range
switch is in the off position. The extra procedures required
for use of the glass electrode and the problem of the
pro-portionality of actual to recorded voltages are easily
eliminated by use of an electrometer-input
voltmeter-ampli-fier in place of the Kay Lab voltmeter used here. This will
be discussed in a later section. A Beckman 1190-80 blue
label glass electrode has been used with this instrument,
but a Leeds and Northrup electrode would be more
satisfac-tory because the impedance is lower than that of the Beckman
electrode. The ranges specified in the procedures for use
of the glass electrode are correct when the Beckman
elec-trode is used, but will change if the Leeds and Northrup
electrode is substituted, and must be independently
APPLICATIONS
Figures
6
through 17 are reproductions of titrationcurves recorded on the titrator. A few points should be
noted about these curves. It should be pointed out that some
of the detail is lost in the reproduction process. The
high-speed pen travel of the recorder results in the tracing
of some of the extraneous signal that is inevitably present
in all electronic systems. The level portions of the curves
have varying degrees of waviness that are not reproduced.
A rough comparison can be made to the appearance of a
recorded polarogram before the half-wave potential is
reached. This degree of waviness decreases as the range
used is increased. The 1000 and 1500 mv. ranges give nearly
smooth curves. As the range is decreased, the signal to
noise ratio also decreases so that the greatest irregularity
occurs with the 200 mv. range. No difficulty is encountered,
however, in identifying a uniform curve. The break of the
curve is always very neatly and smoothly defined. These
irregularities in the tracing of the curve can be eliminated
by using a recorder with a very slow pen speed, and
incor-porating the unbalance detector described by Robinson
(38).
This slow-speed pen does not respond to extraneous noise
present in the signal, b~t a recorder of this type is very
limited in other applications. The Precision Scientific
27
detecting system uses a recorder that requires
24
secondsfor full-scale deflection of the pen.
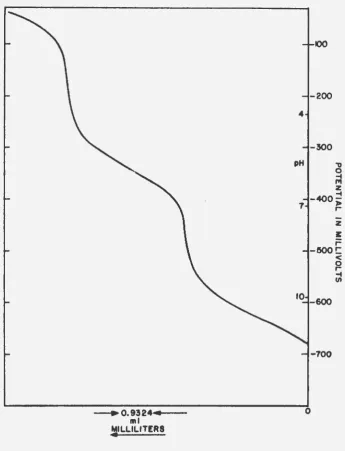
Figure 6 illustrates standardization of the instrument
so that the pH scale corresponds to the reduction potential
scale when the glass electrode is used. The titrator was
stand-ardized using pH
4
and7
buffers as described above, andchecked with pH
9
buffer. The pen position with the pH9
buffer was within
3
mv. of the theoretical-531
mv. thatwould be calculated on the basis of
59
mv. per pH unit.The correspondence of the inflections of the curv~ with
pH for the titration of sodium ca.rl>onate with hydrochloric
acid illustrates the reliability of pH measurements made
in this manner.
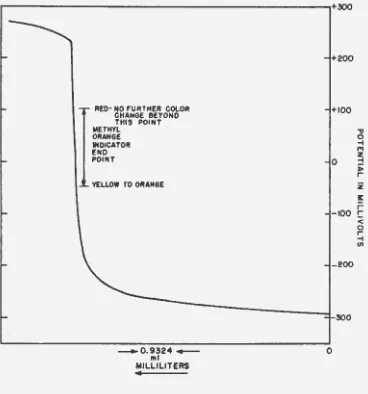
Figure 7 shows an ordinary aqueous acid-base titration
with an arbitrary potential scale. Methyl orange indicator
was added to the sample, and the range of color change noted
to show that the automatic titration gives essentially the
same end-point as would be obtained by manual titration wt th the
u~of an indicator. The non-symmetry of the curve indicates
a slight over-sensing of the end "1>oint. 'Ih1s illustrates
still another point of interest in automatic titrations.
The factors involved in obtaining a normal
potentio-metric titration curve are the placement of the buret
delivery tip in relation to the indicator electrcde, the
rate and direction of stirring, the rate of attainment of
the electrode detects the changes in the sample solution.
The determination of whether the recording system is
under-sensing or over-under-sensing the end-point can be accomplished
by stopping titrant delivery abruptly in the end-point
region of the titration. If the pen drifts back toward the
starting potential, the end-point is being over-sensed, and
the sample determination will be low. If the pen drifts
in the other direction, the end-point is being under-sensed
by the instrument, and results will be high. Sl ight
drifting may be ignored, but drifting of an inch or more
must be compensated. Three corrective measures are
avail-able. The buret delivery tip can be moved away from, or
closer to the indicator electrode in terms of the direction
of stirring,to correct over-sensing or under-sensing,
respectively. Stirring is generally maintained at a rate
as fast as is permissable without loss of sample by
spat-tering. Similar correction measures are obtained by
inter-changing the positions of the reference and indicator ele
c-trodes. A second method of compensating for these
con-ditions is to slow titrant delivery in the region of the
end-point. In the instrument described this is accomplished
by stopping the buret drive and chart mechanism once or
twice in this region. This is the primary purpose for
installing the electronic brake on the chart motor. The
third method of correcting these conditions is the use of
29
for under-sensing or over-sensing, respectively. This last
method is illustrated in Figure 8 where the same acid-base
titration has been carried out by using an antimony electrode
as the indicate~ electrode.
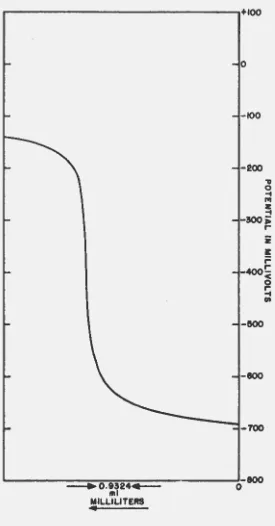
Figure 9 shows the titration of hydroxylamine in the
presence of hydroxylamine hydrochloride and triethanolamine
hydrochloride with hydrochloric acid. The solvent for
both sample and titrant is isopropanol. The potential
scale is arbitrary. This titratioB curve is included to
illustrate the use of the instrument for ~on-aqueous
acid-base titrations. This particular titration is one of the
steps in the analysis of carbonyl compounds described by
Yamamura (
49 ) •
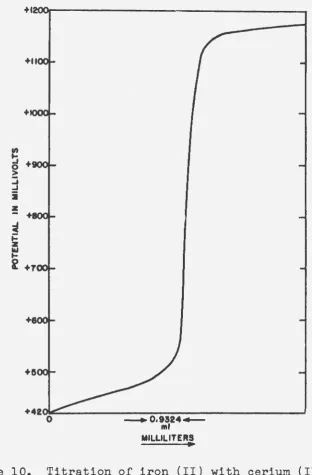
One of the more familiar of oxidation-reduction
titra-tions is reproduced in Figure 10, that of the titration of
iron (II) with cerium (IV). The potential scale in this
titration compares within 2 mv., at. all points, with the
same titration performed manually.
Figures 11 through 17 illustrate the application of
the titrator to potentiometric complex-forming titrations.
The use of various electrodes for this purpose is described
by Siggia et al.
(44).
The theory and use of the mercuryelectrode for this purpose is described by Reilley et al.
in a series of papers (15, 36, 37, 40). The mercury
elec-trode has been employed in all the titrations illustrated
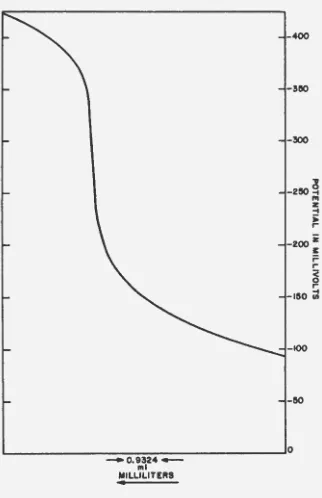
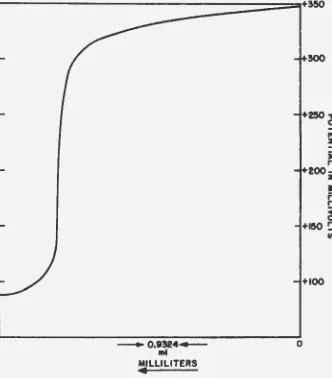
Figures 11 and 12 demonstrate the proper use of the
range switch to attain maximum use of the chart width.
When mercury (II) is titrated with EDTA at pH 6 (Figure 11)
the potential range of the titration is about 300 mv. Using
the 500 mv. range, this titratio~ utilizes approximately
three-fifths of the chart width. If the titration is
carried out at pH
4.6
(Figure 12), the range is slightlyunder 200 mv., but using the 200 mv. position of the range
switch permits the recorded curve to utilize nearly the
full width of the chart. It should be noted that the
avail-able ranges on the titrator have been very carefully chosen,
and have proven very satisfactory in use.
Figure 13,showing the titration of zinc and, Figures
14through 17, showing titrations of thorium,illustrate
some of the many EDTA titrations that may be carried out
automatically .by using the mercury electrode. The series of
thorium titrations were carried out in conjunction with
an investigation of the practical limits of dilution
that could be attained while still providing a titration
curve with an easily determined end-point. In the series
illustrated, the intersection of the extrapolation of the
steepest portion of the break of the curve to the extension
of the level portion of the curve before the end-point
gives the same point of intersection for all of the
Figure 6 •
31
--+ o. 9324 ... 1
-ml MILLILITERS
100
"'0 0 ~
z
-400j
,..
r
z
E
r -&00!:
<
0
r -4 (/)
0
Titration of 0.05 M Na2C03 with 0.1 M HCl
r---~+~
Figure
RED· NO FURTHER COLOR CHANGE BEYOND THIS POINT METHYL
ORANGE INDICATOR END POINT
YELLOW TO OAAN6E
-0.9324 .,.._
ml
MILLILITERS
0
~ Titration of 0.1 M NaOH with 0.1 M HCl Glass-calomel electrode system
,
0 -i,
z ~ J>r-z
! r-< 0 r--i f/133
r - - - + 1 0 0
z
K
;=
-400!:
<
0
r
...
(II
~---~.~0~
.•
~3~2~4-4 __________ ~-~ [image:39.564.162.437.78.604.2]ml 0
Figure
8 •
MILLILITERS
~---~~~~---~0
-.o.9324.-"''
[image:40.565.112.434.110.608.2]MILLILITERS
Figure
9.
Titration of H2NOH with HCl in isopropanol Glass-calomel electrode system+
35
_.0.9324+-"''
MILLILITERSFigure 10. Titration of iron (II) with cerium (IV)
Platinum-calomel electrode system with leads reversed
[image:41.567.124.437.147.623.2]r---~::::::::::::=====,+3eo
Figure 11.
----.
0.93244----....
~LLILITERS
+tOO
0
Titration of 0.05 M Hg (II) with 0.05 M EDTA
at
pH
6
-
-11!ercury-calomel electrode system
37
.,
0
-4
+80 ~
-4
)>
r
z +60 ~
r
r
<
0
r
-4 (/1
L---J-20
Figure 12.
-
0.9324----ml
.ILLILITERS
0
Titration of 0.05 M Hg (II) with 0.05 M EDTA
at pH
4.6
-Mercury-calomel electrode system
[image:43.566.109.461.111.669.2]~---1·
t250
,
+1150 ~
"'
z-1
;; r
+100 z
~
r r
< 0 r -1
en
[image:44.567.95.440.170.526.2]~---~-50
Figure 13 ..
____. o. 9 3 2 4 -ml
MILLILITERS
0
Titration of 0.05 M Zn with 0.05 M EDTA
Mercurycalomel electrode system
Figure
14.
39
_.o.•al4+-"'l
llltLLILITERS
+220 ~
;;1
z
~
;;
r
+200 z
1:
;::
c
~ +110 ~
en
+140
0
Titration of
0.05
M Th witho.o5
M EDTA Nercury-calomel electrode systemFigure
15.
----+- 0. 9324 - - - -ml
MILLILITERS
+140
+120
"'tl
0
-I
I'TI
2
-I
+100~ 2
:i:
r=
0
r
<
0
r
-I en
Titration of 0.005 M Th with 0.005 M EDTA
Mercury-calomel electrode system
Figure
16.
41
--+
0.93244--ml
MILLIUTERS
-4
Titration of
5
x ~0 M Th with5
Mercury-calomel e1ectrode system
200 mv. range
,
+1000
...
0
"'
z:j
,.
r
.---~+160
Figure
17.
___. 0.93244 ... ...__ ml
MILLILITERS
~
~
PI z ....
+140;; ,....
0
Titration of 1 x 10⁻⁴ M Th with 1 x 10⁻⁴ M EDTA Mercury-calomel electrode system
43
DISCUSSION
Recommendations for Improvements
The instrument that has been described is designed to
give an accuracy of ~
0.3%
both in potential scale readingand in end-point determination as interpreted from the
recorded titration curve. This has been demonstrated both
in the determination of rate of titrant delivery and in
actual titrations of known samples. As in any titration
prooedure, the titrant should be standardized by the method
to be used for sample determinations. When this is done,
the factors limiting the accuracy of the automatic
titra-tion are the limits of accuracy of the amplifier and
recorder, and the accuracy of calibration of the resistors
in the range selecting circuit.
In the instrument described, the recorder is the
com-ponent of least accuracy. The actual electrical accuracy
of the recorder is ~
0.25%
of full scale. This is furtherconditioned by the finite thickness of the line drawn by the
recorder pen. The accuracy of locating the end-point is
limited also by the finite thickness of the recorded curve,
and the ability of the operator to start the titration with
the pen exactly on one of the calibrated lines of the chart
and thus accurately calculate the volume of titrant
out by using the instrument, and the titrant is not to be used
for any manual titrations, its concentration can be expressed
in terms of equivalents per unit chart spacing, and the
calculation of volume is not necessary.
This instrument can be easily converted to an end-point
sensing device by inclusion of a mercury or contact switch
attached to the shaft of the balancing potentiometer of
the recorder, or on a movable mounting where the pen
move-ment can be made to actuate the switch. Electrically, this switch
is inserted in the power line to the control circuit.
Pre-setting the position of the switch to correspond to
the end-point potential of the titration will result in
stopping the titration automatically at the end-point. The
details of this alteration are described by Lingane (24).
Addition of a revolution counter to the buret drive would
be desirable for this purpose.
The flexibility of the components has been emphasized.
This flexibility will permit the use of the instrument for
photometric, thermometric or conductometric titrations by
suitable substitution of the required signal sources for
the electrodes. Appropriate choice of the ranges available
on the voltmeter and range circuit can be made for these
purposes.
The recorder-amplifier-range circuit system is ideally
suited for adaptation to gas chromatography. The additional
sepa-45
rately or assembled from commercial suppliers.
The inclusion of provisions other than the electronic
brake for slowing the rate of deliver~ of titrant near the
end-point would be desirable. Methods of accomplishing
this have been described. The substitution of a nylon or
teflon syringe for the glass syringe would be desirable
for use with strongly basic titrant solutions. A teflon
syringe has been constructed for this purpose, but has not
yet been tested.
Acceptable Substitutes for Components
Several recorders are commercially available which
can be supplied to fit the specifications described in
previous sections. The Brown, Leeds and Northrup, Wheelco
and Weston recorders are in this group. Recorders with
narrower charts are manufactured by these organizations,
and by Varian Associates. The narrower chart could be
used in control applications where the exact potential
values are of lesser importance. The end-points of
titra-tions could still be determined with nearly the same
accu-racy as with the wide chart in most cases. Two recorders
are available which would replace the range and zero
adjusting circuit also. These are the Fisher Recordall (11)
and the Sargent recorder. The Sargent recorder has been
briefly tested by the autharsand shown to be usable for
required, these two recorders can be used, without the
addi-tional amplifier, for most other electrode systems.
Most of the difficulties involved in the use of the
glass electrode as described can be easily eliminated by
substituting an electrometer-input voltmeter-amplifier for
the Kay Lab instrument used in this titrator. This type
of voltmeter will per~t direct reading and recording of
the actual voltage signal. Instruments of this type are
made by the General Radio Company
(12, 13)
and by KeithleyInstruments, Inc. (20). The substitution of either of these
instruments for the Kay Lab voltmeter will result in a
neg-ligible reduction in the accuracy of the potential
measure-ments. However, the advantages gained in operations 1-ri tb
the glass electrode make this substitution desirable. The
resistors used in the range circuit would have to be changed
to conform to the voltmeter output unless the specification
47
LITERATURE CITED
1. Allen, K. A. Anal. Chern. 28: 1144 (1956)
2. Allen, K. A. Anal. Chern. 28: 277 (1956)
3.
Audran, R. and Dighton, D. T. R. J. Sci. Instr. 33:92 (1956)
4-
Barre do, J. M. G. and Taylor, J.K.
·Trans. Electrochem.Soc. 92: 437 (19!J.7)
5. Bates, R. G. Electrometric pH determinations. John
Wiley and Sons, Inc. New York. 1954
6.
7.
8.
Blaedel, W. J. 455 (1952)
Carson,
w.
N •,Duggan, E. L. 1076 (1957)
and Malmstadt, H.
Jr. Anal. Chern.
and Stevens,
v.
L.v.
Anal. Chern. 24:25: 1733 (1953)
Anal. Chern. 29:
9. Dykes, F.
w.,
Masterson, R. G. and Rein, J. E. IdahoOperations Office Report No. ID0-14406 Atomic Energy
Commission (April 1, 1957) Office of Technical
Services, Department of Commerce, Washington
25,
D.c.
10. Eades,
c.
H., Jr., McKay, B. P., Romans,w.
E. and Ruffin,G. P. Anal Chern. 27: 121 (1955)
11. Fisher Scientific Company. Bulletin FS-251. Fisher
Recordall. The Company. Chicago, Ill. circa 1957
12. General Radio Company. Condensed Catalog. The Company.
Cambridge, Mass. circa 1957
~ 13. General Radio Company. Type 1230-A D-C amplifier and
electrometer. The Company. Cambridge, Mass. circa 1957
14. Haslam, J., Squirrel!, D. C. M. AnalJst. 79: 689
(1954)
15. Hildebrand, G. P. and Reilley,
c.
N. Anal. Chern. 29:16. Hume, D. N. and Marple, T. L. Anal. Chern. 28: 1116 (1956)
17. Juliard, A. and Van CakenbArghe, J. Anal. Chim. Acta.
2: 542 (1948)
18. Juliard, A. and Van Cakenberghe, J. Chimie et industrie. 63, no. 3: 72 (March, 1950)
19. Keeler, E. A. Ind. Eng. Chern. 1~: 395 (1922)
20. Keithley Instruments, Inc. Catalog B. The Company. Cleveland, Ohio. circa 1957
21. Kintel Laboratories, Inc. Microvoltmeter and Amplifier model 202B Technical Manual. The Company. San Diego,
Calif. circa 1957.
22. Kordatzki, W. and Wulff, P. Z. Anal. Chern. 89: 241 (1932)
23. Linde, H. W., Rogers, L. B. and Hume, D. N. Anal. Chern.
25: 404 (1953)
24. Lingane, J. J. Anal. Chern. 20: 285 (1948)
25. Lingane, J. J. Anal. Chern. 21: 497 (1949)
26. Malmstadt, H. V. Anal. Chern. 26: 1348 (1954)
27. Malmstadt, H. V. and Fett, E. R. Anal. Chern. 27: 1757 (1955)
28. Malmstadt, H.
v.
and Roberts,c.
B. Anal. Chern. 28: 1408 (1956)29. Malmstadt, H. V. and Roberts, C. B. Anal. Chern. 28: 1412 (1956)
30. Marple, T. L. and Hume, D. N. Anal. Chern. 28: 1116 (1956)
31. Musha, S. Apparatus for automatic electric titration. Japanese Patent 900. Mar. 3, 1953 (To Shimazu Mfg. Co.) Original not available for examination;
abstracted in Chern. Abstr. 48: 1082 (1954)
49
32. Neilands, J. B. and Cannon, M. D. Anal. Chern. 27: 29 (19.55)
33.
34.
Pompeo, D. J., Parker, J. and Smith,
s. s.
WorldPetroleum Congr. Proc. 3, sect. VI: .506 Hague (19.51)
Precision Scientific Company. Bu117tin 640A. Company. Chicago, Ill. circa 1956
The
35.
Precision Scientific Company. Bulletin 640B. The Company. Chicago Ill. circa 19.5636. Reilley, C. N. and Schmid, R. W. Chelometric titrations with potentiometric end-point detection. To be pub-lished in Anal. Chern. circa 1958
37. Reilley, C. N., Schmid, R. W. and Lamson, D. W. Chela-metric titrations with potentioChela-metric end-point. To be published in Anal. Chern. circa 19.58
38. Robinson, H. A. Trans. Electrochem. Soc. 92: 44.5 (1947)
39. Robinson, H. A. and Briggs,
u.s.
Patent 2,666,691 Jan.available for examination; 48: 4266 (19.54)
R. H. Automatic Titrator. 19, 19.54 Original not abstracted in Chern. Abstr.
40. Schmid, R. W. and Reilley, C. N. Anal. Chern. 29: 264 (19.57·)
41. Shaffer, P. A., Jr., Briglio, A., Jr., and Brockman, J. A., Jr., Anal. Chern. 20: 1008 (1948)
42. Shapiro, L. and Brannock, W. W. Anal. Chern. 27: 725 (195.5)
43. Shenk, W. E. and Fenwick, F. Ind. Eng. Chern. Anal.
44·
Ed. 7: 194 (193.5)
Siggia,
s.,
Eichlin, D. W. and Rheinhart, R.c.
Anal. Chern. 27: 174.5 (19.55)46. Wise, E. N. Los Alamos Scientific Laboratory Report
No. AECU-1100 Atomic Energy Commission (April 2,
1951) Office of Technical Services, Department of
Commerce, Washington
25,
D. C.47. Wise, E. N. Los Alamos Scientific Laboratory Report
No. LA-1176 Atomic Energy Commission (Sept. 11,
1950) Office of Technical Services, Department of
Co~~erce, Washington
25,
D.c.
48. Wise, E. N. Anal. Chem. 23: 1479 (1951)
49. Yamamura, S.
s.
Determination of organic acids andcarbonyl compounds. Unpublished Ph.D. Thesis.
Ames, Iowa, Iowa State College Library. 1957