White Rose Research Online URL for this paper:
http://eprints.whiterose.ac.uk/116404/
Version: Published Version
Article:
Farrell, G orcid.org/0000-0002-3987-8457 (1995) Preventing Repeat Victimization. Crime
and Justice, 19. pp. 469-534. ISSN 0192-3234
https://doi.org/10.1086/449236
(c) 1995 by The University of Chicago. All rights reserved. Reproduced in accordance with
the publisher's self-archiving policy.
[email protected] https://eprints.whiterose.ac.uk/ Reuse
Items deposited in White Rose Research Online are protected by copyright, with all rights reserved unless indicated otherwise. They may be downloaded and/or printed for private study, or other acts as permitted by national copyright laws. The publisher or other rights holders may allow further reproduction and re-use of the full text version. This is indicated by the licence information on the White Rose Research Online record for the item.
Takedown
If you consider content in White Rose Research Online to be in breach of UK law, please notify us by
Graham
Farrell
Preventing
Repeat
Victimization
ABSTRACT
Revictimization or repeat victimization of people and places represent a large proportion of all victimization. Preventing revictimization may prevent a large proportion of all offenses. Repeat crimes are disproportionately likely in high-crime areas and in the period shortly after a crime-suggesting that efficient crime prevention might be achieved through rapid, transitory responses to victimization. The extent of revictimization is typically underestimated. Knowledge of revictimization patterns may provide bases for more effective prevention of domestic violence, burglary, car crimes, and other offenses. Quick response alarms, loaned to "high-risk" targets on a temporary basis, are one possible way forward for efficient crime prevention and offender detection.
The phenomenon of revictimization has been recognized in the crimi- nological literature for over two decades. Small percentages of the population, and of victims, suffer large percentages of all criminal vic- timizations. Only comparatively recently have the policy implications of repeat victimization begun to be recognized. If revictimization con- stitutes a large proportion of all victimization, then preventing revic- timization will prevent a large proportion of all offenses. Focusing preventive resources on identified victims simultaneously uses past vic- timization as a justifiable rationale for allocation of crime prevention resources, opens up a new set of strategies for preventing crime, poten-
Graham Farrell is senior research officer at the United Nations in Vienna and honor- ary research fellow at Manchester University, Department of Social Policy and Social Work. He is indebted to Ken Pease for comments on earlier versions of this essay and to Alice Sampson, Coretta Phillips, Paul Ekblom, Mike Hough, Albert J. Reiss, Jr., Trevor Bennett, Lawrence Sherman, and the editors of this volume.
? 1995 by The University of Chicago. All rights reserved. 0192-3234/95/0019-0004$01 .00
tially promises greater preventive efficiency than many strategies now in use, and highlights a new set of empirical and theoretical issues for analysis and understanding. Research on revictimization is in its early days, but results are promising and suggest that more energy and resources be invested in basic research and evaluation of prevention programs, and that investigation of victim careers, by analogy to the now maturing body of work on criminal careers, may yield consider- able fruit.
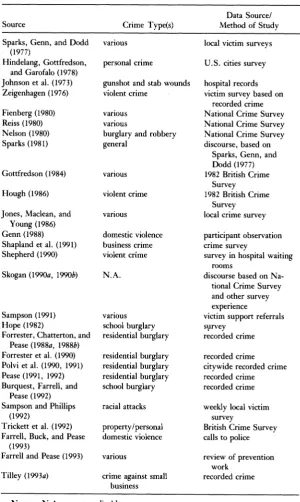
Distinct patterns of the nature of revictimization have begun to emerge from the literature. The most obvious is that a relatively small proportion of the population experience a large proportion of all crime. There is a highly skewed distribution of crime in the population that is not due to chance. This observation holds up to rigorous testing from a variety of different sources. Table 1 (below) shows that research using at least nine different research methods has generated similar patterns. Similar patterns of revictimization have emerged from hospi- tal records (Johnson et al. 1973), interviews generated from recorded crime (Zeigenhagen 1976), local victim surveys (Sparks, Genn, and Dodd 1977; Hope 1982; Jones, Maclean, and Young 1986; Farrell 1992), national victim surveys (Gottfredson 1984; Hough 1986; Trick- ett et al. 1992), comparative international victim surveys (Hindelang, Gottfredson, and Garofalo 1978; Fienberg 1980; Reiss 1980), a survey of hospitalized victims of assault (Shepherd 1990), participant observa- tion (Genn 1988), victim referrals to a Victim Support scheme (Samp- son 1991), police recorded crimes (Forrester, Chatterton, and Pease 1988a; Forrester et al. 1990; Polvi et al. 1990; Burquest, Farrell, and Pease 1992), and police incident logs (Farrell 1992; Lloyd, Farrell, and Pease 1994). In addition, the degree of skew in the distribution of victimization is such that the 2 or 3 percent of respondents to victim surveys who are the most victimized commonly report between a quar- ter and a third of all incidents.
TABLE 1
Published Sources on Repeat Victimization and Crime Prevention
Data Source/ Source Crime Type(s) Method of Study
Sparks, Genn, and Dodd various local victim surveys (1977)
Hindelang, Gottfredson, personal crime U.S. cities survey and Garofalo (1978)
Johnson et al. (1973) gunshot and stab wounds hospital records Zeigenhagen (1976) violent crime victim survey based on
recorded crime Fienberg (1980) various National Crime Survey Reiss (1980) various National Crime Survey Nelson (1980) burglary and robbery National Crime Survey Sparks (1981) general discourse, based on
Sparks, Genn, and Dodd (1977) Gottfredson (1984) various 1982 British Crime
Survey
Hough (1986) violent crime 1982 British Crime Survey
Jones, Maclean, and various local crime survey Young (1986)
Genn (1988) domestic violence participant observation Shapland et al. (1991) business crime crime survey
Shepherd (1990) violent crime survey in hospital waiting rooms
Skogan (1990a, 1990b) N.A. discourse based on Na- tional Crime Survey and other survey experience
Sampson (1991) various victim support referrals Hope (1982) school burglary survey
Forrester, Chatterton, and residential burglary recorded crime Pease (1988a, 1988b)
Forrester et al. (1990) residential burglary recorded crime Polvi et al. (1990, 1991) residential burglary citywide recorded crime Pease (1991, 1992) residential burglary recorded crime Burquest, Farrell, and school burglary recorded crime
Pease (1992)
Sampson and Phillips racial attacks weekly local victim
(1992) survey
Trickett et al. (1992) property/personal British Crime Survey Farrell, Buck, and Pease domestic violence calls to police
(1993)
Farrell and Pease (1993) various review of prevention work
Tilley (1993a) crime against small recorded crime business
acteristics to increase its accuracy. The literature also suggests that the circumstances and conditions produced by targeting revictimization may foster the development of new and innovative prevention tech- niques and more efficient deployment of existing ones. Thus, pre- venting victimization may satisfy the first condition while producing circumstances conducive to the attainment of the second. As a rider, however, the dearth of practical application to date means that the revictimization predictor has been used mostly to generate promising hypotheses rather than to test hypotheses.
Parallels exist between predictive uses of prior victimization and prior offending. Prior offending is the single most reliable predictor of future offending (see, e.g., Nuttall et al. 1977). Preventing recidivist offending would prevent a large proportion of all offending, just as, it appears, preventing revictimization would prevent a large proportion of all victimization.
An emphasis on victim-oriented prevention may be attractive to vic- tims, practitioners, and policymakers. This may be particularly true in the light of a growing literature that portrays victims as neglected by the criminal justice system (Shapland, Willmore, and Duff 1985; Newburn and Merry 1990). With respect to the revictimization pre- dictor, if, as Farrington and Tarling (1985) suggest, the most successful criminological predictors are usually those obtained using simple meth- ods, then the one presented here may serve well.
Preventing Repeat Victimization 473
venting revictimization and offender detection based around the revic- timization predictor. Section IX presents conclusions.
I. Introduction
Revictimization or repeat victimization are the terms preferred here to refer to the repeated criminal victimization of a person or place. People subject to revictimization are here termed repeat victims. A variety of different terms have arisen to refer to the same phenomenon: revictim- ization, multiple victimization, repeat victimization, multivictimiza- tion, repetitive victimization, and recidivist victimization. There has been little consistent usage of terminology to date. The grounds for the choice of terminology deserve some explanation. "Revictimization" is preferable to multiple victimization because it makes clear that revic- timization is distinct from incidents in which multiple offenders com- mit a crime or in which more than one victim is affected in a single incident. These have both been described as "multiple victimization" (Sparks 1981). The terms "revictimization" and "repeat victimization" can be used largely interchangeably with respect to crime prevention: both imply a link, however constituted, between one victimization and the next, thereby highlighting the potential for intervention. A preference for "revictimization" comes from the ease with which the parallels can be fashioned and recognized between revictimization and reconviction or recidivism, particularly with respect to criminological prediction.
A. "Preventing Revictimization" and "The Criminology of Place"
crime "hot spots," repeat call address policing, and the prevention of revictimization. Some of the revictimization work discussed here bases crime analyses on calls to the police. Among common themes are the use of empirical data to identify crime patterns, a policy interest in prediction, and an interest in identifying the causal mechanisms of crime. However, there are differences; the emphasis on preventing revictimization, for example, is on crime and crime prevention rather than on reducing calls for police service. The link between the two might be that between problem-oriented policing (Goldstein 1979, 1990; Sherman 1991) and crime prevention through crime analysis (Ekblom 1988), both of which are manifestations of the epidemiological approach.
Because these developments have been comprehensively covered in a recent Crime andJustice volume (Sherman 1992b), findings from prob- lem-oriented policing research are not detailed here, though they are discussed in the light of their implications for preventing revictim- ization.
B. Determinants of Revictimization
The term "revictimization" can refer to a variety of different circum- stances and conditions in which one criminal victimization is followed by another. The probability of revictimization will vary according to the initial type of crime. Revictimization of a person or place may be related or unrelated to a prior incident. A subsequent crime may be of the same or a different type. The offender(s) may or may not be the same. The victim and offender may or may not know each other. The offender may know the victim but not vice versa. Two parties to a long-running dispute may be both repeat victims and repeat offend- ers. The probability of revictimization may be influenced by individual and environmental characteristics. Individual-level characteristics af-
Preventing Repeat Victimization 475
to repeat burglary and vandalism? How do these factors relate to differ- ent car crimes?
The list of the factors that may influence revictimization is not in- tended to be exhaustive but to serve as an introduction to the intricacies of the subject. Some of these ingredients may be important to the development of more accurate revictimization predictors. The extent to which they refine the predictor will have direct implications for the optimal allocation of crime prevention resources.
C. Paradox and Prudence in Crime Prevention
A paradox of much crime prevention effort, highlighted by Harvey, Grimshaw, and Pease (1989) with respect to crime prevention officers, and Hussain (1988) with respect to Neighbourhood Watch, is that the distribution of crime prevention activity and resources is often inversely related to need. Those with the highest probability of victimization may also be those least likely to be provided prevention resources, and those resources that are in the public domain may inadvertently go elsewhere. In the United Kingdom at least, crime prevention officers can spend much of their time in public relations work and other tasks that have at best a tangential link to crime prevention.
Crime prevention policies based on the prevention of revictimization may bring about a more effective and defensible allocation of resources. If victimization is a good predictor of revictimization, targeting the latter is a practical and prudent strategy, in effect concentrating re- sources on those crimes that are the most predictable in time and space. By definition, it targets those who disproportionately experience crime-shifting supply of resources closer to demand.
D. Crime Rate Measures
There will almost always be more crimes than victims, so incidence is higher than prevalence, and concentration is greater than one.' This is because some people and places are victimized on more than one occasion. However, even when presented side by side, incidence and prevalence rates only suggest the extent of revictimization through a comparison of their differences and do not suggest the inequality of victimization found in all aspects of the literature. The concentration rate can be used to compare the rate of repeat victimization, between two areas or subgroups of the population for example, where it might not be otherwise apparent from differing incidence and prevalence rates. If revictimization is prevented, crime incidence will fall close or equal to crime prevalence.2 The three measures are almost the sum total of progress in the measurement of victimization to date.
Barr and Pease (1990) suggest further measures that account for skewed or unequal distribution and might be applied to crime rates. These would not require any artificial limits to be placed on the num- ber of victimizations a person can report to a crime survey for a given time period (this is discussed in more detail later), because the measures would not be distorted by a small number of people experiencing a large number of crimes. Barr and Pease (1990) suggest the Gini coeffi- cient as a possibility taken from urban geography. The Gini coefficient measures inequality between zero (complete equality) and one (com- plete inequality). A measure of inequality has important potential ap- plications: measuring change in inequality through time for instance. A crime prevention initiative might have different effects on prevalence and incidence, which would be effectively shown as a change in crime distribution through the population. Personal crime is more unequally distributed (has a higher Gini coefficient) than property crime, largely due to personal crime's higher prevalence. When victims only are con- sidered however, personal and property crime are both more evenly distributed (as would be expected when nonvictims are taken out) but show greater similarity in the distribution of victimization (Farrell
1994a). If revictimization were reduced, the Gini coefficient would
1 Possible exceptions to the rule will depend on counting procedures used. Crimes for which there is more than one victim may have greater prevalence.
Preventing Repeat Victimization 477
move closer to zero. Trickett et al. (1994) use the Gini coefficient to measure inequality of victimization between areas across the 1982, 1984, and 1988 British Crime Surveys and conclude that inequality in the distribution of victimization has increased through the 1980s but that the increase was largely due to an increase in repeat victimization. More research into measures of distribution would improve our un- derstanding of victimization. In economics, the concentration curve and ratio, the Herfindahl Index, and the entropy and relative entropy coefficients are commonly used measures of concentration, distribu- tion, and inequality (see, e.g., George and Joll 1981), as is Atkinson's inequality index (Atkinson 1970). With respect to general methodology in the study of revictimization, just as Fienberg (1980) used a Markov- chain analysis to study revictimization, this is a method that has been used in the study of criminal careers (see, e.g., Stander et al. 1989). Studies of revictimization, insofar as they may be "victim careers," could benefit greatly from the method and analytical techniques of its more developed counterpart, the study of criminal careers. How does a victimization lambda vary by crime type, by area, over time, and by subgroups of the population, for example?
II. The Extent of Revictimization
Repeat victimization appears to be robust across types of crime and methods of study. Repeat victimization can be by the same or different types of crime, or both. A "survey of surveys" shows that five crime surveys have each demonstrated similar patterns of the extent of repeat victimization.
A. The Extent of Repeat Victimization
Revictimization constitutes a large proportion of all victimization. It is necessary to establish a firm empirical foundation in order to demon- strate why preventing repeat victimization may be an attractive general crime prevention strategy. Revictimization findings are restricted nei- ther to types of crime nor to particular methods of study. Methodologi- cal limitations in the study of revictimization, discussed in a later sec- tion, suggest that the extent of revictimization is often understated.
works, one British, one American, were the earliest works to undertake an extensive analysis of revictimization using crime survey data. They remain prominent among the existing literature for their breadth and thoroughness. However, it should be noted that they were preceded by the works of Johnson et al. (1973) and Zeigenhagen (1976).
The Johnson et al. study (1973) is the earliest work on revictimiza- tion found in an extensive literature review. It attempted to describe the social, medical, and criminal characteristics of victims and recidi- vist victims of gunshot and stab wounds from the records of a U.S. hospital. The study emerged from the authors' personal experiences that the same people returned to the hospital time and again, as repeat victims of these types of violence. Case histories were constructed that showed that some victims, while not always "frequently" returning to the hospital, did so every year or every other year throughout the 1960s. Since it can be supposed that only a small proportion of all violence reaches hospital records, most going unreported, the study might be seen to suggest that some people live with violent repeat victimization as part of their everyday lives, in some cases over their lifetime. The purpose of the study was to try to increase awareness of repeat victimization, with its cost to hospitals and public funds being of major concern. The earliest work to use a victim survey and concen- trate on repeat victimization was Eduard Zeigenhagen's The Recidivist
Victim of Violent Crime (1976). Zeigenhagen's study surveyed 268 vic- tims of attempted homicide, assault, rape, robbery, and aggravated robbery. Seventy-five persons, 28 percent of those surveyed, reported more than one violent victimization within the five years prior to the survey. Of these, most had been victimized twice, but fifteen, or 5.6 percent, had been previously victimized between three and six times. "Thus," Zeigenhagen concludes, "victimization appears to be a chronic condition for a subset of the recidivist group." This is an observation that recurs throughout the literature.
Preventing Repeat Victimization 479
in a population sampled with replacement. Sparks, Genn, and Dodd (1977) had conducted a victimization survey in three London boroughs and tried to fit a "contagious" Poisson model (where the probability of revictimization is increased by prior victimization), then moved on to a heterogeneous model. The heterogeneous model attempted to fit subgroups of the population, divided by, for example, age, gender, and ethnicity, to separate Poisson distributions, for which they had greater success, but concluded it was "far from perfect."
Hindelang, Gottfredson, and Garofalo (1978) used data from eight U.S. cities and over 165,000 interviews-though the chapter on revic- timization combines data from twenty-six different city surveys to give a database of 600,000 cases. The book is mainly known for developing the lifestyle/exposure theory of victimization (see Meier and Miethe 1993). However, the chapter on repeat victimization (they use the term "multiple victimization") acknowledges methodological difficulties studying revictimization. This is perhaps not surprising in that they were charting difficult and unknown criminological territory while try- ing to wield a data set of 600,000 person-cases from over 250,000 households across twenty-six cities. The logistical problems must have been considerable by any standards, even before the particular nuances of the study of repeat victimization could be considered. A primary difficulty seems to have lain in the problem of reconciling "series" and "nonseries" repeat victimization. They define a series offense as "three or more similar victimisations that occur to the same person during the [six month] reference period and for which the victim cannot recall details of the individual event" (Hindelang, Gottfredson, and Garofalo 1978, p. 126).
to have two series, each with three or more related incidents. The analysis separates these "series" incidents from nonseries repeated inci- dents. The exclusion of series incidents from the NCS analysis later prompted one of the consultants to the 1966-67 President's Commis- sion on Law Enforcement and Administration of Criminal Justice (in which the NCS finds its origins), to calculate the effect during the course of developing his own work on repeat victimization: According to Albert J. Reiss, Jr. (cited in Skogan 1981, p. 9): "including series incidents (for analyses of the NCS) would increase the estimated num- ber of crimes in the United States by 18 percent."
It is perhaps due to this that Hindelang, Gottfredson, and Garofalo state for both personal and property crime that the survey indicated "repetitive victimization" was an "extreme rarity" (1978, p. 127). Given their preamble about the rarity of repeat victimization-which was indeed borne out by their data and was the reason they increased the sample size for the analysis-it is perhaps a testimony to their largely unwritten recognition of these methodological issues that they devote a whole chapter of the book to the subsequent analysis. This seems the only plausible explanation, since otherwise it seems paradoxical to devote such extensive analysis, and not only analysis, but extensive publication space, to this "extreme rarity." It is further testimony to the work that, within the constraints imposed by the data set and method, some of the patterns that they discover and describe concur almost exactly with those that have been found by other studies. Hindelang, Gottfredson, and Garofalo established distinct patterns of repeat victimization that they summarized as follows:
First, both once-victimised persons and once-victimised households were more likely to have suffered subsequent victimisation
Preventing Repeat Victimization 481
For personal crime, Hindelang, Gottfredson, and Garofalo observed that "for simple assault, the unconditional likelihood of victimisation in the general population . . . was 15 per 1,000, but among victims of
aggravated assault the likelihood was 103 per 1,000. Similarly, the unconditional likelihood of aggravated assault was 12, but among victims of simple assault it was nearly seven times as great (82)" (Hindelang, Gottfredson, and Garofalo 1978, p. 132).
The same probability patterns were evident in their findings for property crime-a victimization by one type of property crime was a good predictor of victimization by another type of crime. More spectac- ular still, the findings held across personal and property crimes, where they found that, "overall, regardless of the age, marital status, or sex of the respondent, the likelihood of having been a victim of at least one personal crime was about twice as great for members of households that were victims of household crimes as for members of households that were not victims of household crimes" (Hindelang, Gottfredson, and Garofalo 1978, pp. 138-39).
In 1980, James Nelson followed up some of this work with analysis of U.S. National Crime Survey data. Unlike Sparks, Genn, and Dodd (1977), Nelson found that the heterogeneous Poisson or negative bino- mial model provided a good fit for the distribution of repeated burglary and robbery. It does seem highly plausible that while the whole popu- lation is far from homogeneous, when different subgroups of the popu- lation are investigated, these would have similar rates of revictimiza- tion. This is consistent with the lifestyle/exposure model of victimization. Nelson concluded that "the negative binomial model is consistent with the hypothesis that the probability of being victimized is constant over time and does not depend upon the number of prior victimizations, but that not all persons, businesses, and households have the same probability of being victimized ... [and that] regardless of the interpretation, the analysis shows that victimization rates are not unduly affected by small numbers of persons having unduly high rates" (1980, p. 870).
surveys to date (for examples, Skogan 1976, 1981, 1986a, 1986b, 1990a, 1990b), with a prominent role in the design and redesign of the NCS and a role in the design of the British Crime Survey. He has com- mented on the significance of repeat victimization in at least three papers. The first (Skogan 1990a) was an examination of the series inci- dents and the 18 percent of U.S. crime that (according to Albert J. Reiss, Jr.) went missing. Skogan summarizes the methodological limi- tations of the NCS for the study of revictimization when he writes: "[Series victimisations] were defined as groups of three or more similar incidents which respondents could not adequately differentiate in terms of their placement in time. Because incidents in this category are presumably too frequent and similar to be enumerated individually, they have been dealt with in the worst way possible-they are not counted at all. Series incidents (even the most recent episode, which is fully described in the interview) have always been excluded from analysis on the grounds their frequency is uncertain and that they might not all fall in the same NCS category. This of course makes a shambles of any effort to use the NCS to document the extent of multiple victimisation" (1990a, pp. 260-61).
So much for the U.S. National Crime Survey. Despite these criti- cisms, it is tempting to hope that the work which Hindelang, Gott- fredson, and Garofalo (1978) presented (the U.S. Cities Survey and the NCS were closely linked) may have developed some useful patterns even if they were based on extreme underestimates of the extent of repeat victimization. The decisive factor would be to determine whether the extreme underestimates of revictimization produced a bias in the results or just a large underestimation of the extent of the prob- lem. Skogan goes on to address the practical and policy implications of repeat victimization when he writes: "Repetitive victimisations are important for policy purposes because they are predictable from past reported crimes, they typically involve offenders who are immediately identifiable, intervention is possible, and they add disproportionately to the overall crime count" (1990a, pp. 259-60).
Preventing Repeat Victimization 483
and that on the worst estates businesses could expect to be victimised five times per year" (Skogan 1990b, p. 9). The skewed distribution of victimization in business crime is reflected in further work by Shapland (in this volume). Preventing repeated business crime is touched on in the next section with respect to the work of Tilley (1993a).
Other attempts were made to investigate repeat victimization through mathematical and statistical techniques. In an article that was a decade ahead of its time, Albert J. Reiss, Jr. (1980-two years after his methodological criticisms), using data from the U.S. National Crime Survey wrote: "Evidence of repeat victimization makes it clear that victimization is not a random occurrence. . . . Moreover, in repeat
victimization, there is a proneness to repeat victimization by the same type of crime" (1980, p. 52).
This was a finding echoed by Fienberg (1980), though using different methods of analysis. The two articles are complementary and were published in the same volume. Reiss constructed a crime-switch matrix to explore the difference between observed repeat victimization as re- ported in the NCS and repeat victimization that would be expected due to random chance. Fienberg used a semi-Markov model to observe the likelihood that a repeat victimization was of the same or a different crime type to a prior victimization. The recognition that one victimiza- tion incident may be followed by another of the same type has direct implications for crime prevention.
After 1980, revictimization does not seem to appear as a major sub- ject of study for most of the next decade. Unfortunately, this was also the decade that saw a boom in victimological study, so a large body of conceptually related work has developed largely without recognizing or accounting for revictimization. Where it was studied, revictimiza- tion was usually revealed and presented as subsidiary to the main topic of analysis. However, the works listed in table 1 all contribute to the development of the picture of revictimization. While no single refer- ence from the rest of table 1 may be convincing in its own right, the whole is greater than the sum of the parts. This is not intended as a criticism, since the works cited here are those exceptional ones that touched on the topic. It is difficult to state that table 1 presents an exhaustive list, since revictimization is often hidden within, or second- ary to, another subject of study.
repeat victimization, and that repeat victimization was most likely for assault (38 percent), followed by vandalism (37 percent) and burglary (24 percent). Much lower rates of repeat victimization were reported for theft from the person (17 percent), as might be expected for a relatively "anonymous" crime, though no information is provided with respect to repeat robbery. The apparently low frequency (15 percent) of repeat sexual offenses reported can probably be put down to the fact that those sexual assaults that are reported may be much more likely to be "stranger violence," with sexual assaults by men who are known, and which may be more likely to be repeated, going largely unreported. The higher rate of repeat victimization for all crime than for any of the individual types suggests repeat victimization can be by different types of crime as well as by the same type of crime.
Genn (1988) provides a shift away from the conventional definition of repeat victimization used so far in this essay. Genn provided an exacting critique of victim surveys that, she argues, impose a strict definition of "a crime" and "a victim" on the interviewee. In short, Genn's thesis was that most victim surveys undercount repeat victim- ization since they have only a one-year reporting period, limit the number of crimes that can be reported, and impose an artificial limit on those that are reported. Genn suggests that, in particular for certain types of crime such as domestic violence, some people are forced to live with almost continual victimization as part of their everyday lives. Genn returned to the research site of the survey detailed in Sparks, Genn, and Dodd (1977) to conduct some follow-up interviews. Genn's participant observation study of repeat victimization included spending several months with a group of victims on a high-crime estate in north London. Genn reports that, "after some months of association with this group of people, I no longer found it surprising that a structured questionnaire administered to one household should uncover some thir- teen incidents of 'victimization' " (1988, p. 93).
Genn argued that for some households, victim surveys often picked up only a fraction of the total incidents. Without presenting a direct recommendation about how it should be developed, Genn argues that criminology may need to reconceptualize the understanding of "a crime" as a single, isolated, or discrete event and the understanding of "a victim" as the victim of an isolated event.
Preventing Repeat Victimization 485
which it could be seen that the extent of revictimization varied by type of violent crime and that, since the concentration rate (ratio of inci- dence to prevalence) for "all" violent crime was greater than that from the sum of the individual crime types, then repeat victimization could also be by different types of violent crime. More recent evidence re- garding different types of crime is provided by Mayhew, Aye Maung, and Mirrlees-Black (1993) from the 1992 British Crime Survey. While only 5 percent of respondents reported a burglary, 83 percent of these reported only one, and the 6 percent of victims (1 percent of respon- dents) who reported three or more to the survey accounted for 17 percent of burglaries (Mayhew, Aye Maung, and Mirrlees-Black 1993, p. 49). Violent crime was analyzed by different types of violence for which rates of revictimization vary. The prevalence of violent crime was generally quite low, at or around 1 or 2 percent. However those people who were victims were much more likely to be repeat victims, with the 17 percent of victims who reported three or more violent incidents to the survey accounting for 45 percent of all incidents (1993, p. 86). Thefts involving cars in the United Kingdom were much more prevalent at 17 percent than either burglary or violent crime, but a similar pattern of revictimization occurs. The 8 percent of victims (1 percent of respondents) who reported three or more thefts involving cars accounted for 22 percent of all thefts involving cars (1993, p. 71). These findings are all subject to the conditions that a victim could report a maximum of five series of incidents (Mayhew, Aye Maung, and Mirrlees-Black 1993, p. 150), and series incidents were given an arbitrary top limit of five crimes (1993, p. 157), and that the BCS is a time-bounded survey (some incidents might be repeats of ones prior to the survey, and some may be predecessors of ones after the survey period). Each of these factors suggests the findings are underestimates of the extent of revictimization.
(victim support) workers thought they were unrelated; and in 13 cases the incidents were related (they were either domestic attacks, neighbour disputes, or the offender was known but did not live in the same flat or next door)" (Sampson 1991, pp. 6-7).
Referrals to Victim Support are also subject to what Maguire (1991, p. 408) calls the "huge filtering process" whereby, for a variety of reasons, less than 1 percent of crimes committed result in a visit from Victim Support. There is reason to believe that the filtering process would disproportionately affect repeat crimes in a similar way to re- corded crime (see Sec. VI), so that as a measure of the true extent of revictimization, Sampson's findings may be an extreme underestimate. In a survey of victims of assault at an accident and emergency hospi- tal in Bristol, Shepherd (1990) found that 43 percent of victims were repeat victims of assault. Of these, 27 percent reported involvement in more than two assaults, and 7 percent reported having been assaulted more than ten times. This distribution of violence mirrors the skewed distribution of crime found in other studies. Shepherd also studied social factors and suggested that repeat victims of assault are more likely to be unemployed, with 58 percent of unemployed respondents as repeat victims, compared to 38 percent of employed victims. In addition, Shepherd suggests that unemployed victims are twice as likely as employed victims to have experienced more than two previous assaults: 44 percent compared to 22 percent.
B. A "Survey of Surveys" Showing the Extent of Revictimization
Tables 2-6 show frequency distributions of victimization for five crime surveys, encompassing two decades. Table 2 shows the heavily skewed distribution of victimization found in the survey by Sparks, Genn, and Dodd (1977) that was conducted in 1973. Table 3 shows a previously unpublished distribution of victimization from a Home Of- fice local crime survey on a "high-crime" estate in South London. Further details of the estate and the work are given in Sampson and Farrell (1990).3 Tables 4-6 show frequency distributions from three sweeps of the British Crime Survey (BCS): 1982, 1988, and 1992. The BCS is a periodic survey averaging over 10,000 respondents. The comparison shows the similarity in the patterns between two local surveys and a national survey. While three tables from different British
TABLE 2
The Distribution of Repeat Victimization from a Survey of Three London
Boroughs in 1973: All Offenses
Number Respondents Incidents of Times (in Percent) (in Percent) Victimized (N = 545) (N = 582)
0 54.7 .0
1 22.0 20.6
2 10.3 19.2
3 7.3 20.6
4 2.0 7.6
5 or more 3.7 32.0
Total 100.0 100.0
SouRcE.-Sparks, Genn, and Dodd (1977), p. 89. NOTE.-The values do not correspond to those which would be generated solely from the table on p. 89 of Sparks, Genn, and Dodd (1977) but take account of the fact that it states "the total number of incidents reported by the sample in response to the screening questions was 582" (p. 74).
TABLE 3
Distribution of Repeat Victimization from a Survey of a "High Crime" Estate
in South London: All Offenses
Number Respondents
of Times (in Percent) Incidents Victimized (N = 600) (in Percent)
0 67.3 .0
1 16.5 21.2
2 6.5 16.7
3 3.7 14.1
4 3.5 18.0
5 or more 2.5 30.0
Crime Survey sweeps may make this look less like a survey of five surveys, they show the same national patterns across the course of a decade.
In the 1973 London study shown as table 2, 45.3 percent of respon- dents had been victimized on one or more occasions, and 23.3 percent of the population had been victimized more than once. The 3.7 percent of the population who said they had been victimized five or more times accounted for 32 percent of all incidents reported. This is perhaps the earliest study from which a numeric value can be put on the heavily skewed distribution of victimization and the first from which it can be inferred that while the majority of the population are not victimized, even among those who are victimized, a small minority of the victim- ized population experience a vastly disproportionate amount of all crime. This is to anticipate the result that is found across the next four surveys.
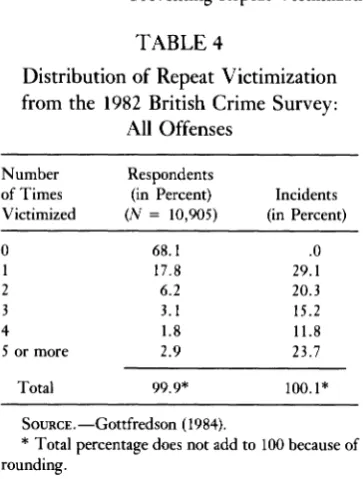
Table 3 shows a distribution of victimization that is extremely skewed. Six hundred people were interviewed in the survey. Repeat victims accounted for 78.8 percent of all crimes reported. In addition, the higher rate of repeat victimization on the "high-crime" estate than in the British Crime Survey corresponds with the findings of Trickett et al. (1992) that repeat victimization is more intense in high-crime areas. Other findings derived from the survey with respect to repeat victimization were that 5 percent of the respondents reported 62 per- cent of the personal crimes. Of the victims of personal crime, a third were repeat victims of personal crime, and one in six had experienced at least two different types of personal crime in the last year. A person or household reporting a burglary or attempted burglary was more than twice as likely to report a personal crime. In the "high-crime" estate victim survey, fifteen people (2.5 percent of respondents) re- ported 141 incidents (30 percent of total incidents) (Farrell 1992). The proportionate distribution of repeat victimization is slightly more con- centrated than that revealed by the survey of three London boroughs. Table 4 is from Gottfredson's (1984) analysis of the 1982 British Crime Survey. The extent of repeat victimization in the BCS is evident when he writes: "Of the victims of personal crime in the BCS, 72% were one time victims while 28% were repetitively victimised. For all crimes in the survey, the corresponding percentages are 56% one-time victims and 44% multiple victims" (1984, p. 42).
Preventing Repeat Victimization 489
[image:22.402.111.293.55.295.2]TABLE 4
Distribution of Repeat Victimization from the 1982 British Crime Survey:
All Offenses
Number Respondents
of Times (in Percent) Incidents Victimized (N = 10,905) (in Percent)
0 68.1 .0
1 17.8 29.1
2 6.2 20.3
3 3.1 15.2
4 1.8 11.8
5 or more 2.9 23.7
Total 99.9* 100.1*
SOURCE.-Gottfredson (1984).
* Total percentage does not add to 100 because of rounding.
made up only 14 percent of the population (total victimized respon- dents made up 32 percent). Further, 2.9 percent of the respondents reported 23.7 percent of the total incidents. From Gottfredson's origi- nal paper, similar patterns of the distribution of victimization for household offenses and personal offenses can also be generated.
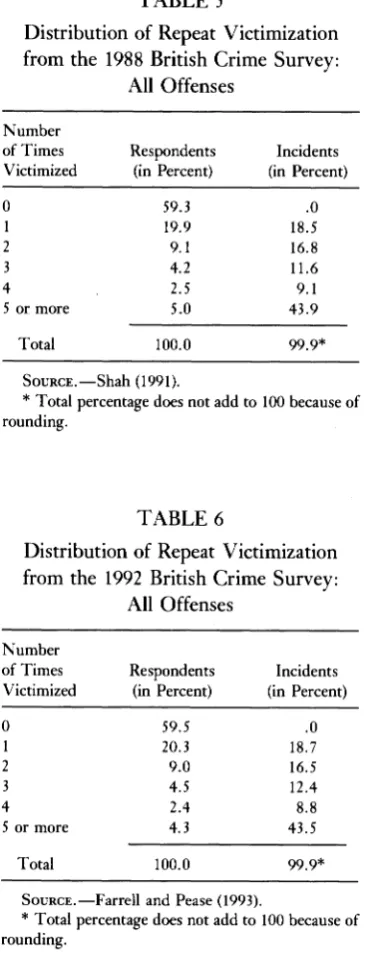
Table 5 shows the distribution of victimization for the 1988 British Crime Survey. The method by which the data were produced differs slightly from that for the 1982 survey. The 1988 analysis, as with the 1992 analysis in table 6, was conducted using "screener" or "filter" questions to the survey on the main questionnaire. The 1982 data were calculated by Gottfredson from the victim-form responses of victims. This methodological difference probably accounts for most of the dif- ference in findings between the 1982 survey and the two later sweeps of the BCS. It may also explain why the proportion of the population that is victimized at all is closer between table 2 (44.3 percent) and tables 5 (40.7 percent) and 6 (40.5 percent), since Sparks, Genn, and Dodd also used screener questions.
Distribution of Repeat Victimization from the 1988 British Crime Survey:
All Offenses
Number
of Times Respondents Incidents Victimized (in Percent) (in Percent)
0 59.3 .0
1 19.9 18.5
2 9.1 16.8
3 4.2 11.6
4 2.5 9.1
5 or more 5.0 43.9
Total 100.0 99.9*
SouRcE.-Shah (1991).
* Total percentage does not add to 100 because of rounding.
TABLE 6
Distribution of Repeat Victimization from the 1992 British Crime Survey:
All Offenses
Number
of Times Respondents Incidents Victimized (in Percent) (in Percent)
0 59.5 .0
1 20.3 18.7
2 9.0 16.5
3 4.5 12.4
4 2.4 8.8
5 or more 4.3 43.5
Total 100.0 99.9*
SoURcE.-Farrell and Pease (1993).
Preventing Repeat Victimization 491
seven-tenths of a percentage point. This suggests that there was little change in the inequality of distribution of victimization between the two surveys, a finding that also occurs in Section III on area crime rates and the revictimization curve, though through a slightly different analysis.
III. The Kirkholt Burglary Prevention Project
This section describes the first crime prevention project based on a revictimization prevention strategy. The Kirkholt burglary prevention project (Forrester, Chatterton, and Pease 1988a, 1988b; Forrester et al. 1990; Pease 1991, 1992) is presented at this stage in the essay in order to track the chronological development of the applied study of revictim- ization. To a large extent, the Kirkholt project acted as a catalyst for much of the more recent work on the prevention on repeat victimiza- tion that is presented in following sections.
A. Phase I: Devising Preventive Strategies and Implementation
Crime prevention through crime analysis (Ekblom 1988) is the phrase that springs to mind when the literature of the Kirkholt project is studied. Data and evidence were collected, common themes and factors of the problem identified, and specific prevention measures de- vised and introduced.
The Kirkholt project was situated on a public housing estate in Rochdale in the northwest of England. The initial research phase com- bined interviews with known (detained) burglars, interviews with bur- glary victims and their neighbors, and the analysis of available burglary data to find that, "once a house has been burgled, its chance of repeat victimisation was four times the rate of houses that had not been bur- gled at all" (Forrester et al. 1988b, p. 2289). While of a housing stock which was of a type that nationally had a medium burglary rate (Hough and Mayhew 1985), the Kirkholt estate had a recorded bur- glary rate double that for both recorded and unrecorded burglary for a high-crime housing type. The data generated by the research phase showed that nearly half of those households burglarized in December 1986 had been burglarized earlier in the year. It was evident to the project team that the prevention of burglary revictimization would prevent a large proportion of all burglary.
of both developments that were to come and the earlier suggestion that preventing revictimization may produce the conditions for the development of new, innovative, and cost-effective means of crime prevention. The Kirkholt approach was not one single method or tech- nique to prevent burglary. It was a package of measures that united under the general banner "the prevention of revictimization."
The strategies devised depended on the specific problems identified. The research phase showed that the taking of money from electricity and gas prepayment meters was a factor in many of the burglaries (49 percent). The meters were sitting targets for burglars since they were emptied only every three months and so could accumulate large amounts of money. To prevent revictimization, the relevant utility services agreed to replace meters after a burglary, with the agreement of the householder. A second factor in many burglaries was the relative ease with which burglars appeared to enter premises, invariably by the first route attempted. To prevent revictimization, when a house- hold was burglarized, it would receive a security upgrade, and valu- ables in the home were property marked by postcoding. The security upgrading was not of a general nature but was specific to the means of entry that were described by both burglars and victims. An estate-wide burglary monitoring system was set up so that security upgrading could be revised to reflect changes in burglary practice. In order to reduce the opportunity for revictimization, around households that had been burglarized, small neighborhood watches were developed, consisting of immediate neighbors and called "cocoon" neighborhood watches. Neighbors were asked to watch out for burglars returning to the victimized household: the watches were specifically set up and specifically focused rather than general, as in the case of previous Neighbourhood Watch schemes. As an incentive, neighbors were also provided with security upgrading. Victims were provided with infor- mation on services available in the local area.
The rate of burglary on the Kirkholt estate fell to 40 percent of its previous level after five months of the start of the program. Revictim- ization fell to zero over the same period and did not exceed two in any of the following months.
B. Maintenance and Continuation
Preventing Repeat Victimization 493
became part of the local housing authority routine that burglarized properties were given priority for repairs. Other elements included a school-based crime prevention program, provision of offenders from the area to attend groups to address their problems, a cheap savings and loan scheme for residents, and better-informed probation officers and courts.
The lower burglary rate on the estate was maintained, and the proj- ect became "owned" by the community after the research team with- drew. The reports suggested that displacement of burglary did not occur to a great extent. The burglary rate in surrounding areas dropped, but not to the extent that it did in Kirkholt.
burglaries. This is a view largely supported by Nick Tilley's appraisal of three putative replications of the Kirkholt project that are discussed below.
2. Putative Kirkholt Replications. Replication is a form of evaluation since it tests the external validity of a project. Tilley (1993b) evaluated three efforts at preventing residential burglary that purported to repli- cate the Kirkholt project and were undertaken as part of the United Kingdom Safer Cities Programme. The first project focused on bur- glary and experienced increases of 21.5 percent and 42.8 percent in burglary incidence in the two years of the project, though these rises were much lower than those of adjoining areas. The second produced an apparent large drop in burglaries, and the third a rise of 9 percent in burglary incidence compared to a rise of 139 percent in the rest of the police division. Tilley appraises the manner in which they attempted to "replicate" Kirkholt. None of the projects had nearly as high a burglary incidence rate as Kirkholt when they started, and Tilley concludes that
[Putative Replication 1] is a replication of Kirkholt only in the sense that it used a similar repertoire of methods that were tailored to the local situation, which had been subject to systematic
examination. The differing outcome patterns are to be expected. Whatever these had been they could neither confirm nor disconfirm the findings in Kirkholt.
In the case of [Putative Replication 2], though the outcome pattern was similarly successful to that in Kirkholt, the context, measures and mechanisms differed radically. It cannot be considered a replication in scientific realist terms of any or all of Kirkholt, and thus its success is of no confirmatory value.
[Putative Replication 3] . . . comprised an offer of security
upgrading to those in the area already victimised whose risk of reburglary was shown thereby to be reduced. Though the crime rate was not as high as in Kirkholt, there was a similar decrease in burglary risk amongst those already victimised following target hardening. Some linked elements of context, measure, mechanism and outcome patterns are similar, and thus there is partial
replication in scientific realist terms. [Tilley 1993b, p. 17]
Preventing Repeat Victimization 495
tion of replication can be as narrow or as wide as the replicator so wishes. Tilley proposes scientific realist replication: "rather than at- tempting to mimic a large number of 'attributes,' 'variables,' 'condi- tions' and so forth from one trial to the next the trick is to recognise and to reproduce those salient features of the context which are needed for the [crime prevention] mechanism/s to be activated" (Tilley 1993b, p. 14).
3. Preventing Revictimization as a General Crime Prevention Strat- egy. Whatever the differing opinions about the Kirkholt project, it played a pivotal role in the development of subsequent research into revictimization and its prevention. The project prompted Pease (1991, 1992) to conclude that the prevention of revictimization might be an attractive general crime prevention strategy. The approach would have certain advantages, including
- Attention to dwellings or people already victimised has a higher "hit rate" of those likely to be victimised in the future.
- Preventing repeat victimization protects the most vulnerable social groups, without having to identify those groups as such, which can be socially divisive. Having been victimised already probably represents the least contentious basis for a claim to be given crime prevention attention.
- Repeat victimization is highest, both absolutely and proportionately, in the most crime-ridden areas (Trickett et al.
1992), which are also the areas that suffer the most serious crime (Pease 1988). The prevention of repeat victimization is thus commensurately more important the greater the area's crime problem.
- The rate of victimization offers a realistic schedule for crime prevention activity. Preventing repeat victimization is a way of "drip-feeding" crime prevention.
- Even from the unrealistic view that crime is only displaced, avoiding repeat victimization at least shares the agony around (see Barr and Pease 1990; Pease 1991, p. 76).
nomenon of repeat victimization. The "drip-feeding" of crime preven- tion is an analogy created to suggest that targeting repeat victimization is more practically viable-it is spread through time and hence less labor intensive and easier to maintain.
IV. Increasing the Accuracy of the Revictimization Predictor
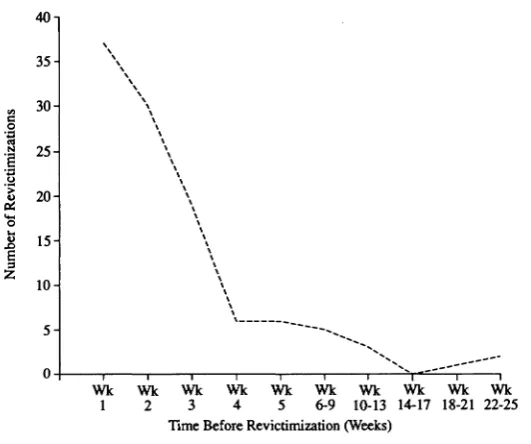
This section presents the major refinements of the revictimization pre- dictor that have arisen to date. A study that shows how design can be influential in determining the likelihood of revictimization in some instances is first covered. The evidence on the role that repeat victim- ization plays in the relationship between low- and high-crime areas is then reviewed, and it is suggested that the revictimization predictor might be refined according to the overall level of crime in an area. Last, existing studies showing that revictimization is likely in the immediate aftermath of a crime are covered and the implications for crime preven- tion are discussed.
A. Revictimization and Design
The influence of architectural and environmental design on the crime rate has long been the focus of attention in crime prevention (see, e.g., Clarke and Mayhew 1980). However the impact of design on repeat victimization is not well documented. That certain buildings may be more likely to be repeatedly victimized as well as victimized could have important prevention implications if they can be identified. Hope (1982) presented data on the extent of repeat victimization in schools that precedes other work on the subject by a decade (Burquest, Farrell, and Pease [1992] and Tilley [1993a] are discussed later in this section). Hope's first startling finding is that "a school or college is 38 times more likely to be burgled than a residential dwelling" (1982, p. 1).
Preventing Repeat Victimization 497
provided a conservative estimate of the extent of the crime (Hope 1982, pp. 2-3). The extent of repeat school burglary is evident later in the text when Hope writes, "Some 38 schools (64%) had less than five burglaries between 1977 and 1978 including 11 schools (19%) which had no burglaries at all. In contrast, 19% had 10 or more burglaries each during this two year period. The most victimised school had 24 burglaries."
Moreover, Hope develops a "design continuum," grouping the schools in the study into one of three categories according to size, area of site, number of buildings, age, and so forth, using thirteen factors in total. The average number of burglaries per school was calculated for each design category. Schools within the three categories averaged 1.4, 5.1, and 7.9 burglaries each for the two-year study period. In essence, Hope had refined the predictability of revictimization in schools according to thirteen design criteria. Perhaps a study that up- dated Hope's 1982 work could use a revictimization predictor to inform the efficient allocation of resources for both crime prevention and of- fender detection. There is a need for other studies covering design factors and their importance in refining the predictability of revictim- ization. This could be true for both residential and commercial bur-
glary. Similarly, design factors in relation to motor vehicles could also be important. While it has long been recognized that certain makes of car are more likely to be victimized (e.g., Clarke and Harris 1992), whether or not incidence increases disproportionately in relation to prevalence remains to be empirically determined.
B. High-Crime Areas and Repeat Victimization
Trickett et al. (1992), broach the important question whether certain areas have high crime rates because more people are victimized or because there is more revictimization of the same people. The evidence is presented here as figure 1 using area data from the first three sweeps of the British Crime Survey-1982, 1984, and 1988. The data were grouped into deciles according to crime incidence. The 10 percent of areas with the lowest crime incidence rate are decile 1, the 10 percent of areas with the next lowest incidence rates are decile 2, and so on.4 The resultant curves are shown for personal and property crime. The raw data and the regression equations are presented in the Appendix.
180 - 180- 1982
160-
Property +--1988
1988 - --1984
140-
+--1982 S4--1984
120-
o 100-
8 Personal
O 80
60-
40-
20- PR
0
1 3 5 7 9 11 13 15 17 19 21 23 25 27 29 31 Area Prevalence Rate
FIG. 1.-Area revictimization curves (British Crime Survey data-personal and prop-
erty crime, 1982, 1984, 1988). Source: Farrell and Pease (1993).
For both of the crime types, there is consistency of both position and curvature across each of the surveys. This consistency suggests the findings can be viewed with a high degree of confidence.
In figure 1, revictimization exists where crime incidence is greater than crime prevalence. A state of no revictimization is shown by the line IR = PR (incidence rate = prevalence rate). Since the areas under each curve represent total victimization, at a glance it is evident that revictimization constitutes a large proportion of all victimization. How- ever, for areas with higher crime prevalence (more victims per head), this is disproportionately the case. Trickett et al. (1992) conclude that there is a positive nonlinear correlation between the overall incidence of crime and the extent of revictimization (well beyond what would be expected by a random process). As a consequence, the accuracy of the revictimization predictor will correlate with area crime prevalence and incidence rates; or, the higher an area's crime rate, the higher the rate of repeat victimization.
[image:31.402.45.363.50.318.2]Preventing Repeat Victimization 499
prevent more crime per unit of investment merely because there is more crime. However, figure 1 shows that the rewards to the preven- tion of revictimization may be disproportionately high in high-crime areas. With an increasingly accurate predictor, the opportunity for preventing revictimization is commensurately greater. The identifica- tion and focusing of prevention on highly predictable crime appears potentially efficient in such areas. As a refinement of the predictor, a revictimization prevention policy in high-crime areas could be expected to be even more efficient in terms of crimes prevented (as well as per unit of labor and expenditure) than focusing on revictimization across all areas. Tables showing the area decile counts of crimes and victims and the incidence and prevalence rates used in figure 1 are in the Appendix. The greatest increase in revictimization appears between the ninth and tenth deciles, so that preventing revictimization would be at its most efficient in the 10 percent of areas with the highest crime incidence.
It may also be that across crime type, revictimization is more likely in higher-crime areas. Given the empirical finding that personal crime is more likely when property crime has been experienced and vice versa, in the light of the above evidence, it would not be unreasonable to expect that this relationship grows stronger as overall crime levels increase. Further research, for example, a development of the British Crime Survey area analysis, might be able to tease out the nature and interactive effects of this relationship. While the focus of this essay largely precludes the causes of repeat victimization (Farrell [1994b] addresses causality for specific crime types), a possible rationale for an "across crime-type revictimization area-effect" might be found through a quick look at recent criminal career research. Farrington writes of the London longitudinal survey that "it was concluded that offenders did not specialize in violence ... [and] violent offenders are essentially frequent offenders" (1992a, p. 21).
This could provide one explanation for the likelihood that victims are revictimized both by a different type of personal crime or by a property crime.