Open Access
Research article
Profiling quality of care: Is there a role for peer review?
Timothy P Hofer*
1,2, Steven M Asch
3,4,5, Rodney A Hayward
1,2,
Lisa V Rubenstein
3,4,5, Mary M Hogan
1, John Adams
5and Eve A Kerr
1,2Address: 1Veterans Affairs Health Services Research and Development Center of Excellence, Veterans Affairs Ann Arbor Healthcare System, Ann
Arbor, Michigan, USA, 2Department of Internal Medicine, University of Michigan, Ann Arbor, Michigan, USA, 3Veterans Affairs Greater Los Angeles
Health Care System, Los Angeles, California, USA, 4Division of General Internal Medicine, David Geffen School of Medicine at UCLA, Los Angeles
CA, USA and 5Rand Health Program, Rand Corporation, Santa Monica, California, USA
Email: Timothy P Hofer* - [email protected]; Steven M Asch - [email protected]; Rodney A Hayward - [email protected];
Lisa V Rubenstein - [email protected]; Mary M Hogan - [email protected]; John Adams - [email protected]; Eve A Kerr - [email protected] * Corresponding author
Abstract
Background: We sought to develop a more reliable structured implicit chart review instrument for use in assessing the quality of care for chronic disease and to examine if ratings are more reliable for conditions in which the evidence base for practice is more developed.
Methods: We conducted a reliability study in a cohort with patient records including both outpatient and inpatient care as the objects of measurement. We developed a structured implicit review instrument to assess the quality of care over one year of treatment. 12 reviewers conducted a total of 496 reviews of 70 patient records selected from 26 VA clinical sites in two regions of the country. Each patient had between one and four conditions specified as having a highly developed evidence base (diabetes and hypertension) or a less developed evidence base (chronic obstructive pulmonary disease or a collection of acute conditions). Multilevel analysis that accounts for the nested and cross-classified structure of the data was used to estimate the signal and noise components of the measurement of quality and the reliability of implicit review.
Results: For COPD and a collection of acute conditions the reliability of a single physician review was quite low (intra-class correlation = 0.16–0.26) but comparable to most previously published estimates for the use of this method in inpatient settings. However, for diabetes and hypertension the reliability is significantly higher at 0.46. The higher reliability is a result of the reviewers collectively being able to distinguish more differences in the quality of care between patients (p < 0.007) and not due to less random noise or individual reviewer bias in the measurement. For these conditions the level of true quality (i.e. the rating of quality of care that would result from the full population of physician reviewers reviewing a record) varied from poor to good across patients.
Conclusions: For conditions with a well-developed quality of care evidence base, such as hypertension and diabetes, a single structured implicit review to assess the quality of care over a period of time is moderately reliable. This method could be a reasonable complement or alternative to explicit indicator approaches for assessing and comparing quality of care. Structured implicit review, like explicit quality measures, must be used more cautiously for illnesses for which the evidence base is less well developed, such as COPD and acute, short-course illnesses.
Published: 19 May 2004
BMC Health Services Research 2004, 4:9
Received: 05 February 2004 Accepted: 19 May 2004
This article is available from: http://www.biomedcentral.com/1472-6963/4/9
Background
Assessing the quality of health care for populations of patients over time is a major challenge facing health sys-tems and health insurers [1,2]. Increasingly, quality meas-urement for such populations focuses on chronic illnesses and is carried out using explicit, or pre-set, review criteria or indicators. The widely used indicators approach to quality assessment (e.g., Health Plan Employer Data and Information Set HEDIS 2000) addresses chronic disease management for an ever-growing number of chronic dis-eases such as hypertension, diabetes, and depression [3]. For a variety of reasons, however, explicit indicators have not entirely replaced the other principle method for assessing quality of care, implicit peer review, throughout the healthcare, regulatory and legal system.
Implicit peer review relies on expert judgment of the qual-ity of care for an individual patient case. In its most rigor-ous implementation, structured implicit review (SIR) has been an important tool for measuring quality of care in research [4-13]. Implicit review, as carried out by Medi-care Peer Review Organizations, was widely used to try to prevent abuse arising from application of prospective pay-ment for hospitals [14]. While Medicare and the Peer Review Organizations have increasingly emphasized explicit process measures over implicit record review by physicians [15,16], there is still nearly universal use of implicit review by hospitals and physician groups in cre-dentialing and determining clinical privileges [17,18]. A form of implicit peer review by expert physicians is the only method of assessing standard of care consistently used in malpractice litigation.
The continued use of implicit review is most likely due to the ease of development and administration of the method, its face validity, and its ability to self-update through use of current experts, to reflect the full scope of clinical decisions that may apply to a particular patient, and to involve physicians in the quality of care process. These are areas in which explicit indicators such as HEDIS can be criticized for falling short. Of concern, however, is the well-documented low reliability of peer review meth-ods, particularly those that are unstructured, and the lack of testing of the method for review in the outpatient set-ting, where the majority of care is delivered for chronic illnesses.
The estimated reliability for the measurement of overall quality of care in the published literature, even when using SIR, is generally poor, in the range of 0.2 to 0.3 [6,9,12,13,19,20] with two studies citing reliability of 0.5 [5,7]. Even more variable estimates of reliability are obtained for rating specific components of care or other settings of care [10,11,21,22]. One source of variation in reliability estimates is the numerous methods employed
for quantifying reliability. Most studies of implicit review report simple kappa statistics or correlations and none consider the cross-classified nature of the data (a review is nested within patients crossed with reviewer). Most ignore the tendency for some reviewers to consistently judge more harshly or leniently than other reviewers. When studies do consider these reviewer effects, they estimate them in a way that does not readily allow the reliability findings to be generalizable to other reviewer populations (by using fixed instead of random effects in the analysis) [23,24]. Finally, few published reliability studies examine how reliability is affected by diagnosis or care delivered over an extended period of time. Understanding the con-ditions under which implicit review functions well may be critical to improving the capabilities and use of the method.
This study evaluates structured implicit review of outpa-tient and inpaoutpa-tient care over a one year period for a pop-ulation of patients by evaluating care for three chronic illnesses and for rapid onset, short course acute illnesses. We developed a new structured implicit review instru-ment drawing on previously tested instruinstru-ments [5,10,20]. We selected reviewers well versed in evidence based prin-ciples of practice and trained them to emphasize evi-dence-based care in their reviews. We addressed limitations of previous studies in two ways. First we tested the effects on implicit review of the quantity and quality of the evidence base for a condition by comparing review reliability for two conditions (diabetes, hypertension) for which the quality of care evidence base is substantial to two others for which it is limited (COPD, acute illnesses). Second we evaluated the relative importance of several sources of variability in implicit reviews using generaliza-bility theory (an extension of classical test theory) [25]. With these techniques, extraneous sources of variation can be identified and potentially removed, leading to signifi-cant improvement in the measurement properties of implicit review.
Methods
Study sample and data collection
thirteen-month period: September 1, 1998 to September 30, 1999.
Reviewer selection and training
Selection of reviewers
Reviewers were required to be trained, board certified internists (American Board of Internal Medicine) with current or recent general or internal medicine outpatient experience and to be conversant with principles of evi-dence-based medicine. This latter qualification was assessed through the use of a screening questionnaire and discussions with one or more clinicians listed as refer-ences by the applicants for the reviewer positions [see Additional file 1]. All were one or more years beyond res-idency. Although primarily in academic positions, they worked in a variety of practice settings and two different geographic locations. They were solicited by flyer, email and word of mouth. Only one had previously done qual-ity related record reviews and none was a professional reviewer.
Description of the training
Each reviewer completed sixteen hours of training. The reviewers were instructed to imagine that, for each case reviewed, the patient was a new patient in their practice and coming with the documentation of the last 1–2 years of their care. For each of the conditions they were asked to assess the diagnosis and assessment of the initial presen-tation of the condition (if it occurred during this period), assessment and monitoring the course of the condition,
treatment of signs or symptoms, exacerbations or compli-cations, and follow-up. They were then asked to provide an assessment of the quality of care. In providing this assessment they were to consider how the care compares to what would be provided in a typical US community practice with respect to appropriateness, timeliness and quantity. In particular was the care appropriate, or was there overuse, misuse, or underuse? They were further to consider the importance of any overuse, underuse, or mis-use. That is, if care was not completely appropriate, they were asked to consider whether the problems were likely to result in worse outcomes for a typical patient with the medical problem. They were instructed to focus on the process of care, and links supporting causal connections between processes and outcomes, and not the outcomes themselves. Then they rated the overall quality of care on a six-point scale.
Review process
Reviews took place in Ann Arbor and Los Angeles over a 6 month period from October 2001 to March 2002. The reliability sub-study took part within the larger job of reviewing the 621 charts from the parent study. Reviewers were unaware of which records were chosen for the relia-bility analyses. During the review, reviewers were able to scan available records prior to the study period (October 1, 1997 to August 31, 1998), but were instructed that their review should focus on care provided during the study period.
[image:3.612.54.556.467.653.2]Design
Table 1: Mean ratings and distribution of reviews across conditions
Reviewer HTN‡ COPD§ Diabetes Acute Care Total Mean rating (s.d)
A 11 9 8 12 40 3.28 (1.11)
B 15 12 8 10 45 3.13 (1.20)
C 14 7 9 11 41 3.15 (1.37)
D 13 9 9 12 43 3.58 (1.61)
E 11 9 7 12 39 3.33 (0.58)
F 12 8 11 10 41 2.24 (1.18)
G 10 8 9 9 36 3.78 (1.29)
H 10 8 8 8 34 3.15 (0.93)
I 14 10 12 6 42 3.26 (0.91)
J 17 10 9 17 53 3.40 (0.77)
K 12 8 8 9 37 3.38 (0.59)
L 14 7 9 15 45 3.29 (1.38)
Total 153 105 107 131 496
# unique records † 56 40 37 59 70
Mean rating (s.d)* 3.46(1.20) 3.09(0.96) 3.46(1.30) 2.94(1.07) 3.25 (1.16)
The reliability study consisted of 12 physicians reviewing 70 patient records. Each patient record may have been reviewed for more than one condition. For example, 56 out of the 70 total records were reviewed for the quality of hypertension care and 59 were reviewed for acute care. For each patient record, three out of the 12 physician review-ers filled out between one and four condition specific instruments giving a total of 496 reviews over the whole sample. Assignment of reviewers to cases was random but stratified to balance each reviewer's appearance across the conditions and condition combinations. Three different reviewers reviewed each of the 70 cases. Table 1 shows the distribution of patients, conditions and reviews.
Data analysis
Our one pre-specified hypothesis was that the reliability of physician review, as measured by the intraclass correla-tions, would be significantly larger for the hypertension and diabetes quality ratings than for the COPD and acute conditions. Our model simultaneously examines reliabil-ity across the four separate domains of hypertension, COPD, diabetes and acute care management in a MANOVA style analysis. The model also accounts for the clustering of multiple reviews and multiple conditions within patient and the fact that each reviewer reviewed overlapping subsets of the 70 patients. We used a cross-classified, random effects model implemented in MLwiN. This analysis assumes that the rating data are normally distributed which appears warranted by the distribution plots illustrated in Figure 1. Details of the estimation method and model selection are described in the Appendix.
The analysis provides us with the variability of the true quality rating across patients, the variability in how each reviewer rates quality and the variability contributed by the undifferentiated noise in the measurement. The intra-class correlation (ICC) we report is the variability of the true quality rating divided by the total variability in the ratings (or the sum of all three sources of variability). The ICC can be interpreted as the proportion of variance that is due to the true differences in quality across patients. However, it is also the correlation between ratings that would be expected when two random reviewers rate the same record, and thus, it describes the reliability of a sin-gle review by a sinsin-gle randomly selected reviewer. (see the appendix for further details about calculating ICCs).
Results
Distribution of reviews and mean ratings
The distribution of reviews across conditions and review-ers is shown in Table 1. Reviewreview-ers were represented fairly evenly across conditions, reviewing between 7 and 17 cases each. There was considerable overlap of conditions across patients with most records being evaluated for
more than 1 condition. 12 records were evaluated for all four conditions, 31 records had three conditions, 24 records had 2 conditions and 3 records had only one of the four conditions. Thus while there are 70 total unique records, for each condition there are between 37 and 59 unique records that were reviewed.
The mean overall rating was 3.25 on a 1 to 6 scale, with a score of 1 assigned for very good care and a score of 6 assigned for very poor care. The reviewers used the entire six point scale given, with the distribution of ratings by condition shown in Figure 1. Table 1 also suggests differ-ences in the mean ratings by reviewer and by condition.
Regression model
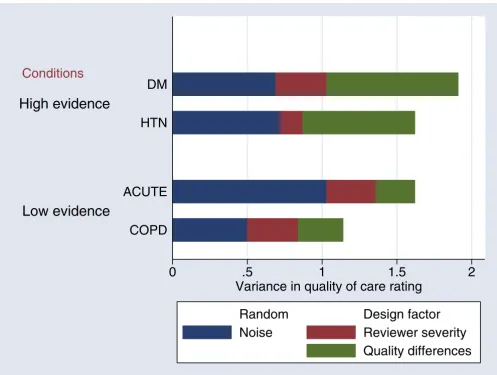
The results of the analysis using the full model are shown in Table 2. Variation at the patient level represents the true score differences in physician assessed quality of care across patient records in regard to the management of a particular condition. The true score is the rating that would be obtained from an infinitely large number of reviews and reviewers who were drawn from the popula-tion represented by our sample of reviewers. Variapopula-tion at the reviewer level represents the idiosyncratic differences in opinions between physician reviewers and the extent to which some reviewers may have systematically higher or lower ratings than other reviewers across all records for a given condition. Variation at the review occasion level (repeated measurements of the same record) is termed "noise." It can be thought of as a reflection of the difficulty of the evaluation task. If it is hard to say whether the care provided is good or not, then there will be more noise. The relative size of the variance components for the true score, reviewer and noise are shown graphically in Figure 2.
We found that the true score variation (variance) in qual-ity of care at the patient level for hypertension was 0.75
(thus the true score standard deviation is = 0.87, see Table 2). Consequently, we would predict that if reviewer ratings were averaged over a large population of reviewers similar to ours, 95% of the ratings would fall within 1.7 units (two standard deviations) in either direc-tion of the average rating of 3.4 found for hypertension. That represents a range that is between poor and good and provides evidence that, even after accounting for the measurement error of this instrument, there are important differences in the quality of hypertension care. There is a comparable amount of variation due to noise (0.72) and a relatively small amount of variation due to systematic differences across patients by reviewer in their assessment of quality (0.15) indicating good agreement in the stand-ards applied by the reviewers. The reliability of a single review for detecting differences in quality of hypertension care across patients is 0.46. Averaging as few as 5 reviews
of a single patient record would allow you to produce a rating of the quality of hypertension management for that patient with a reliability of 0.80, a level generally felt to be adequate for making decisions based on a measure [26]. The diabetes care evaluation works in very similar ways to the hypertension one discussed above (Table 2).
On the other hand, the structured implicit review of COPD care produced a true quality rating with a smaller variance of 0.30 (s.d. .55). This implies that 95% of patients with this condition experience care whose quality is rated between good and borderline. When the range of quality is narrow it becomes less clinically interesting to
try to search for reasons for the differences in quality across patients or to profile providers. While the noise component is also smaller when compared to the hyper-tension ratings, implying that the evaluation problem is not inherently more difficult, it shrank less than the true quality differences. Thus the reliability of a single review (true score variance over the total variance) is much smaller at 0.26 and over twice as many reviews would be required to generate a reliable quality measure for the management of COPD for a patient (12 reviews for a reli-ability of 0.80).
Distribution of quality ratings by condition
Figure 1
Distribution of quality ratings by condition This figure illustrates the distribution of ratings by condition for all the reviews done for that condition. Thus there are multiple observations per patient. The fact that ratings are clustered by reviewer and patient is not accounted for in this figure. The entire scale was used for each condition. A normal density for the observed mean and standard deviation is superimposed on the histogram of the actual distribution of ratings. The conditions are hypertension (HTN), diabetes, chronic obstructive pulmonary disease (COPD), and acute conditions.
0
.5
0
.5
1 2 3 4 5 6 1 2 3 4 5 6
HTN
COPD
Diabetes
Acute Conditions
Actual density
Normal density
Density
Ratings by condition
There is also less detectable systematic difference in the true quality of acute care management across patients (variance 0.26) than for diabetes or hypertension. In addi-tion there is a substantially larger amount of random noise (1.03). Overall, the reliability of a single review is 0.16 making the instrument much less practical for the purpose of estimating the quality of care in a panel of patients (requiring 30 reviews to achieve a reliability of 0.80). Furthermore, the idiosyncratic evaluations of acute care management of the individual reviewers vary more widely (reviewer variance = 0.33) than the aspects of acute
care management that they can agree upon (true score patient variance = 0.26).
The estimation techniques we used allowed us to produce an empirical confidence interval for the reliability of each instrument (shown in Figure 3). As per our primary hypothesis, the hypertension and diabetes instruments taken together were significantly more reliable than the COPD and acute care instruments as shown by the non-overlapping confidence intervals. Furthermore, the patient level variance components for diabetes and hyper-tension were significantly larger than those for COPD and
[image:6.612.57.554.85.459.2]Variance components of medical record review
Figure 2
Variance components of medical record review The sources of variability in physician assessments of quality of care based on reviews of the medical record are shown here, stratified by the levels of evidence available for decision-making. The much larger amounts of signal or true quality differences in reviews of the high evidence conditions will produce measurements that are more reliable. For the low evidence conditions, the noise component is quite large for the reviews of acute conditions and the reviewer components are relatively large for both the acute and COPD conditions. The conditions are hypertension (HTN), diabetes mellitus (DM), chronic obstructive pulmonary disease (COPD), and acute conditions.
Conditions
0
.5
1
1.5
2
Variance in quality of care rating
Low evidence
High evidence
COPD
ACUTE
HTN
DM
Random
Design factor
Noise
Reviewer severity
acute conditions (Wald chi squared test 3.62, p < 0.007) suggesting that the improved reliability is largely a result of the reviewers being able to distinguish a greater difference in the quality of care across the diabetes and hypertension patients.
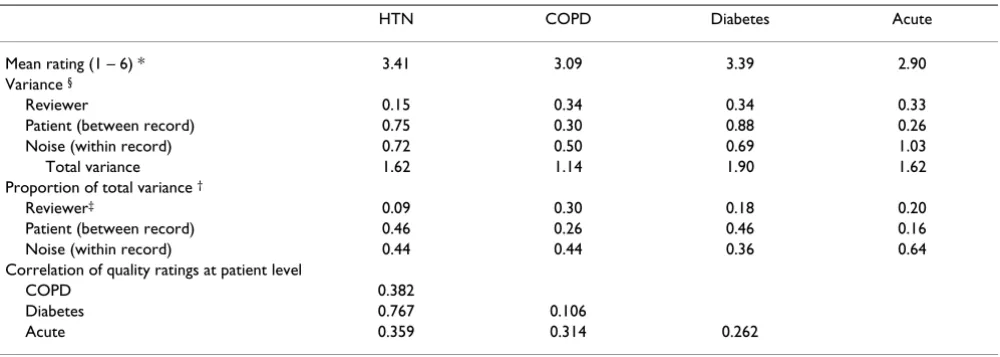
The correlations between the ratings of quality of disease management are also shown in Table 2. The patient rat-ings of diabetes and hypertension are correlated fairly highly at 0.77 as might be expected given that there is con-siderable overlap in the indicated processes of care for the two conditions. The correlations between all other pairs of ratings are in the low to modest range 0.11–0.38, indicat-ing that there is different information about disease man-agement that is being evaluated for the different disease management domains. These correlations are corrected for any attenuation that would occur due to the measure-ment error in the instrumeasure-ments and represent the correla-tions between the 'true' ratings (as defined above).
Discussion
There are a number of important conclusions that one can draw from this work. First, we have shown that using structured implicit review it is possible to obtain ratings of the management of chronic diseases over an extended period of time and settings of care and that these ratings can have reasonably high reliability. Second, as we hypothesized, those conditions for which the evidence base is most developed, diabetes and hypertension, were the ones in which we were able to achieve the highest
lev-els of reliability. Third, the analytic approach that we espouse offers an important advance in assessing quality measurement tools by allowing us to draw substantive conclusions about how and for which conditions to attempt to measure quality of care using structured implicit review.
Using structured implicit review for evaluation of the continuum of care
Most physician peer review is done in hospitalized patients. While there is a recent RAND publication describing an outpatient implicit review instrument [27], there are no peer-reviewed published reliability studies of instruments used outside of the hospital setting and no structured implicit review instruments designed to meas-ure quality across the continuum of care (over time and including inpatient and outpatient care). Yet to measure chronic disease care in particular, with its long-term objec-tives and multiple providers, this is the frame of interest.
[image:7.612.56.556.99.277.2]For diabetes and hypertension, we achieved reliability measures that are as high as any published and that reflect an instrument that could produce a reliable estimate of the quality of disease management for a particular patient with as few as 5 record reviews. It is important to remem-ber that the reliability of an instrument for distinguishing between patients does not tell us the reliability of using average scores across patients to distinguish between sites or physicians [28]. While we know that patient satisfac-tion and a number of individual quality measures have
Table 2: Sources of variation and reliability of quality assessments by physician implicit review
HTN COPD Diabetes Acute
Mean rating (1 – 6) * 3.41 3.09 3.39 2.90
Variance §
Reviewer 0.15 0.34 0.34 0.33
Patient (between record) 0.75 0.30 0.88 0.26
Noise (within record) 0.72 0.50 0.69 1.03
Total variance 1.62 1.14 1.90 1.62
Proportion of total variance †
Reviewer‡ 0.09 0.30 0.18 0.20
Patient (between record) 0.46 0.26 0.46 0.16
Noise (within record) 0.44 0.44 0.36 0.64
Correlation of quality ratings at patient level
COPD 0.382
Diabetes 0.767 0.106
Acute 0.359 0.314 0.262
quite low reliabilities at the physician level [28-30], no study has reported a reliability for the use of the structured implicit review instrument in physician profiling. To esti-mate how many patients would be required to produce reliable physician or site quality estimates, we would need to assess the variability across another dimension, the site of care or the provider.
Nevertheless, we can say that if the true differences between physicians or sites of care, averaged across their patients, are on the same order as that seen across patients in this study (that is ranging from poor to good), then a
relatively small sample of 5–10 reviews would be suffi-cient to characterize the care for that site of care for condi-tions with a good evidence base for practice. Of course if the range of average ratings for physicians or sites of care is much smaller (e.g. clustered around "adequate-good" care) then the reliability for distinguishing between sites of care or providers will be much less, and a larger sample would be required. However, if all of the care is at a simi-lar level across sites, then distinguishing between them becomes much less important [28].
Reliability of a single physician review of a patient record for detecting quality differences
Figure 3
Reliability of a single physician review of a patient record for detecting quality differences This figure presents the reliability (intraclass correlation coefficients) of a single implicit review for detecting differences in true quality across patients. At the top, the conditions with a more developed or high evidence base (diabetes and hypertension) are compared to those with a less developed or low evidence base (COPD and acute conditions). At the bottom, the reliability for each of four condi-tions is presented with the empirical 95% confidence interval limits. The condicondi-tions are hypertension (HTN), diabetes mellitus (DM), chronic obstructive pulmonary disease (COPD), and acute conditions.
Levels of evidence
Condition
Acute
COPD
DM
HTN
High Evidence
Low Evidence
0
.25
.5
.75
1
Reliability
While it is somewhat paradoxical that the reliability of a quality measure decreases as care increasingly conforms to a similar standard, it makes perfect sense that it is harder to distinguish small differences between providers or patients than it is to distinguish large differences. In fact this is extremely useful information to have. It can tell the profilers when they should describe the quality of care by the overall mean rather than bothering to generate pro-vider specific measures.
When we consider the cost and difficulty of implementing explicit indicator approaches to quality assessment [31,32], implicit review instruments with this level of reli-ability become an interesting alternative for assessing quality of care for the purposes of comparing across pro-viders or sites of care.
Increased evidence base improves the consistency of evaluation
Apart from coronary artery disease, diabetes and hyper-tension are two of the diseases with the largest number of published randomized clinical trials supporting the use of specific interventions to reduce significant the mortality and morbidity associated with these conditions. A Medline search with the condition as major heading restricted to randomized controlled trials and no date restriction, reveals 2028 and 5275 randomized controlled trials within diabetes and hypertension respectively and 65 for COPD. Thus it is intriguing that the instruments measuring the quality of care for these conditions had the highest reliability while the COPD instrument had a lower reliability, reflecting a smaller component of vari-ance attributable to differences in quality perceived sys-tematically across all the reviewers.
It should not be surprising that physician implicit review works best for those conditions where the evidence base is best developed, just as these are the areas where explicit checklist forms of quality measurement are easiest to develop. Implicit physician review would have been a par-ticularly useful tool if it could fill in the gap for assessment of conditions where the evidence base is less well devel-oped, however, our study does not support this use. Even so, there may well be settings where implicit review is a more feasible approach than explicit measures and it might be desirable to use a combination of explicit and implicit methods, as they are complementary in many of their strengths and weaknesses. Furthermore, if a suitable sample of physician reviewers is selected, this type of reli-ability study can quantify the degree of uncertainty that exists among expert physicians about the standards of care for a particular disease management area. It can be very useful to know that we should not attempt to profile care for a condition because even a group of experts does not
have a very clear or consistent sense of whether care was appropriate in any given situation.
An analytic framework for evaluating quality measurement instruments
Generalizability theory is an appealing theoretical frame-work to use when trying to define and improve the meas-urement characteristics of an instrument [25]. Using the techniques employed here for partitioning the source of variability in ratings of quality of care, investigators have previously examined whether discussion of a case between reviewers can improve the reliability of struc-tured implicit reviews. They found that it only provided a mirage of increased agreement, without any improvement in the reliability of the true score ratings [33]. Another study that evaluated quality of care at community based care organizations for the elderly (PACE centers) with a modified structured implicit review instrument, was the first to assess the contribution of different sources of vari-ation to the measurement of quality by physician review. However, there were only 6 physician reviewers, hospital records were excluded and the instrument failed to identify any systematic variation in overall quality across patients (reliability of 0) for physician reviews [10].
Using this analytic approach, we found the most interest-ing differences across conditions are in the variance com-ponents that estimate the true quality differences found across patients and the difficulty of the review task (or noise component, see Figure 2). As is suggested by the rel-atively small differences in the quality component between patients for COPD, it may well be that the poor reliability of peer review in some settings is simply the result of the lack of information on which to base system-atic practice. In other cases, as suggested by our results for the acute care instrument, the decision task seems partic-ularly difficult, as reflected by the larger noise component. A better definition of the condition to be assessed or better training techniques might be able to reduce this compo-nent and improve the reliability of the instrument.
Conclusions
For evaluation of diabetes or hypertension care, a struc-tured implicit review instrument would seem to be a via-ble alternative or complement to explicit indicator methods of assessing quality of care. There may be many cases where this may be a less expensive method to use, particularly where explicit indicator measures require extensive information technology modifications. The degree to which implicit review is more comprehensive and able to take into account the subtleties of care may make it more palatable to physicians. It may provide a counterweight to the tendency to teach to the test with specific indicator approaches [31]. Together, where the two methods are correlated, an assessment might be able to both reflect the individual nature of health care through implicit peer judgments and provide information about specific failed processes of care from an explicit indicator approach. It may be time to use structured implicit review more widely outside of research settings to assess quality of care.
Appendix
Estimation of the parameters was carried out by Bayesian methods, specifically a Markov Chain Monte Carlo (MCMC) method (MLwiN version 1.2). We specified non-informative priors and chain length was set to 500,000, sampling one out of every twenty iterations to minimize autocorrelation. In all models this was enough to reduce the Monte Carlo simulation error so that the estimate of each variance component was accurate to within 2 significant figures and the 95% coverage estimate was within 1% of the nominal 95% coverage interval [34].
The full model design has review occasion clustered by patient record, cross-classified with reviewer. Estimated parameters include a constant representing the mean rat-ing; as well as variance estimates for the reviewer, patient record and review occasion for each of the four domains (hypertension, diabetes, COPD and acute care manage-ment). Model fit was estimated by examining the DIC (deviance information criterion) and the patterns of residuals.
The DIC was 2383 for the full model. However, the pat-tern of residuals at the reviewer level (and indeed the mar-ginal ratings shown in Table 1) suggested that reviewer F was a potential outlier having the lowest score in three of the four domains. Thus a model was fit with the ratings of reviewer F estimated as a fixed effect. The DIC was 2425 representing worse fit. However, more importantly, the relative magnitude of the patient record variation and the noise variation was unchanged. Thus all results are pre-sented for the full model.
Calculating reliability with an ICC
Several ICCs or reliabilities can be calculated when using this type of analysis. First, the most useful measure when considering the use of this instrument in other settings is the correlation of ratings between reviews of the same patient by two randomly selected reviewers and is calcu-lated as
σ2
patient/(σ2patient+σ2reviewer+σ2noise). (Eq. 1)
The correlation between reviews of the same patient by the same reviewer is
(σ2
patient+σ2reviewer)/(σ2patient+σ2reviewer+σ2noise) (Eq. 2)
and is naturally higher, and is analogous to running all your measurements with the same instrument to reduce measurement error. However it does not reflect a particu-larly useful measurement strategy (one reviewer can not review all records). If an entity wished to use this instru-ment and was able to do a similar analysis to this current one for its sample of reviewers, it could estimate and remove their specific reviewer effects (which are extrane-ous noise to the primary purpose of detecting patient dif-ferences) and improve the reliability of the measurement. In this case, without the reviewer variation, the reliability is
σ2
patient/(σ2patient+σ2noise). (Eq. 3)
We report reliability based on Eq. 1 described above but this method of analysis allows one to compute whichever reliability measure is appropriate for a particular set of measurement conditions.
A much more commonly used measure of reliability in this setting is the kappa coefficient. In the case of two reviewers this data could be analysed for agreement of the 1–6 score assigned by each reviewer. The weighted kappa is mathematically equivalent to the ICC as calculated by equation 3 in the case of two raters when the weight is1-{(i-j)/(k-1)}2 (where i and j index the ratings by the two
raters and k is the number of categories) [35]. The ICC analysis can accommodate the more complex designs commonly used in these reliability studies and provides a much richer description by identifying the various contri-butions to the lack of agreement.
Competing interests
None declared.Authors' contributions
coor-dination. RAH participated in the design, analysis and manuscript preparation. LVR participated in the design, and manuscript preparation. MMH supervised the data collection and data management, and participated in the design, coordination and analysis. JA participated in the design and statistical analysis. EAK conceived of the study, and participated in its design, analysis and coordination
Additional material
Acknowledgements
The work was supported by VA HSRD IIR #98–103: Evaluating the per-formance of explicit quality monitoring systems in the VHA. Drs. Kerr & Asch are supported by Career Development Awards from the Health Serv-ices Research and Development Office of the Department of Veterans Affairs. Additional support was provided by the National Institute of Health (NIDDK P60-972573).
References
1. Chronic Disease in Adults [http://www.ahrq.gov/news/focus/ chadult.htm]. AHRQ Focus on Research. AHRQ Publication No. 02-M026, March 2002. Agency for Healthcare Research and Quality, Rockville, MD
2. Coye MJ: No Toyotas in health care: why medical care has not evolved to meet patients' needs. Health Aff (Millwood) 2001,
20(6):44-56.
3. National Committee for Quality Assurance: HEDIS 2000 Washington DC.: NCQA; 1999.
4. Rubin HR, Kahn KL, Rubenstein LV, Sherwood MJ: Guidelines for Stuc-tured Implicit Review of the Quality of Hospital Care for Diverse Medical and surgical Complications Santa Monica, CA: RAND Corporation; 1990.
5. Rubenstein LV, Kahn KL, Reinisch EJ, Sherwood MJ, Rogers WH, Kamberg C, Draper D, Brook RH: Changes in quality of care for five diseases measured by implicit review, 1981 to 1986.JAMA
1990, 264(15):1974-9.
6. Brennan TA, Leape LL, Laird NM, Hebert L, Localio AR, Lawthers AG, Newhouse JP, Weiler PC, Hiatt HH: Incidence of adverse events and negligence in hospitalized patients. Results of the Harvard Medical Practice Study I. N Engl J Med 1991,
324(6):370-6.
7. Rubin HR, Rogers WH, Kahn KL, Rubenstein LV, Brook RH: Watch-ing the doctor-watchers. How well do peer review organiza-tion methods detect hospital care quality problems?JAMA
1992, 267(17):2349-54.
8. Hayward RA, Bernard AM, Rosevear JS, Anderson JE, McMahon LF Jr:
An evaluation of generic screens for poor quality of hospital care on a general medicine service [see comments].Med Care
1993, 31(5):394-402.
9. Localio AR, Weaver SL, Landis JR, Lawthers AG, Brenhan TA, Hebert L, Sharp TJ: Identifying adverse events caused by medical care: degree of physician agreement in a retrospective chart review.Ann Intern Med 1996, 125(6):457-64.
10. Smith MA, Atherly AJ, Kane RL, Pacala JT: Peer review of the qual-ity of care. Reliabilqual-ity and sources of variabilqual-ity for outcome and process assessments.JAMA 1997, 278(19):1573-8.
11. Ashton CM, Kuykendall DH, Johnson ML, Wray NP: An empirical assessment of the validity of explicit and implicit process-of-care criteria for quality assessment. Med Care 1999,
37(8):798-808.
12. Hayward RA, Hofer TP: Estimating hospital deaths due to med-ical errors: preventability is in the eye of the reviewer.JAMA
2001, 286(4):415-20.
13. Thomas EJ, Studdert DM, Brennan TA: The reliability of medical record review for estimating adverse event rates.Ann Intern Med 2002, 136(11):812-6.
14. Kosecoff J, Kahn KL, Rogers WH, Reinisch EJ, Sherwood MJ, Ruben-stein LV, Draper D, Roth CP, Chew C, Brook RH: Prospective pay-ment system and impairpay-ment at discharge. The 'quicker-and-sicker' story revisited.JAMA 1990, 264(15):1980-3. 15. Jencks SF, Cuerdon T, Burwen DR, Fleming B, Houck PM, Kussmaul
AE, Nilasena DS, Ordin DL, Arday DR: Quality of medical care delivered to Medicare beneficiaries: A profile at state and national levels.JAMA 2000, 284(13):1670-6.
16. Conditions of Participation (CoPs), Conditions for Coverage (CfCs), Quality Improvement System for Managed Care (QISMC), Year 2000 Standards and Guidelines [http://www.cms.hhs.gov/cop/2d1.asp]. Centers for Medicare and Medicaid Services, Washington DC 2000 Jul 26 17. Lindrooth RC, Calhoun EA, Welshman EE, Budetti PP: Peer Review
at Teaching Hospitals: Results from a National Survey.Journal of Quality Health Care 2002, 1(2):16-9.
18. Sifner TA: Establishing a Peer Review Process.Journal of Quality Health Care 2002, 1(2):31-2.
19. Goldman RL: The reliability of peer assessments of quality of care.JAMA 1992, 267(7):958-60.
20. Hayward RA, McMahon LF Jr, Bernard AM: Evaluating the care of general medicine inpatients: how good is implicit review?Ann Intern Med 1993, 118(7):550-6.
21. Pearson ML, Lee JL, Chang BL, Elliott M, Kahn KL, Rubenstein LV:
Structured implicit review: a new method for monitoring nursing care quality.Med Care 2000, 38(11):1074-91.
22. Chang BL, Lee JL, Pearson ML, Kahn KL, Elliott MN, Rubenstein LL:
Evaluating quality of nursing care: the gap between theory and practice.J Nurs Adm 2002, 32(7–8):405-18.
23. Bravo G, Potvin L: Estimating the reliability of continuous measures with Cronbach's alpha or the intraclass correla-tion coefficient: toward the integracorrela-tion of two tradicorrela-tions.J Clin Epidemiol 1991, 44(4–5):381-90.
24. Longford NT: Reliability of essay rating and score adjustment.
Journal of Educational and Behavioral Statistics 1994, 19(3):171-200. 25. Brennan RL: Generalizability theory New York: Springer; 2001. 26. McDowell I, Newell C: Measuring Health: a guide to rating scales and
questionnaires 2nd edition. New York: Oxford University Press; 1996. 27. Broder MS, Oken C, Parker M, Giammona M, Newman J, Harrington C, et al.: Outpatient Care: A Conceptual Framework and a Form for Struc-tured Implicit Review Santa Monica, CA: RAND Corporation; 2002. 28. Hofer TP, Hayward RA, Greenfield S, Wagner EH, Kaplan SH,
Man-ning WG: The unreliability of individual physician "report cards" for assessing the costs and quality of care of a chronic disease.JAMA 1999, 281(22):2098-105.
29. Sixma HJ, Spreeuwenberg PM, van der Pasch MA: Patient satisfac-tion with the general practisatisfac-tioner: a two-level analysis.Med Care 1998, 36(2):212-29.
30. Krein SL, Hofer TP, Kerr EA, Hayward RA: Whom should we pro-file? Examining diabetes care practice variation among pri-mary care providers, provider groups, and health care facilities.Health Serv Res 2002, 37(5):1159-80.
31. Casalino LP: The unintended consequences of measuring qual-ity on the qualqual-ity of medical care. N Engl J Med 1999,
341(15):1147-50.
32. Gauging quality regulation's impact on premium costs. Medi-cine & Health 1997, 51(46):1.
33. Hofer TP, Bernstein SJ, DeMonner S, Hayward RA: Discussion between reviewers does not improve reliability of peer review of hospital quality.Med Care 2000, 38(2):152-61. 34. Browne WJ: MCMC Estimation in MLwiN Version 1.0 edition. London:
Centre for Multilevel Modeling, Institute of Education, University of London; 2002.
35. Fleiss JL: Statistical Methods for Rates and Proportions 2nd edition. New York: John Wiley & Sons; 1981:212-36.
Additional File 1
Implicit Reviewer Recruitment and Selection. A brief description of the reviewer recruitment process and a list of the screening questions for the reviewer applicants and those listed as clinical references.
Click here for file
Publish with BioMed Central and every scientist can read your work free of charge
"BioMed Central will be the most significant development for disseminating the results of biomedical researc h in our lifetime."
Sir Paul Nurse, Cancer Research UK
Your research papers will be:
available free of charge to the entire biomedical community
peer reviewed and published immediately upon acceptance
cited in PubMed and archived on PubMed Central
yours — you keep the copyright
Submit your manuscript here:
http://www.biomedcentral.com/info/publishing_adv.asp
BioMedcentral
Pre-publication history
The pre-publication history for this paper can be accessed here: