Project no.:
608540
Project acronym:
GARPUR
Project full title:Generally Accepted Reliability Principle with
Uncertainty modelling and through probabilistic Risk assessment
Collaborative project
FP7-ENERGY-2013-1
Start date of project: 2013-09-01
Duration: 4 years
D8.1
Pilot testing methodologies, models, scenarios
and validation approach
Due delivery date: 2016-02-29
Actual delivery date: 2016-02-18
Organisation name of lead beneficiary for this deliverable:
NTNU Norwegian University of Science and Technology
Project co-funded by the European Commission within the Seventh Framework Programme (2007-2013) Dissemination Level
PU Public X
PP Restricted to other programme participants (including the Commission Services)
RE Restricted to a group specified by the consortium (including the Commission Services)
Deliverable number: D8.1
Deliverable short title: Pilot testing methodologies, models, scenarios and validation approach
Deliverable title in DoW: Report describing pilot testing methodologies, models, scenarios and validation approach
Work package: WP8 Pilot Scale Validation
Lead participant: NTNU
Revision Control
Date Revision Author(s) Comments
Quality Assurance, status of deliverable
Action Performed by Date
Verified (WP leader) Matthias Hofmann (STATNETT) 2016-02-18
Reviewed (Sc. Advisor) Louis Wehenkel (ULG) 2016-03-15
Approved (EB) EB17 2016-04-08
Submitted
Author(s) Name Organisation E-mail
Camille Hamon NTNU [email protected]
Nikolay Nikolaev ESO [email protected]
Andrey Andreev ESO [email protected]
Nenko Gamov ESO [email protected]
Ventsislav Zahov ESO [email protected]
Boyko Chovikov ESO [email protected]
Samuel Perkin Landsnet [email protected]
Guðjón Hugberg Björnsson Landsnet [email protected]
Arnaud Vergnol ELIA [email protected]
Jonathan Sprooten ELIA [email protected]
Waqquas Bukhsh Strathclyde [email protected]
Pascal Tournebise RTE [email protected]
Rémy Clement RTE [email protected]
Karel Máslo ČEPS [email protected]
Oldřich Rychlý ČEPS [email protected]
Evelyn Heylen KU Leuven [email protected]
Matthias Hofmann STATNETT [email protected]
Table of Contents
Page
EXECUTIVE SUMMARY ... 9
1 INTRODUCTION ... 11
1.1 Overview of WP8 ... 11
1.2 Links to other work packages ... 12
1.3 Scope of this report ... 13
1.4 Report structure ... 13
2 DESCRIPTION OF THE PILOT TESTS... 14
2.1 Overview of the pilot tests ... 14
2.2 Pilot tests in Task 8.3 ... 14
2.3 Pilot tests in Task 8.4 ... 16
2.4 Priority list ... 20
3 TESTING METHODS AND CRITERIA ... 21
3.1 General workflow for the pilot tests ... 21
3.2 Workflow for pilot test 8.3.1 (RTE) ... 21
3.3 Workflow for pilot test 8.4.1 (Landsnet) ... 27
3.4 Workflow for pilot test 8.4.3 (Elia) ... 29
4 METHODOLOGY FOR THE ASSESSMENTS OF PILOT TESTS ... 38
4.1 Assessment as proposed by the theoretic work of GARPUR ... 38
4.2 Assessment as proposed by the pilot tests ... 40
4.3 Assessment metrics available in the GQP-prototype ... 41
5 CONCLUSIONS ... 43
6 APPENDIX ... 44
6.1 Workflow for pilot test 8.3.3 (ČEPS) ... 44
6.2 Workflow for pilot test 8.4.5 (ESO) ... 46
Table of Figures
Page
Figure 1: Workflow of WP8 ... 11
Figure 2: General workflow for the pilot tests. ... 21
Figure 3: Graphical convention used throughout the description of RTE's pilot test T8.3.1. ... 22
Figure 4: Concepts of risk evaluation zone and contingency and remedial action zone. ... 23
Figure 5: General flowchart of RTE's pilot test 8.3.1. ... 23
Figure 6: Details on the day-ahead and real-time processes. ... 24
Figure 7: Creation of the real-time snapshots. ... 24
Figure 8: Contingency simulation. ... 25
Figure 9: Preventive and corrective actions. ... 25
Figure 10: Multilevel optimisation problem, coupling between preventive and corrective actions and concept of acceptable states. ... 26
Figure 11: Workflow diagram of the RT near real-life pilot test at Landsnet. The models shown as stacks identify those which must be run for each credible contingency. ... 27
Figure 12: Pilot test to compare the GARPUR methodology and Current Elia’s Multi-state Approach. ... 30
Figure 13: Flowchart of ČEPS' pilot test. ... 45
Figure 14. Workflow diagram for ESO’s pilot test ... 46
Table of Tables
Page Table 1: Overview of the pilot tests ... 14Table 2: Voltage acceptability constraints. ... 32
Table 3: Overload acceptability constraints. ... 32
Table 4: Short-circuit power acceptability constraints. ... 33
[image:6.595.40.515.144.369.2]List of symbols
CEE Central Eastern Europe
CENS Expected cost of energy not supplied DACF Day-ahead congestion forecast DC-LF Direct-current load-flow
DoW Description of work
ENS Expected energy not supplied GQP GARPUR quantification platform
LT Long-term
RES Renewable energy sources
RMAC Reliability management approach and criterion
RT Real-time
SNP Snapshot
ST Short-term
TSO Transmission system operator TYNDP Ten-Year Network Development Plan
EXECUTIVE SUMMARY
This report describes the pilot tests that will be carried out within GARPUR. The pilot tests aim at assessing and validating, as closely as possible to real-life conditions, the new Reliability Management Approach and Criteria (RMACs) developed in work package 2 and the socio-economic impact assessment framework developed in work package 3, while considering the methodologies and approaches for practical implementation in work packages 4, 5 and 6. The proposed RMACs are compared against the current N-1 practices and approaches determined in work package 1. In addition, some pilot tests will make use of the GARPUR Quantification Platform (GQP) that has been developed by work package 7.
1
INTRODUCTION
1.1
Overview of WP8
This report is the result of the first task, task 8.1, in work package 8 (WP8). The two objectives of WP8, as recalled from the GARPUR Description of Work (DoW) [GARPUR, 2013], are:
• Objective 1: To validate the possibility to compare different reliability criteria in terms of their induced socio-economic consequences: Convincing and scientifically valid arguments are provided when choosing new criteria which circumvent the limitations of N-1. This is done by using the quantification platform prototype on one or possibly several test scenarios, relevant primarily at the pan-European level. This allows for credible proposals of new families of criteria to be considered in the future operation and planning of the EPS. Therefore we have PILOT tests using the quantification platform prototype.
• Objective 2: To validate the practicalities of incorporating such new families of criteria into a TSOs actual decision making processes. This is done by choosing a TSO, and one or several decision making contexts (e.g., real-time operation and long-term planning). A pilot test runs a selected set of reliability management applications using the new criterion with actual system data, and evaluates decisions within the particular system and context(s). Therefore we have PILOT tests of the practical use of new reliability criteria.
The WP8 of the GARPUR project is divided into 4 tasks. The first task (T8.1) deals with building a systematic process for running the pilot tests. The next task, T8.2, will focus on the specific details of individual tasks e.g. gathering data and making sure adequate software implementations are in place. The pilot tests will be run in the tasks T8.3 and T8.4. In this deliverable, a step-by-step process that the subsequent tasks could follow is proposed. More importantly, through this deliverable, a clear link (agreement) between involved TSOs and academic partners for collaboration is established. Furthermore, the delegation of the responsibilities of running, documenting and reporting of the pilot test to the involved partners is defined.
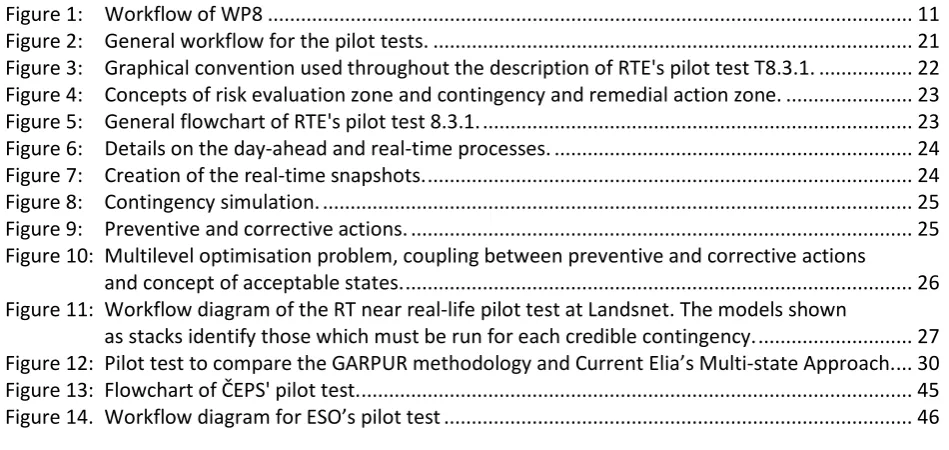
[image:11.595.148.486.552.729.2]Objective 1 is dealt with by running pilot tests in Task 8.3, whereas Objective 2 is addressed by running pilot tests in Task 8.4. Figure 1 illustrates the division of work between the different tasks of WP8.
More specifically, from the DoW, the work in Task 8.1 should include:
• Development of testing methods and criteria. A systematic methodology for execution of pilot tests will be established that guarantees consistency regardless of the operational region or time horizon. This includes the choice of test scenarios (power system model, context, etc), the definition of testing procedure and data needs. Available input from WPs 4 – 6 will be taken into account in the development of testing methods and criteria to ensure realism in the testing from a TSO point of view.
This part of the work corresponds to identifying the pilot tests to be run in Figure 1 and, for each pilot test, the testing procedures to carry out.
• Establishment of a systematic methodology for the assessment of pilot tests. The different metrics for this assessment need to be defined and their use to benchmark/rank different criteria must be specified. The quantification platform prototype must be able to compute a subset among these metrics.
This part of the work corresponds to, for each pilot test, (i) defining the set of metrics of interest for each pilot test and each Reliability Management Approach and Criterion (RMAC) and (ii) defining the methods used to compile and analyse all sets of metrics obtained from the different RMACs within each pilot test. It therefore also defines the set of compiled results from the pilot tests.
• Development of a method to assemble and analyse results from different pilot tests.To provide coherent methods for analysis in documenting, harmonizing and comparing the results from multiple pilot tests that cover different time horizons. This will also primarily be done by the quantification platform.
This part of the work corresponds to defining methods for compiling and analysing the results from all pilot tests (“Coherent analysis and reporting” in Figure 1).
We note that the number of tested RMACs is a pilot test specific value, since different pilot tests typically test different decision making contexts and problems. Furthermore, the number of metrics is specific to a pair (pilot test, RMAC) since different RMACs are typically based on different pieces of information (for example, the notion of residual risk is not explicitly taken into account in the N-1 criterion).
1.2
Links to other work packages
The pilot tests must consider the inputs from all relevant work packages:
• WP2: A general RMAC formulation is proposed. At the time of writing, WP2 has made proposals for RMAC formulations for assessment and control for long-term grid development, mid-term asset management, short-term operation planning and real-time operations. Parallel to the completion of the present report, WP2 works on developing tractable approximations for the proposals. Furthermore, coherence with respect to the socio-economic analysis made in WP3 and the practical needs defined in WP4, WP5, and WP6 is being made in WP2, to be completed later in the project.
• WP4/5/6: The RMAC formulations and socio-economic analysis framework proposed in WP2 and WP3 should be acceptable for and usable by Transmission System Operators (TSOs). Parallel to the work in WP8, work packages 4, 5 and 6 are working on developing appropriate formulations. • WP7: The first prototype of the GARPUR quantification platform is being developed in parallel with
the work in WP8.
1.3
Scope of this report
Given the work that is ongoing in other work packages, the main task of T8.1 is to prepare the pilot tests by describing, with as much detail as possible, the required data and tools and the expected outputs. The pilot tests that will be carried out in T8.3 will use the GQP. For these pilot tests, an important part of the preparation is to coordinate with WP7 to reach an agreement on which GQP features will be available.
As described in this report, task T8.1 has covered the following points to prepare the pilot tests. First, an agreement between the academic partners and the TSOs has been established to define the collaboration in the pilot tests. This is important since the pilot tests are driven by TSOs, who may not have the resources to carry out the pilot tests on their own. On the other hand, confidentiality issues limit the extent to which external partners can contribute. Second, pilot tests have been given priority levels so as to use the resources allocated to work package 8 in the most appropriate way. Third, detailed initial proposals of step-by-step processes for implementing the pilot tests with the highest priority level have been developed. The pilot tests with lower priority levels are described with less detail.
1.4
Report structure
2
DESCRIPTION OF THE PILOT TESTS
This chapter gives a brief description of the proposed pilot tests.
2.1
Overview of the pilot tests
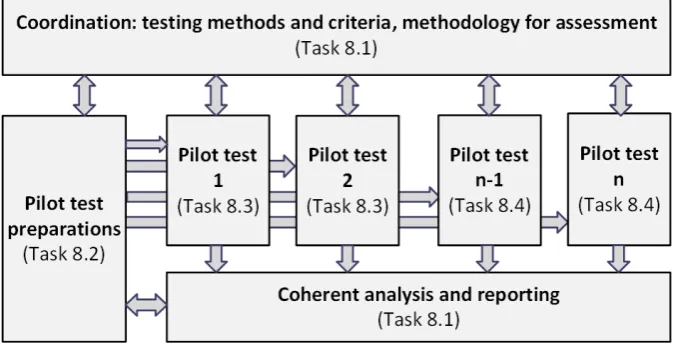
[image:14.595.122.438.342.510.2]The pilot tests are concerned with assessing the new reliability and socio-economic criteria. The TSOs does this evaluation using the current deterministic criteria as part of their day-to-day job. Moreover the TSOs have access to real network, reliability and historic data that is an essential part of the analysis in pilot tests. In this context, it is proposed that the pilot tests should be led by the TSOs. There are 5 TSOs and 4 academic partners involved in WP8. Table 1 lists all the eight proposed pilot tests, the involved transmission system operators and the considered time horizons (RT=real-time operations, ST=short-term operation planning and LT = long-term system development). The pilot tests in task T8.3 will use the GARPUR quantification platform whereas the pilot tests in task T8.4 will be carried out in near-real life context. All pilot tests are briefly described in Sections 2.2 and 2.3. A priority list for the implementation of the eight pilot tests is given in Section 0.
Table 1: Overview of the pilot tests
Task Pilot test TSO Time horizon
T8.3 Pilot test 8.3.1 RTE RT+ST
T8.3 Pilot test 8.3.2 RTE RT+ST
T8.3 Pilot test 8.3.3 ČEPS RT+ST
T8.4 Pilot test 8.4.1 Landsnet RT
T8.4 Pilot test 8.4.2 Landsnet LT
T8.4 Pilot test 8.4.3 Elia LT
T8.4 Pilot test 8.4.4 Elia RT
T8.4 Pilot test 8.4.5 ESO RT+ST
2.2
Pilot tests in Task 8.3
2.2.1 Ambitions of pilot testing in Task 8.3
The objective of pilot testing in Task 8.3 is to validate the possibility to compare different reliability criteria in terms of the socio-economic impacts of their implementation.
The pilot tests in Task 8.3 will be performed by RTE and ČEPS, aiming at using the GQP prototype in order to compare the N-1 strategy with the new probabilistic Reliability Management Approaches and Criteria (RMACs) proposed in WP2, while using the socio-economic impact assessment methodology proposed in WP3.
The pilot tests in the task 8.3 prioritize short-term operation, and will take the following two forms: • Pilot test 8.3.1 and 8.3.3 (RTE): Analyses on historical cases, using the new reliability criteria to
provide a better understanding of the limitations of the current practices based on the N-1 criterion.
• Pilot test 8.3.2 (ČEPS): Dedicated analyses of specific cases to test how the new reliability criteria influence the TSO’s decisions compared to the existing N-1 criterion.
2.2.2 Pilot test 8.3.1 (RTE)
The time frame considered for the modelling of the TSO actions is day-ahead operation planning and intra-day real-time operation. The TSO actions that need to be modelled by the GQP are:
• Actions on the topology
• Actions on the phase-shifting transformers (PST) • Redispatching
• Load-shedding
In order to have convincing results, we intend to run this test on a significantly large sample of credible scenarios. The test does not claim to reproduce precisely the operator behaviour, but it is assumed that the main differences observed between the different RMACs could be interpreted as meaningful trends, should it be later decided to switch from N-1 to the GARPUR RMAC. Therefore, the test will run on one full year, thus encompassing all the seasonal aspects.
The main test would focus on a sub-part of the RTE network. The French network is by nature very resilient to N-1 contingencies. Therefore, we have decided to concentrate our analysis on the south-east region of France which has been responsible for two third of RTE’s internal network congestion costs in 2013 mainly due to two parallel lines forming the so called “Tavel-Realtor Corridor”.
Besides, the outcome of the performance assessment of different reliability management schemes depends strongly on several modelling assumptions (e.g. probabilities of contingencies and failure modes used; assumptions about the volumes, durations, and monetization of service interruptions; etc.). Therefore, it is also proposed to perform sensitivity analyses to look at the impact of such assumptions on the outcome of these tests. The lessons learnt from such sensitivity analyses would be greatly valuable for future work and for dissemination activities.
Regarding the GARPUR Quantification Platform (GQP) two elements will be especially challenging: • The computation problem: regarding the number of computations it will be necessary to proceed
to some simplifications without jeopardizing the outcome conclusions,
• The multi-level coupling optimisation problem (see Section 3.2) between the preventive actions (short-term and real-time) and the corrective actions (real-time).
2.2.3 Pilot test 8.3.2 (RTE)
If enough resources are available at the end of the pilot test 8.3.1, RTE will run the same kind of test on the same network in a multi-TSO setup, i.e. instead of the French single-TSO setup. The French network will be artificially split in two, north and south for example.
for its own area, in order to compute the corresponding decisions for its area. Notice that this leads in principle to four combinations of strategies (N-1 in both areas, RMAC in both areas, N-1 in either area and RMAC in the other area). Each strategy combination will lead (in the same fashion as for Test 8.3.1) to the assessment of the resulting decisions on the reliability of each area, as well as on the whole system.
2.2.4 Pilot test 8.3.3 (ČEPS)
This pilot test will consider the Central Eastern Europe (CEE) region (Germany, Austria, Poland, Czech republic, Slovakia and Hungary), which often suffers from large loop flows caused by massive export from Northern Germany to the south due to excessive production from the renewable energy sources (RES).
In this context, a situation on 22nd of August 2012 stands out. The grid was stressed due to several reasons e.g. maintenance, summer time – changes in load of grid. The affected TSOs were PSE-O, APG, ČEPS and
50Hertz. The main reasons of the stressed situation were high flows from north to south in the CEE region due to high export of RES production from Germany, especially the concurrence of production of photovoltaics and wind power plants together with high import into Austria and far to the CEE region. On that day, the grid was weakened due to maintenance works on lines and equipment, and also due to maintenance of power plants, and some lines were overloaded. During the day-ahead congestion forecast (DACF) process several N-1 violations were detected and remedial actions like topological measures, re-dispatch via HVDC links and re-re-dispatch of generating units were derived.
The pilot test 8.3.3 deals with the issues related to the power flows in the CEE region. This situation is particularly important for ČEPS because it creates many problems in the electrical network and endangers stability and reliability. ČEPS expects that the pilot test case will allow investigating whether the proposed RMAC could be relevant for replacement of the current N-1 reliability criterion.
The test case will be focused on comparing the current (N-1 based) and alternative (probabilistic) reliability criteria. The range of CEE grid is circa 1500 nodes (at snapshots). In the DACF process, data of the whole grid with 21 TSOs (9500 nodes) is used, corresponding to almost the whole pan European grid. The following is a high-level summary of the proposed pilot test:
• Time frame: Real time to day ahead (short term).
• Period of Assessment: One day (especially the part of the day when large loop flows stressed the CEE grid).
• Assessment type: Assessment of risk, optimization of preventive actions.
2.3
Pilot tests in Task 8.4
2.3.1 Ambitions of pilot testing in Task 8.4
The objective of pilot testing in Task 8.4 is to validate the practicality of applying the new reliability management approach and criterion in a near real-life context. This relates to:
i) Defining pilot tests of the new reliability criteria that are practically feasible given present day TSO practices;
ii) Creating new tools and models, or making reasonable assumptions, to provide the necessary input data for the pilot tests;
iii) Performing the pilot tests defined in point (i);
These pilot tests will be performed in both low and high complexity systems. Landsnet’s system is considered as a low complexity test case, given the lack of cross-border connections, and is relatively smaller than other European sub-systems. The high complexity test cases are the transmission systems of Elia and ESO, which are both larger and heavily interconnected to other European countries, with meshed networks and active markets.
The outcome of these tests will give an indication of the degree to which the new reliability management approach and criteria can be applied in practice. The tests will also provide an indication on where future research should concentrate its efforts, in terms of tools, data gathering and modelling, to best facilitate the migration of TSOs toward the proposed probabilistic reliability criteria. However, the proposal of the near-real life pilot tests is neither to validate the accuracy of the probabilistic criteria nor to make a critical comparison to the N-1 criterion in terms of socio-economic impact.
2.3.2 Pilot test 8.4.1 (Landsnet)
Given that Iceland has a small isolated system, it is practical for testing the general performance of the methodology developed in WP2 and further refined in WP6 in terms of tractability and speed. The greatest exogenous source of risk to the Icelandic system is weather, and therefore this will be an important aspect of a test case in Iceland. Of specific interest will be the positioning of spinning reserves, and the setting of transmission limits across the main ‘cuts’ on the system.
The first round of this pilot test aims to answer the following question: “Can we practically assess the risk in real-time on the Icelandic transmission system using the GARPUR methodology?” This will be a low-complexity application of the GARPUR methodology, as it is anticipated that a simple application will best reflect how TSOs are likely to migrate to the method in the future. This will essentially be a debugging and validation test. It will also answer the question of “Does the output make sense and agree with TSO expectations?” This is anticipated to be an important test as it will also determine whether the method appears as a ‘black box’ or is immediately understandable by operators.
Assuming that the first stage pilot test is a success, the test will be extended to include an optimization of preventive actions, and possibly dynamic constraints and corrective control actions (while taking into account their failure modes).
• Time frame: Real-time to Day Ahead.
• Period of Assessment: One day ahead (sampled from an entire year).
• Assessment type: First a simple assessment of risk. If results of assessment are acceptable, it will be followed by an optimization of preventive (and possibly corrective) actions.
2.3.3 Pilot test 8.4.2 (Landsnet)
This test is proposed tentatively, depending on the results of the real-time test at Landsnet and the the long-term test at Elia (see Section 2.3.4), and whether the method applied by Elia is applicable in Iceland. The goal of such a test would be to confirm that the GARPUR methodology could be applied in the system development context at different TSOs with minimal adjustments. The rest of this section considers the case where such a test would indeed take place.
scenarios” applied at Elia, so as to define credible scenarios for the Icelandic system and assess its potential grid reinforcements. There are two potentially interesting grid reinforcements that could be assessed:
• Reinforcement of radials to make them N-1 compliant: small-scale, somewhat binary decisions, would be interesting to assess the investment from a pure reliability perspective.
• Reinforcing the 132kV ring: A number of candidate decisions have been proposed in the latest Ten-Year Network Development Plan (TYNDP), and would therefore be highly relevant to investigate. Alternatively, it may be useful to retrospectively assess some alternatives to the 2006 TYNDP by performing a coarse simulation (using historical data) of the system until 2016 to determine how sensitive the GARPUR methodology is to different system development decisions on the Icelandic transmission system. This however would require more work in defining viable development decisions.
• Time frame: Long Term. • Assessment Period: 10 years.
• Assessment type: Analysis (comparison of alternative system development decisions).
2.3.4 Pilot test 8.4.3 (Elia)
It is proposed to implement part of the concepts, that are proposed by WP2 and WP4, within the existing context of long-term grid planning for the Belgian power system. This test will allow Elia to compare the results obtained using the current approach and the new proposed approach.
At the time of writing of this report, the step “selection of credible operating scenarios” is being considered in WP4. This task is a first step in order to identify the relevant states for which the future grid needs to be designed. This methodology seems mature and feasible to be implemented in the long-term process at Elia.
The current method used by Elia is a multi-state approach based on best estimates of forecasted values. It is therefore considered relevant to compare the current approach with the one proposed by GARPUR. In order for this comparison to be made, an implementation of the approach of GARPUR within the software DIgSILENT Powerfactory (which is used within Elia) is needed.
The objectives of the pilot test are therefore to validate the concept proposed by GARPUR for the screening of operating scenarios in a near-real life environment and compare its performance with more conventional approaches implemented in the same environment.
The validation and comparison will cover usability of the new approach, differences and similarities between the new and conventional approach in terms of missing critical scenarios, selection of redundant scenarios and computing time.
Finally, recommendations for improvement of the new approach will be proposed. The following is a brief summary of the proposed pilot test:
• Time frame: Long term grid development. • Period of Assessment: One year.
2.3.5 Pilot test 8.4.4 (Elia)
Given the development performed in Landsnet’s short-term pilot test 8.4.1 (see Section 2.3.2), an assessment of a reliability criterion following the methodology proposed by Landsnet to evaluate risk in real-time will be implemented. The test will highlight the difference in risk assessment between an interconnected system and an islanded grid.
The assessment of the reliability criterion will be computed on snapshots provided by the EMS system and used, in the context of the test, for post-treatment analysis. Assessment of the results will be done by both system security experts and real-time system engineers (i.e. operators) and will compare potential decisions that would have been taken if the new reliability criterion had been available in real-time with the actual real-time decisions taken. The following is a brief summary of the proposed pilot test:
• Time frame: Real-time.
• Period of Assessment: At least 2 test periods (each of a few consecutive hours).
• Assessment type: First a simple assessment of risk. If results of assessment are acceptable, it will be followed by an optimization of preventive (and possibly corrective) actions.
2.3.6 Pilot test 8.4.5 (ESO)
This pilot test is from the perspective of the short-term planning. The test case will be based on the Bulgarian power system model. The neighbouring TSOs will be represented by bus power injections. The model will include detailed models of the entire 400 and 220 kV grid and only small parts of the 110 kV grid. Generation units are represented using equivalent models up to the high-voltage bus of their step-up transformers. The model comprises about 94 buses and is good to test medium-sized power systems in terms of algorithm scalability and tractability. The data set includes DACF files (day-ahead congestion forecast) for an entire year at a resolution of 1 hour. For some periods snapshots with recorded data are available.
The Bulgarian power system is interesting because its 400 and 220 kV grid is resilient. Congestions and failures are rare and the pilot test will focus on comparing the preventive actions proposed by the new criterion with those proposed by the N-1 criterion.
• Time frame: Short-term.
• Period of Assessment: One year.
2.4
Priority list
Considering the number of proposed pilot tests and the resources available, three priority levels are defined to categorise the pilot tests:
1. Priority 1 tests:
a. RTE – RT+ST test 8.3.1 b. Landsnet – RT test 8.4.1 c. Elia – LT test 8.4.3 2. Priority 2 tests:
a. ČEPS – RT+ST test 8.3.3 b. ESO – ST test 8.4.5 3. Priority 3 tests:
a. RTE – ST test 8.3.2 b. Landsnet – LT test 8.4.2 c. Elia – RT test 8.4.4
The tests with priority 1 will be started as soon as possible. Based on the experience from starting up the tests with priority 1, the feasibility of performing the tests with priority 2 will be evaluated. Pilot tests with priority 3 will only be done if time and resources are available.
3
TESTING METHODS AND CRITERIA
In this chapter, a detailed description of the proposed test cases with priority level 1 is given. In Section 3.1, a generic workflow that is common to all pilot tests is presented. In Sections 3.2 to 3.4, detailed specifications of the pilot tests are given.
3.1
General workflow for the pilot tests
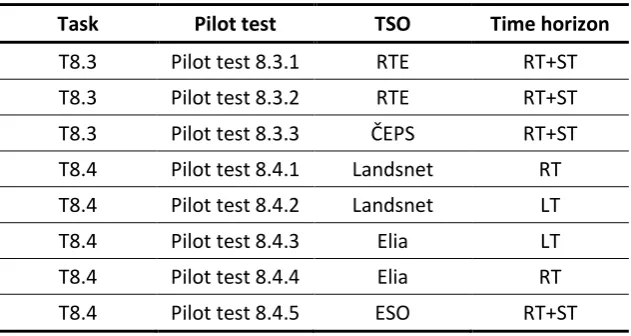
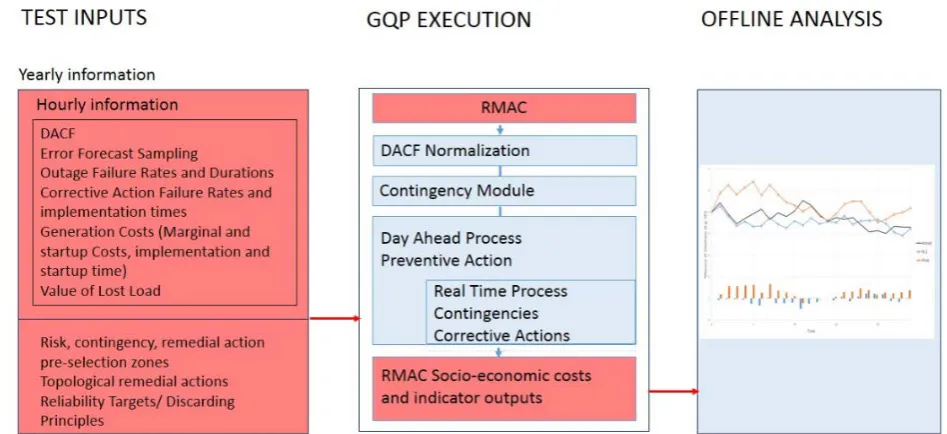
[image:21.595.79.555.399.573.2]The pilot tests in Task 8.3 aim at testing the GARPUR quantification platform (GQP), whereas pilot tests in Task 8.4 do not need to rely only on tools provided by the GQP, as previously described in the objectives 1 and 2 of WP8 (see Section 1.1). Figure 2 illustrates the general workflow that is proposed for the methodology of the pilot tests and shows that it is important to identify the set of additional features that need to be implemented in the GQP, so that Task 8.3 can be completed by only using the GQP. This has been done continuously in cooperation with WP7 during the course of Task T8.1. Figure 2 also shows a distinction between, on the one hand, steps that are specific to the TSOs whose system will be tested and, on the other hand, steps that are specific to the considered pilot test but not to the involved TSOs. This distinction is important to delimit the steps that together define a general “plug-and-play” methodology that can be used by any actor. In Figure 2, the box “Assumptions and simplifications” accounts for the fact that the data provided by the TSOs may not be as comprehensive as what is expected in the general methodology. The box “pre-processing” enables the TSOs to adapt their data to the plug-and-play methodology. Data neutralisation for confidentiality issues is included there.
Figure 2: General workflow for the pilot tests.
3.2
Workflow for pilot test 8.3.1 (RTE)
3.2.1 Introduction
As part of this pilot test, RTE also intends to perform sensitivity analyses to study the relationships between inputs and outputs to capture the most influencing factors, in order to prioritize the future work on the modelling of the input parameters.
In the following workflow, the interactions between RTE and the GQP will be described. Some functions of the GQP that are judged essential for the pilot test will be highlighted. Mainly it will concern the data given by RTE and its uses by the GQP, the sampling process, the optimisation trade-off between
[image:22.595.78.483.239.324.2]preventive and corrective actions and the outputs. The graphical convention in Figure 3 will be used to illustrate the workflows: the red colour will be related to data and the blue one to tasks.
Figure 3: Graphical convention used throughout the description of RTE's pilot test T8.3.1.
To perform the test an important amount of data will be provided by RTE to the GQP. Because all the data necessary to the test are not included in the Day Ahead Congestion Forecast files (DACF files), extra data related to modelling of uncertainties, failure rates, remedial actions, costs and reliability will be also provided.
3.2.2 Reliability data needs and N-1 normalization process
In the following workflow, the data have been separated into subsets: the hourly subset for the data that are time dependent, and the general subset for the data that will remain the same during the whole simulation.
Some data is weather dependent or time dependent. This dependency will be managed outside of the GQP. For example the hourly uncertainty sampling, failure rates, and costs will be externally modified to illustrate this dependency. By doing this, the modelling of uncertainties will be simplified for the GQP, which will allow to easily interact with the platform in order to perform the sensitivity analyses.
Among the hourly data, a “Normalization Data” subset will be provided. The purpose of those data is to de-couple the historical time-series embedded in the given DACF files from the decisions taken in day-ahead operation planning to address N-1 congestion forecasts. Very little information is in fact concerned by this normalization process for our test. By modifying only the concerned data, the general pattern of the DACF will stay unchanged, in particular the generation information resulting from the day-ahead market interactions.
Another important input concerns the description of the contingency and remedial action selection zone. For tractability reasons, TSO decisions will focus only on a subpart of the test network. Likewise, only a subset of contingencies and remedial actions should be modelled. The rest of the system will be useful to simulate system responses and for uncertainty modelling. This is illustrated in Figure 4.
Data input/output
Task
Data Flow
Figure 4: Concepts of risk evaluation zone and contingency and remedial action zone.
3.2.3 General workflow
[image:23.595.75.549.407.624.2]Figure 5 shows the flowchart of the pilot test. Once the DACF files are normalized, the GQP will have to solve the optimisation problem between the day-ahead and the real-time decisions in order to ensure network reliability at the best socio-economic cost. RTE will provide the GQP with distribution vectors of the errors on load, on renewable energy sources (RES) and on external injections useful for simulating uncertainties on cross-border exchanges. This representation of uncertainties is generic and enables to take into account temporal and spatial correlations between uncertainties.
Figure 5: General flowchart of RTE's pilot test 8.3.1.
Figure 6 gives more details about the steps carried out in the day-ahead and real-time processes of Figure 5. In Figure 6 and all other figures, stacked boxes indicate that the same steps are performed on different realizations of the exogenous uncertainty (such as load and RES production) or after the occurrences of different contingencies.
Whole system
Area of interest: Risk evaluation zone
Figure 6: Details on the day-ahead and real-time processes.
The real-time snapshots in Figure 6 are created as illustrated in Figure 7. Following the application of the uncertainties a distributed load balancing function is requested from the GQP. The same function will be requested for normalization, and after contingency and remedial action simulations. This function could be market oriented or not but should preserve the general pattern of the production plan.
Figure 7: Creation of the real-time snapshots.
[image:24.595.47.508.404.628.2]Figure 8: Contingency simulation.
Finally, the preventive actions in Figure 5 and Figure 6 and the corrective actions in Figure 5 and Figure 8 will be simulated as illustrated in Figure 9.
[image:25.595.85.549.442.711.2]3.2.4 Output for analysis
One of the most interesting functionalities of the GQP will be the multi-level optimisation coupling decision making between preventive and corrective actions. The choice of implementing or not a preventive action will depend on different elements, such as:
• Probability, depth (consequences) and acceptability of the foreseen risk, • Cost and effectiveness of the preventive action,
• Availability, effectiveness, cost and reliability of corrective actions.
The notion of acceptability is fundamental for the implementation of a new RMAC by TSOs. The definition of the acceptability constraints to be met by the GQP can vary over time, depend on the nature of the risk and on the TSO particularities. Those acceptability constraints can be very complex, and result for example from off-line computations dealing with network stability. Figure 10 illustrates these concepts.
[image:26.595.62.508.339.572.2]For this particular test special thresholds on lost load in MW and MWh for N-k simulations and specific limits to be respected on some equipment for all the network states have been defined.
Figure 10: Multilevel optimisation problem, coupling between preventive and corrective actions and concept of acceptable states.
Finally, the relevance of the outputs of the GQP will be paramount. The RTE test is a large-scale test, performed on a whole year of simulations. We will focus principally on the statistical behaviour of global indicators such as:
• Socio-economic costs,
• Global quantification of the risk and efficiency of remedial actions (in MW and MWh for example).
For this reason the GQP is expected to quantify separately:
3.3
Workflow for pilot test 8.4.1 (Landsnet)
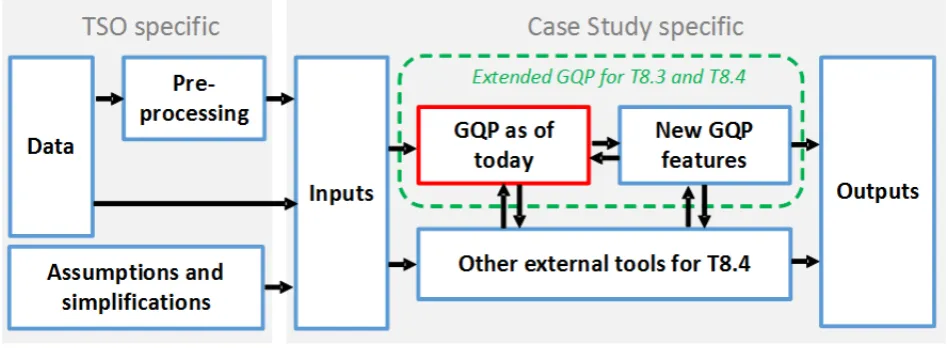
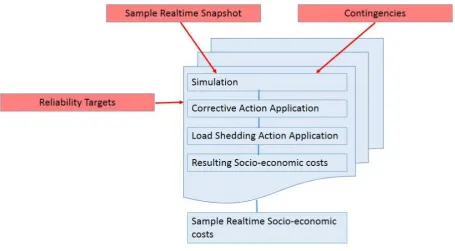
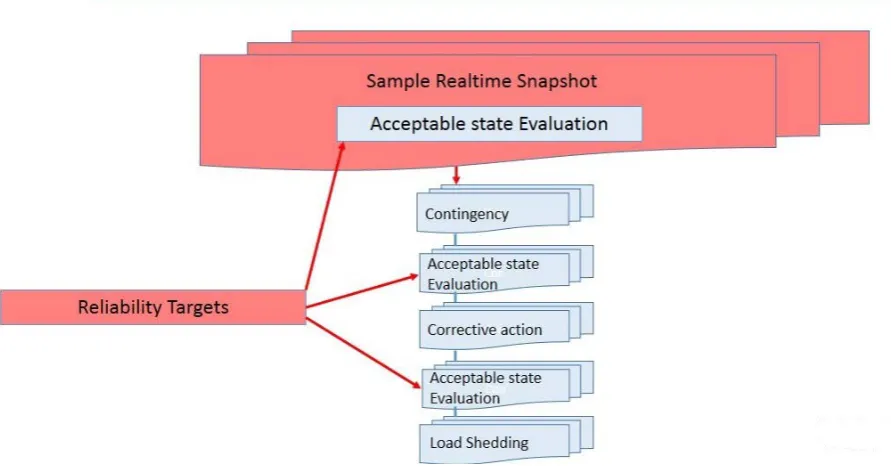
[image:27.595.122.513.189.414.2]This pilot test relates to real-time risk assessment on the Icelandic transmission system, as outlined in Section 2.3.2. The following sections describe the objectives and data requirements of the pilot test, and discuss the general modelling approach and the expected outputs. For reference, Figure 11 provides an overview of the modelling approach, which is elaborated on in the following subsections.
Figure 11: Workflow diagram of the RT near real-life pilot test at Landsnet. The models shown as stacks identify those which must be run for each credible contingency.
3.3.1 Objectives
The objectives of the pilot test are listed below, in order of decreasing priority:
i) Implement a RT risk assessment model using data available today at Landsnet ii) Test the impact of different modelling options on the speed of RT risk assessment iii) Investigate methods of displaying the output of the risk assessment
iv) Test the sensitivity of the risk assessment model to the RMAC parameters (including N-1) v) Test the sensitivity of the risk assessment model to failure rates
vi) Test the sensitivity of the risk assessment model to system protection and control action failure probabilities
vii) Test the sensitivity of the risk assessment model to changes in WACS logic
viii) Test the impact of including continuous uncertainty on the speed of the RT risk assessment ix) Extend the model to include optimisation of preventive control actions
x) Test the impact of this extension on model speed
xi) Assess the practicality of the suggested control actions to suggest shortcomings of the implementation and future improvements
3.3.2 Data collection
The data that will be available as input to the pilot test are: • Static file describing the system parameters and topology
• Load and generation data exports from the EMS system (5 minute resolution)
Results Pilot Test 8.4.1 Modelling Procedure
Inputs Data Data Processing Inputs Outputs Assumptions and Simplifications Contingency
Selection ResponseSystem
Criticality Calculations RMAC Parameters
(ΔE,ε,𝑿𝒂)
System Restoration Probability
Caculation
• List of available preventive actions • List of anticipated corrective actions
• Static file describing the system protection and wide-area control schemes • Component specific fault statistics
• Value of lost load curves [Efla, 2015] • TSO cost data
• 10 years of simulated historical weather data
3.3.3 Data processing
The data processing required consists of combining the static and variable system data into a single system model file that can be used within MATPOWER [Zimmerman et al., 2009], [Zimmerman et al., 2011]. Processing will also be required to generate time step specific lists of viable preventive and corrective actions (for the control problem, if time and resources allow) as well as formatting system protection and wide-area control schemes rules such that they can be input to a system response. Failure rate models will also be used to convert the fault statistics into failure rates, which can then be used to calculate failure probabilities.
3.3.4 Assumptions
Given the lack of data and tools, the following assumptions must be made: • Generator costs and emission data
• Consumer distribution at each node
• System protection and control action failure probabilities
• No continuous uncertainty (e.g. loads, weather, economic parameters) • Presence of secondary/curtailable load on the system
• RMAC parameters will be assumed and their impact on the risk assessment will be a subject of sensitivity testing
• Any outage resulting from a disturbance will last for at least the time period being assessed • Assume that FACTS devices are fixed or don‘t exist, due to a lack of real-time data
3.3.5 Modelling procedure
The previous three sections relate to the TSO-specific assumptions and data required to perform a probabilistic risk assessment in real time. Given the above data, the modelling procedure is planned to be as follows:
1) Generation of a set of credible contingencies
2) Calculation of the probability of each contingency from the failure rates 3) For each credible contingency:
a) Generation of a set of possible system response trajectories (given failures of control and/or system protection) using a cascading failure model
b) For each possible trajectory:
i) Estimation of the restoration of the initial system state to determine the quantity of energy not supplied
ii) Calculation of the socio-economic surplus of each trajectory, and checking of its compliance with the acceptability constraints
iii) Calculation of the probability of each possible trajectory
4) Aggregation of the results of 3.c into expected values for the system state
3.3.6 Probabilistic assessments
The uncertainty in this model comes from two sources, the possibility of contingencies and the uncertainty of system response (system protection or corrective control failure). The set of possible contingencies is reduced to a set of credible contingencies, using a contingency discarding process. This process estimates the residual risk associated with the discarded contingencies, ensuring that the residual risk is below some predefined threshold. The risk associated with the credible contingencies will be estimated by enumeration, as defined by step 3 in the modelling procedure above.
3.3.7 Optimisation problem
The reliability assessment is not an optimisation problem, but particular models used within the system response part of the reliability assessment use optimisation models (AC-OPFs) to simulate the automatic response of the system to each disturbance. This model will aim to simulate the redispatch of generation to mimic the generators operating under droop control. Other control actions are not considered as variables in the system response model, given the assumption that only the planned corrective control actions are taken. That is, the pilot test does not attempt to model the actions of the operator.
An extension to the optimisation of preventive and corrective control, including the setting of system protection schemes, may be pursued if time and human resources are available. The approach has not been formulated yet, but it is anticipated that the optimisation would follow a similar iterative approach, as described by [Karangelos et al., 2016].
3.3.8 Outputs
The specific outputs are not yet defined, and will be the topic of investigation in the third pilot testing objective. The general, system-wide outputs however will be:
• The probability of satisfying the acceptability constraints • The expected socio-economic surplus
• The residual risk of the discarded contingencies • Calculation duration
The sensitivity testing will assess the impact of changing the various inputs on these four system-wide parameters.
3.4
Workflow for pilot test 8.4.3 (Elia)
This pilot test corresponds to Elia’s long-term test. The introduction to this test is outlined in Section 2.3.4. This pilot test aims at selecting the most representative operating scenarios to be foreseen and to identify the weakness of the power system to meet demand whilst maintaining an adequate level of reliability as dictated by the reliability criterion. Therefore, it does not aim at identifying the best grid reinforcement but to serve as an input for the planner to design candidate grid reinforcement.
Figure 12 gives the step-by-step approach of Elia’s pilot test in a form of a flow chart. The current method used for system development in Elia for this screening is a multi-state approach that is based on the best estimates of forecasted values. We would like to compare this approach with the approach proposed by WP4 of the project.
Figure 12: Pilot test to compare the GARPUR methodology and Current Elia’s Multi-state Approach.
3.4.1 TSO-specific information
In the following, we give details about the leftmost box in Figure 12: TSO-specific information.
3.4.1.1 Data
Three types of data are necessary to enable a TSO to plan for system development investments: market modelling data, reliability data and historical data. These three types of data are dependent on the time horizon considered. For this pilot test we use 2030 as a reference year. Moreover the grid model is required to check system response on the given data.
The grid data contains information about the current grid and information and assumptions for future grids. For the test case, the grid data will contain the full Belgium network and the 5 external networks (France, Germany, Netherlands, Luxembourg and Switzerland) from ENTSO-E data (with base voltage ≥ 150 kV). The grid model will be modelled in DIgSILENT PowerFactory. In addition to the grid data, detailed information is needed about the loads and generators that are connected to the grid as well as information and assumptions for the neighbouring grids. This information is contained in ENTSO-E visions. It is proposed to use the fourth ENTSO-E vision of the future: “slow progression” in [ENSTO-E, 2014].
The market modelling data is required to find the credible dispatches of centralized generation and to assess the market behaviour. The minimal requirements are [GARPUR, 2015a]:
• Relative prices of generating units (ENTSO-E data).
• Rules and data that allow credible situations to be synthesised regarding the availability of power from wind, solar and hydro power (historical ENTSO-E data for external countries).
For the reliability data, the only available data are the failure and repair rates (historical data) for the elements of the Belgian grid. Elia has no robust information on the evolution of this data for future years and has little information on the reliability of grid elements of neighbouring networks. If needed for the test, it is proposed to consider that the reliability data of the external grid elements is similar to that of the internal grid element.
The available historical data at Elia are the load measurement (15 minute measurements) for all medium voltage substations (base voltage ≤ 36 kV). Moreover, a large part of distributed generation is measured
(15 minute measurements). These data are under csv format.
3.4.1.2 Pre-processing
The two steps for pre-processing are as follows:
• The first step is to ensure that all the data is in a coherent form to be used by the analysis part. For example:
o Creation of the failure rate and repair rate by type of equipment based on past
observations,
o Extraction of load profiles, wind and solar production profiles over the last years.
It is expected that functionalities from the GQP in pseudo-code or implemented in MATLAB or Python could be supporting this step.
• The second step is to provide the information necessary to generate credible operating states. Since the method for the generation of operating states is sequential (1 year in one-hour time steps) and it is based on market simulations, it is necessary to provide time series for the renewable energy source (RES) generation and the load. Thus, on the basis of the analysis of historical data, the pre-processing must provide Monte-Carlo (MC) years for a target year (e.g. 2030) for the RES and the gross demand on countries of the study area. The MC years are generated using the MC methods (as they are used in another FP7 project eHighways2050 ) and are used to model the underlying uncertainties in demand and generation for the target year.
3.4.1.3 Assumptions, Simplifications and Acceptability Constraints
We use the clustering process that is proposed in the task T4.2 of WP4 to build a set of credible future operating states. The following assumptions are made to perform the test in a near-real-life environment:
• The clustering will be limited to Belgian data:
o For the load, the clustering will be limited to national and regional loads (and a scaling
factor will be used to identify the local loads within the regional load),
o Clustering of wind and PV will be limited to regional level.
• For steady-state contingency analysis after clustering:
o The analysis will be done using AC-load flow
o The contingencies will be limited to the Belgian network, or if relevant, to external grid
elements of the external influence area.
o Only the typical preventive and corrective actions for each contingency will be
implemented.
The contingency screening process will define the criteria to be used to classify which operating states are secure and which are insecure but also, for each contingency (including eventually the no-contingency state), to record the strength of the constraint violation per element.
Finally, it is also important to specify that the strength of a constraint violation does not only depend on the quantification of the violation but also on the nature of the remedial action needed to bring back the operating state to its secure state. This part, related to the operating cost estimation will only be used if an optimal power flow (OPF) approach is available.
Therefore, as it will be detailed later, two approaches could be used to define an insecure state:
• To see how large the violation is. This leads to the issue of weighting different violations (e.g. overloads or overvoltages) and violated elements (e.g. major 380kV line or local 36kV/MV transformer).
• To study how much it costs to solve the violation problem.
The criteria to be used to identify a violation are as follows: • The criteria related to voltages are given in Table 2.
• The criterion related to overloads is given in Table 3. From Table 3 we can observe that if a temperature is given for an operating state, then it is possible to deduce the corresponding season as the temperatures defined in the table do not overlap for seasons.
[image:32.595.71.502.417.629.2]• The criteria related to short-circuit power are given in Table 4.
Table 2: Voltage acceptability constraints.
Voltage level 380 220 150 70 36 30
Material limit 420 245 170 82.5 40.5 36.0
Operating voltage 100% 400 225 155 70 36.0 30.0
High voltage In all
situations 105% 420 236 163 73.5 37.8 31.5
Low voltage
For N and N-1 situations (except N-1 busbar)
92.5% 370 208 143 64.8 33.3 27.8
For N-1 busbar and N-X situations with X>1
90.0% 360 203 140 63.0 32.4 27.0
Table 3: Overload acceptability constraints.
Seasons From day To day Temperature Line
(of Inom*) Cables (of Inom*) Transformers (of Inom*)
Winter 16/11 15/03 0° < T° < 11° 112% 100% 107%
Inter-season 16/03 Or
30/04
[image:32.595.56.506.673.768.2]Seasons From day To day Temperature Line
(of Inom*) Cables (of Inom*) Transformers (of Inom*)
01/10 Summer 01/05 Or 01/09 15/07 Or 30/09
17° < T° < 23° 100% 100% 98%
High Summer 16/07 31/08 T=30° 90% 100% 92%
[image:33.595.162.473.261.343.2]*Inom = nominal current.
Table 4: Short-circuit power acceptability constraints.
Voltage level 380 220 150 70 36 30
Short-circuit power (MVA)
32.9
41.5* 15.2 10.39 13.0* 3.82* 2.42 1.96 1.64
* represents specific busbars.
Finally, if possible to be computed, a minimum short-circuit power at 380kV, 220kV and 150kV substation where non-renewable generations are connected should be at least twice the nominal power of the machines at that substation (i.e. this is a simplification of the stability criteria Ssc_ext/Sn>5 where Ssc_ext is the contribution in terms of short-circuit from the grid, and Sn is the nominal power of the machine).
The estimated operating costs for the remedial actions can be assumed as follows: • Redispatching cost: 80€/MWh
• Renewable generating curtailment: 150€/MWh • Load shedding: 8 000€/MWh
For sake of simplicity, the estimated duration of a remedial action is associated to the duration of the clustered operating state.
Finally, some remedial actions should be applied preventively in order to avoid situations of high risk (i.e. where risk is above some given threshold.). Other remedial actions should be applied curatively (i.e. with a probability which is the probability of realization of the contingency in this operating state). A simple proxy for applying preventive actions could be as follows:
• High voltages are above material limits.
• Low voltage are below 90.0% of Operating voltage (see criteria above for N-1 busbar and N-X situations with X>1.
• Line, cable or transformer with overloads 30% above the nominal current. • Short-circuit power is above acceptance criteria (see above).
• Short-circuit power is below acceptance criteria (see above).
3.4.2 Long term screening of operating state
3.4.2.1 Generation of operating states
An operating state is a particular realisation of the network configuration, generation and demand levels, as well as flows between interconnected control areas. A market model tool written in Python and previously developed at Strathclyde University will be used to generate time series of operating states (e.g. hourly operating states). This model is a unit commitment model with economic dispatch. The input for this tool is demand, generation capacities and cost functions of various generation types. The output will be a time series of generation commitments and operating states.
3.4.2.2 Selection of operating state
This selection step is intended to provide operating states for steady-state analysis. Thus, for each of the seasons as defined in Table 4, typical days are clustered.
Work is ongoing in work package 4 to develop a method to carry out this step. Nevertheless, the first approach would be to perform a DC load flow (DC-LF) based on time series provided by the box "generation of operating states". Then, clustering is performed based on the results of the DC-LF. Possible criteria for clustering could be:
• Physical flows on different border lines, • Net balance of the country.
3.4.2.3 Contingency selection (or contingency generation)
In line with the ideas defined in Task 4.2, the security of every clustered operating state (except N-1-1, see below) will be checked for:
• The N-0 situation
• The N-1 situations representing unplanned contingencies and for which the typical topological curative actions are stored in a database and applied.
• The N-1 situations representing planned outages. Typical topological preventive actions for each planned outage are stored in a database and applied.
• The N-1-1 situations with the 2 elements located in the same electrical area. This situation represents a planned outage and an unplanned contingency. Typical topological preventive actions for each planned outage are stored in a database and applied. For unplanned contingencies, the typical topological curative actions are stored in a database and applied.
It is important to note that, as a proxy of the maintenance planning stage, we consider that it is not needed to plan high voltage grid element outages during high load situation (winter periods) and during summer periods with low line ratings and low crew availability due to the matching with the holiday period. Therefore, we propose to sample the N-1 planned outages situation and N-1-1 situations for the inter-season period only.
3.4.2.4 System Response Model
The system response model will be AC load flow computations checked at 3 time instants:
• Pre-incident steady-state behaviour (i.e. N and N-1 planned outages). Ideally an OPF should be computed. If this functionality is not available, local voltage droop controller will be implemented for every transformer and for voltage control of every generator having MVAr contracts.
control on generators above 25MW will be active. No curative control will be applied. The conditions for selection between preventive and curative actions (see above) should be checked. • Post-incident steady-state behaviour (15min<t<30min-1h) (i.e. N, N-1 unplanned contingency and
N-1-1). In addition to the system response of the previous time frame, voltage droop control on generator with MVAr contracts and on manual tap changer are implemented together with the topological curative actions to represent the system operator actions.
[image:35.595.80.568.232.562.2]The details of the system behaviour are provided in Table 5.
Table 5: System behaviour.
Pre-incident steady-state behaviour Intermediate behaviour (500ms<t<15min) Post-incident steady-state behaviour (15min<t<30min-1h) Objective Optimal voltage regulation incl. optimal
share of reactive reserves
Automated reactions, temporary overload of equipment, no manual
actions
(non-optimal, pre-scribed) manual actions, steady state
equipment ratings
Most Elia transformer Optimal tap No tap change Manual LDC like control
Elia transformer
towards 36kV pockets Optimal tap LDC control LDC control Distribution
transformers V control @ MV busbar V control @ MV busbar V control @ MV busbar
Units P<25MW Q=0 @Scc* Q=0 @Scc* Q=0 @Scc*
Units P>25MW, no
MVAr contracts Q=0 @ HV busbar Voltage droop@ HV busbar Q=0 @ HV busbar
Units P>25MW with
MVAr contracts Optimal V control @ HV busbar Voltage droop@ HV busbar Voltage droop@ HV busbar
Shunts Optimal usage of shunts Enable shunts tap control
*Scc: Short-circuit power
In addition to the above, if a curative control optimal power flow (OPF) is available, this OPF is applied to the post-incident steady-state behaviour in order to represent the costly remedial actions (redispatching, renewable generation curtailment and load shedding). For sake of simplicity, this steady-state incident is considered to last for one hour. In addition, again for sake of simplicity, no cascading event due to overloads, undervoltage, undervoltage or dynamic event is represented.
3.4.2.5 Steady-state analysis
In a power system, single element outage (N-1) often leads to small changes and also to limited transients. Therefore, the post-incident operation of the power system can be modelled by an algebraic model i.e. not a time varying model. In this subsection we define a methodology to perform a steady state security analysis of a power system.
can be obtained by a market model, single slack bus of distributed slack bus as well as voltage control scheme (e.g. OPF for optimal reactive power management or local controllers at generator terminals). The objectives that we want to achieve through the steady-state security analysis are as follows:
• Rank the credible operating conditions according to criticality: most critical post-incident operating conditions require attention of a system planer;
• Answering the question: “how critical is the critical condition?” We note that an overload of a line can be tolerable if it is not too big and does not happen for too long. Similarly some voltage violations are more tolerable (or can be quickly mitigated) than others.
To achieve the above objectives, we propose two methods to implement in the pilot test.
The first method, termed steady-state security analysis, is rather straight forward and depends on the magnitude of the overload (steady-state security analysis). Load flows are solved for all the credible operating conditions and the constraint violations are recorded. A threshold depending on the exogenous variables is set (e.g. in winter line ratings are 110%). Any violations exceeding the threshold are collected in a set and are ranked based on the value of the constraint violation. In order to compute these violations, automated reactions of the loads, generators and tap changer need to be implemented in the security analysis as defined in “System Response Model“.
The second method, called secure market dispatch, is slightly more involved and ranks the critical operating conditions based on the cost of corrective actions, which would be implemented if the time and resources permit. An optimization model that is centred at the post-contingency operating state is constructed to identify the most efficient curative actions. Strict constraints are imposed on the bounds and the optimization problem is solved to re-secure the operating state. The solution of this optimization problem will provide us with the cost of the corrective action. Based on the cost of corrective action, the critical operating conditions are ranked noting that the most critical operating conditions are those that are most expensive to correct.
3.4.2.6 Post-processing
After the computation defined in the phases “Steady-state analysis”, data will be aggregated taking into account the probability of occurrence of each situation in order to screen the operating state and the contingencies that are the most contributing to the risk of the operation of a power system such as the one proposed.
3.4.3 Results
In the context of this near-real life test case, the “GARPUR approach” will be the simplified representation of the work of WP4 on long-term screening of operating states, which is to be implemented as described above. In order to validate the approach, the following indicators will be needed:
• Screening indicators will provide the planner with information about needed grid reinforcements and situations in which these grid reinforcements are needed. These indicators are described in Section 0
3.4.3.1 Outputs of GARPUR approach The outputs of the GARPUR approach will be:
• Supporting information for the planner:
o Priority list of weaknesses of the power system. This priority list takes into account the
probability of occurrence of each N, N-1 or N-1-1 situations as well as its impact to define risks (probability*impact).
If the “steady-state security analysis” is implemented, the impact will be defined by the magnitude of the violation weighted by a severity factor function of the violation type and by the element type.
If the “secured market dispatch” is implemented, the impact will be defined by the operating expenditures (OPEX) needed to solve the constraint.
o Annual average, maximum and minimum total system risk.
• For each screened operating state, for each screened planned and unplanned outages situation, for each element and for each operating constraints, the following information will be provided:
o A histogram of the constraint violations. o The probability of the constraint violations.
o The average, minimum and maximum values of the constraint violations.
o Evaluation of the quality of the clustering of operating states: some indicators will be
provided on the quality of the clustering. These indicators still need to be defined in the further work.
3.4.3.2 Outputs of GARPUR approach for the comparison with the multi-state approach
On basis of data provided by the GARPUR approach and the Multi-state approach, the pilot test study aims to make a comparison. First, the comparison will be quantitative in terms of:
• Total computing time,
• Number of screened operating states to be further studied by the planner.
4
METHODOLOGY FOR THE ASSESSMENTS OF PILOT TESTS
In this section, indicators that can be used to either assess or compare different reliability criteria are given. In Section 4.1, the indicators proposed by the work in work packages 2 and 3 are reviewed. In Section 4.2, the indicators outlined in the specifications of the pilot tests are summarized. In Section 4.3, the indicators which are currently available in the GARPUR quantification platform (GQP) for the pilot tests in task T8.3 are listed.
4.1
Assessment as proposed by the theoretic work of GARPUR
4.1.1 Socio-economic impact assessment
This section summarizes the socio-economic impact assessment as proposed by work package 3 (WP3), focusing on a qualitative description of the assessment method rather than looking at the details, for which the reader is referred to [GARPUR, 2016]. The socio-economic impact assessment under development in WP3 aims at studying the difference of surplus between different reliability-related TSO decisions in multiple decision-making contexts, both aggregated and for different stakeholder groups separately. The socio-economic impact assessment is carried out for a system defined by:
- The assessed market, i.e. the electricity market.
- The included stakeholder groups, i.e. electricity consumers, electricity producers, the TSO, the government surplus from taxes on electricity and environmental surplus from electricity related externalities.
- The geographical scope, i.e. the TSO area and neighbouring areas affected by the TSO decisions to the extent that the impact is significant. This geographical scope also needs to be defined in the pilot test.
Surplus is defined as the difference between the benefits and the costs to a stakeholder or the system under study. As the difference in surplus will be studied, only costs and benefits that significantly change between different decisions need to be included.
The overall socio-economic indicator proposed by WP3 is aggregate surplus in the system. It is defined as the difference of consumer benefit and all costs and can be formulated in simplified form as:
𝐷𝐷 price-inelastic demand [MW]
𝑣𝑣 value of served load [€/MWh]
𝑢𝑢 unserved load [MW]
cINT interruption cost [€/h]
𝑐𝑐𝑔𝑔𝑔𝑔𝑔𝑔 variable generation costs [€/MWh] 𝐶𝐶𝑔𝑔𝑔𝑔𝑔𝑔 generation investment costs [€/h] 𝑐𝑐𝑇𝑇𝑇𝑇𝑇𝑇 variable TSO costs [€/h]
𝐶𝐶𝑇𝑇𝑇𝑇𝑇𝑇 fixed TSO costs [€/h]
𝑐𝑐𝐸𝐸𝐸𝐸𝐸𝐸 environmental cost [€/MWh]
𝑐𝑐𝑐𝑐𝑐𝑐𝑔𝑔𝑔𝑔 congestion cost [€/h]
𝑆𝑆=𝐷𝐷𝑣𝑣 − �cINT+𝑐𝑐𝑇𝑇𝑇𝑇𝑇𝑇+𝐶𝐶𝑇𝑇𝑇𝑇𝑇𝑇+𝐶𝐶𝑔𝑔𝑔𝑔𝑔𝑔+ (D−u)(𝑐𝑐𝑔𝑔𝑔𝑔𝑔𝑔+𝑐𝑐𝐸𝐸𝐸𝐸𝐸𝐸) + c𝑐𝑐𝑐𝑐𝑔𝑔𝑔𝑔� [€/ℎ],