ORIGINAL ARTICLE
Lessons from mixing OR methods in practice:
using DES and SD to explore a radiotherapy
treatment planning process
Jennifer Sian Morgan
1, Val
Belton
2and Susan Howick
21Cardiff University, Cardiff, U.K.;2University of
Strathclyde, Glasgow, U.K.
Correspondence: JS Morgan, School of Mathematics, Cardiff University,
Senghennydd Road, Cardiff, Wales CF24 4AG, U.K.
Received: 4 November 2014 Revised: 1 December 2015 2nd Revision: 27 April 2016 Accepted: 27 April 2016
Abstract
Mixing Operational Research (OR) methods is becoming more commonplace. Discrete-Event Simulation (DES) and System Dynamics (SD) are popular model-ling methods previously applied to a range of situations for various purposes, which are starting to be mixed in healthcare. However, the practicalities of mixing DES and SD in practice remain unclear. Radiotherapy treatment is a complex multi-stage process where technology and best practice continue to evolve. This paper describes a project undertaken to explore the treatment planning process using mixed OR methods. It presents insights obtained through mixing OR methods within a real-world project. The model develop-ment process, the role of each modelling method and the benefits of under-taking a mixed OR methods project design are described. Lessons for mixing DES and SD, and more generally mixing OR methods, are discussed.
Health Systemsadvance online publication, 17 June 2016; doi:10.1057/hs.2016.4
Keywords:mixing operational research (OR) methods; discrete event simulation (DES); system dynamics (SD); radiotherapy treatment planning modelling
The online version of this article is available Open Access
Introduction
Discrete-Event Simulation (DES) and System Dynamics (SD) are widely applied modelling methods that have clearly demonstrated their potential benefit to healthcare (Taylor & Lane, 1998; Cooper et al, 2007). The potential for mixing the methods has been discussed within the broad simulation community (Renshaw, 1991; Morecroft & Robinson, 2006), and also with regard to healthcare (Brailsford et al,2010). However, how the methods may be mixed within the Operational Research (OR)field, both in theory and in practice, remains a topic up for discussion (Brailsfordet al, 2010). This paper seeks to contribute to the discussion around the need for modellers to connect the rationale for mixing methods with the realised benefitsin practice(Howick & Ackermann, 2011). Therefore, this paper uses a real-life project mixing DES and SD in practice with a radiotherapy treat-ment centre to reflect on the value and practicalities of mixing in practice.
Background
the modelling community to utilise mixing and the areas where further work is needed are then discussed.
SD and DES have been successfully applied indepen-dently to a range of health systems (Brailsford & Hilton, 2001). Both are popular yet distinct methods in the systems modellingfield and previous work has highlighted the potential to offer complementary insights with bene-fits found in mixing them (Brailsford et al, 2014). Few examples of reflections on the practice of mixing DES and SD exist (Viana et al, 2014), and how to successfully undertake a mixed methods modelling process in real life is unclear (Brailsfordet al, 2010).
Discrete-event simulation
In DES the dynamics of the system are driven by events. This allows users to model the individual events experi-enced within a system and the stochastic nature of the simulation encourages representation of the variability encountered in real life (Robinson, 2003). DES is often used to represent systems at an operational level, where indivi-dual detailed interactions and experience of entities over time is important and the variation in service experienced may be a key measure. Overall, DES has a characteristic style but may be applied in a variety of ways and have different characteristics depending on the problem situation it is applied to.
The method has widespread appeal as it allows a mod-eller to produce a simulation that may be a direct physical representation of the system under study, at the individual entity level. The variability inherent in everyday life can be captured and the interaction effect of stochastic elements can be observed. However, DES does not explicitly seek to model feedback; development can be timely (and costly); and it is heavily dependent on data to inform the system behaviour.
System dynamics
SD is used to discover the underlying principles and behaviour of complex systems over time thus capturing the average flow of the system (Forrester, 1958). It is a variation of continuous simulation modelling and may be characterised by its ability to represent feedback in sys-tems. Feedback exists where‘an action-taker will later be influenced by the consequences of his actions’(Roberts, 1978, p. 7), and a feedback system is one that contains two or more interconnected loops. The efficacy of SD is based on its ability to capture the whole system rather than focusing on short-term goals and single measures of performance, which can lead to ineffective conclusions (Taylor & Dangerfield, 2005). The method has broad application and is often used for strategic issues such as: policy analysis (Taylor & Lane, 1998) and assessing the potential impact of altering services (Taylor & Dangerfield, 2005). The method cannot easily represent uncertainty in the data (Doebelin, 1998) but is effective at representing large (uniform) populations and simulating these systems quickly. This is useful within Healthcare to evaluate the
long-term impact of complex policies (Kuljiset al, 2007). Models are, in general, a macroscopic view of a system, with an interest in how the system structure impacts the system behaviour, recognising that the behaviour of indi-vidual components of a system is distinct from the beha-viour of the system as a whole.
Comparability and complementarity
An early comparison of SD with other forms of quantita-tive modelling is given by Randers (1980) and discussed by Lane (2000). Comparisons of SD specifically with DES are also made by Sweetser (1999), Brailsford & Hilton (2001), Morecroft & Robinson (2006), Tako & Robinson (2009, 2010) and Chahal & Eldabi (2008). However, many of these authors seek to place the two methods into two distinct boxes rather than highlight the similarities. Both methods are described as providing value and insight to the systems they seek to capture and the problems they aim to address. Both methods are suitable for providing increased understanding and aid decision-making and, in reality, the two methods demonstrate significant overlap.
All useful models are simplifications of reality but each method simplifies differing aspects of a system (Meadows, 1980; Pidd, 2003). Embedded within each method are its philosophical assumptions and principles. A primary con-cern when considering mixing methods is the issue of paradigm compatibility as both SD and DES have quite separate modelling philosophies (Lane, 2000). SD utilises feedback while adopting a system view to examine how causal structure results in observed behaviour. DES tends to focus on performance over time, illustrating how ran-domness influences behaviour (Tako & Robinson, 2009). However, these differing philosophical views, coupled with capturing a system and its problems at different levels of detail, may yield interesting alternative insights.
Both methods develop the understanding of a system (Tako & Robinson, 2009). DES often adopts an operational view to understand the detail complexity and explore different configurations (Chahal & Eldabi, 2008). SD may take a strategic view in order to appreciate how a system alters over time (dynamic complexity) and what impact the structure and feedback mechanisms have on the system (Owenet al, 2010). There is no question that each method has its place, but the primary difference is that DES does not obviously allow the user to understand the underlying mechanics of changing information and feed-back; whereas these links andflows are transparent in SD (Tako & Robinson, 2010). The choice between DES and SD should be informed by the problem and the system (Borshchev & Filippov, 2004).
NOT the only pebble on the beach and it is not the most appropriate approach to all problems at all times’(Coyle, 1977, p. 355). It is Coyle’s own emphasis on the‘NOT’that forces the reader to acknowledge the strength of this state-ment. It would be easy to start to believe that SD is capable of tackling any system or indeed question thrown at it.
This discussion of SD and DES illustrates that it is not possible to simply map and compare the methods to reveal the potential for combination. It is necessary to obtain an understanding of the situation under study and then explore the potential modelling methods and whether it is appropriate and beneficial to mix them. The choice between DES and SD‘often seems to be made based on an unknown, or at least unstated, user preference function’ (Koelling & Schwandt, 2005, p. 1322). If SD is efficient in policy design interventions and DES is efficient with policy implementation problems (Ceglowski et al, 2007), the question arises: can we have both? Simulation modelling can be time consuming (An & Jeng, 2005) and so could mixing methods help to reduce the time taken to produce useful, insightful models or increase the applicability and overall use of models?
Mixing OR methods
When embarking upon a simulation study two aspects should be examined to decide the focus of the study, and determine the level of accuracy and detail required in the model: the nature of the system (system) and the nature of the study (problem) (Pidd, 2004). Merely examining the problem perspective can be misleading (Laneet al,2000). Indeed, Lorenz & Jost (2006) highlight the need forfitting the problem and system to the methods when combining paradigms. Method selection is often a personal choice and in practice the modeller can be guided by familiarity with a particular method (Brailsford & Hilton, 2000). Proponents of a specific method should take a‘step back and assess which conceptual toolkit should be used’ (Chick, 2006, p. 22). Work exploring the model building process of SD and DES empirically supports this com-monly held view that modellers will embark on a study without first considering alternative modelling methods (Tako & Robinson, 2010).
Mixing OR modelling methods raises many philosophi-cal issues that Mingers & Brocklesby (1997), Mingerset al (1997) and Lane (2000) discuss at length. Jackson (1999) and Kotiadis & Mingers (2006) add to this discussion of the benefits and potential problems of mixing OR methods in general. Cultural and cognitive concerns impact the feasi-bility of a mixed OR methods project as organisations and individuals may not be open to the methodology. However, real-world problem situations are highly complex and multidimensional, and potentially may benefit from differ-ent paradigms to focus on differdiffer-ent aspects of a situation.
Mixing DES and SD
Despite the limited selection of work that exists in the area, mixed DES and SD modelling is undertaken in a
range of disciplines: Management Science, Mathematics, Computer Science and Engineering. The literature can be split into two groups: work describing a hypothetical or sample project selected by the modellers to illustrate a specific approach to mixing the methods, and real-life projects that have used mixed SD and DES to contribute to a problematic system (the focus of this paper).
Lane (2000) recommends using both DES and SD to develop a richer understanding of a problem and system. DES and SD have been mixed in a variety of ways (discussed in Morgan, 2013). This can range from the methods being used to provide comparative insights to the same problem with the same level of detail modelled, to the methods being fully integrated with each method influencing the other throughout the simulation time. Even the relatively low number of mixed DES and SD projects in the literature illustrates that philosophical, conceptual and technical concerns are no longer a barrier to mixing the methods. Mixing simulation methods is viewed by some as‘no big deal’ (Pidd, 2012), but the modelling processes involved (and the benefits thereof) are unclear.
In practice, Djanatliev et al (2014) note that mixing methods was challenging and time intensive, but the initial effort will be rewarded through reuse in the design stages of later projects. Ingenuity, creativity and question-able assumptions may be required tofit a problem within a single modelling paradigm and so mixing methods may be the only appropriate choice (Viana, 2014). Zhu & Mostafavi (2014) focus on the challenge of the technical aspects of mixing DES and SD (as illustrated by a simple example), but no comment is made on the modelling process as a whole. All cases note similar key experiences of mixing methods from the modeller’s perspective: experience (in mixing and the methods) is required, it is challenging technically, and each problem is unique. Onggo (2014) adds to this emphasis that there are design decisions required in mixing methods (to decide whether to implement elements of models), and these design decisions form part of the modelling process. SD and DES have been successfully mixed but insight is still needed into a‘practical methodology for combining SD and DES in a real context’ (Brailsford et al, 2010, p. 2294) and lessons for mixing OR methods in practice (Howick & Ackermann, 2011). It is unclear what design choices are made throughout a mixed methods modelling process.
The following section summarises an action research project undertaken to explore mixing DES and SD in practice. All stages of the project are discussed: from initial problem structuring (highlighting the unique roles SD and DES), model conceptualisation (considering complemen-tarity of methods), to the final models developed in collaboration with stakeholders.
Model development
problem definition, the DES and SD models, respectively, and the model assumptions follows. The development of the models was an iterative process but is presented in two distinct sections for clarity.
Setting and research methodology
The Beatson West of Scotland Cancer Centre is Scotland’s largest cancer centre serving a population of 2.6 million. The centre provides holistic cancer care, but this project is focused specifically on radiotherapy, with the centre deli-vering over 300 doses of radiotherapy per day (www .beatson.scot.nhs.uk). Radiotherapy can be used to eradi-cate cancer cells to eliminate disease (radical treatment) or to relieve cancer symptoms (palliative treatment). Patient treatment is a complex, multistage process that intends to cause as little harm as possible to normal cells by aiming the treatment at the affected area of the body. It requires careful planning and has to be tailored to individual patient physiology. The key stages involved with radio-therapy are booking, simulation, planning and treatment. These are interrelated stages with feedback throughout as a patient’s treatment plan may need to be altered or scans may need to be redone. The department continued to face numerous strategic and operational issues, with external and internal influences, and this project provided the client with an opportunity to choose to examine these from a new perspective.
Action research was the overarching research methodol-ogy for this project. Action research is a cyclical and reflexive research, to generate living theories (McNiff & Whitehead, 2006). It is a systematic process of enquiry to enhance the outcome for clients, providing methods to improve intervention effectiveness (Stringer & Genat, 2004). The researcher was a participant in, rather than an impartial spectator of, a project. This meant the researcher engaged in and reflected on the model-building process in order to examine the applicability and challenges of mix-ing DES and SD. The settmix-ing of this research bemix-ing a real, complex system enabled contribution of practical insights. Semi-structured interviews were used for the initial system exploration (discussed in the next section). Unstructured interviews with the client throughout the project were used to develop the models, the recordings of which were examined to generate insights into the model development process and mixing DES and SD. Modeller and researcher insights are provided alongside insights from the client through reflection (consisting of note-taking and maintaining a reflective diary).
Problem and system exploration
As the problem at the centre was not well defined it was necessary to examine potential areas for investigation and determine focus. The initial phase of the project was to explore the system and structure the problem by eliciting issues and views from stakeholders using techniques equally applicable to SD and DES. Causal mapping was utilised to focus on the beliefs, values and assumptions an
individual has about the system and reveal issues in an unbiased manner, enabling the large amounts of informa-tion to be collated and detailed and holistic properties to be explored (Ackermann & Eden, 2005).
Individual interviews were conducted with seven stake-holders selected to represent a range of views held within the Radiotherapy Department, including management, clinicians and radiotherapy staff. These interviews were semi-structured and aimed to explore the system of inter-est, highlight aspirations, expose areas of concern and eventually lead to definition of the problem area(s). Inter-views were mapped and merged to form a collective causal map of the system. This was examined to identify key themes and areas of focus for the project. Interviewees were asked to confirm that the resulting group map of the system was a fair representation of their views to ensure relevance.
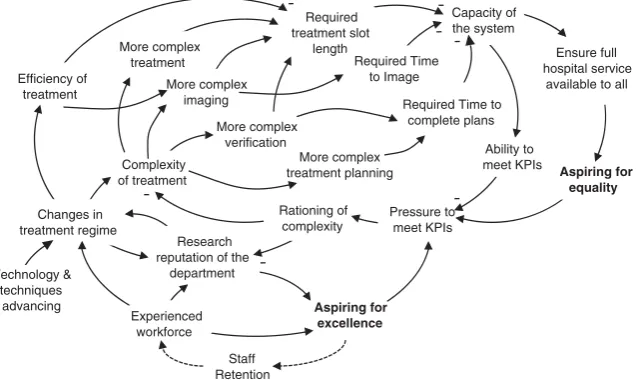
The issue selected for the project was Treatment Com-plexity and Changes in Treatment Regime. This was a high priority issue, with DES-like and SD-like questions raised in relation to it, with a wide impact on the performance of the system. Afractionis the base unit of treatment during a visit to the radiotherapy department, delivered at regular intervals (such as daily). Aphaseof radiotherapy treatment consists of several treatment fractions. A single course of treatment is designed around a single treatmentregimeand may consist of one or more phases, requiring one or more treatment plans to be created. The complexity of these plans can vary for the different cancer types and the characteristics of the patient’s disease. Advances in radio-therapy research lead to new techniques becoming avail-able and the centre must decide which treatments to make available to patients. The centre is subject to performance targets around the time taken between initial referral and receipt offirst radiotherapy treatment fraction.
The nature of the problem is summarised in Figure 1. This diagram has been developed from the collective map and illustrates the aspirations of staff (seeking to maintain the Radiotherapy Departments reputation for clinical excellence), while ensuring that the impact of implement-ing new regimes does not negatively impact Key Perfor-mance Indicators and equality of access for patients. It also reflects the impact changing radiotherapy regimes has on the capacity of the system by changing the time required imaging, planning and treating patients.
The maps and interviews were re-examined to determine the key questions being posed to inform the project methodology:
1. What is currently provided at the Centre, how quickly and with what variability? How is resource availability impacting equality of treatment across all patients? 2. What is the impact of changing treatment regimes and
the mix of regimes? Is it possible to maintain current throughput?
3. What is the impact on different patient groups? 4. What can realistically be implemented and what
5. What would be the impact of a policy change regarding regimes?
These questions display both SD and DES characteristics. Mixing the methods would allow exploration of both goals, whereas adopting only one method would require several assumptions about behaviour to be made. In an SD model it would be necessary to assume all patients behave similarly; an SD model is not designed to reveal the range in variability patients may experience within the system. Conversely, within a DES it would be necessary to assume a fixed plan for the implementation of more complex regimes and not allow exploration of the systems propen-sity to cope with pressure (feedback within the system to reduce complexity).
Two key goals are extracted by examining the collective map and summarizing the questions:
Goal A: Explore the dynamics of government
tar-gets interacting with R&D adoption
Goal B: Examine the day to day impact of
chan-ging the complexity of treatment regimes
In this project, SD was used to capture the dynamic nature of the problem (Goal A), while DES was used to appreciate the impact on the day to day running of the centre (Goal B). It was felt that the two methods held explicit roles within the modelling intervention and that a complementary approach to modelling be adopted. In order to examine the day to day impact of changing treatment regimes it was necessary to develop an under-standing of the general influence complex technology adoption can have on the system.
This section has outlined the system and problem definition process undertaken with the centre. This work led to the focus of the models, the questions to be addressed during the intervention and design of the
combination of SD and DES. The following section pre-sents the models developed with the centre.
SD model
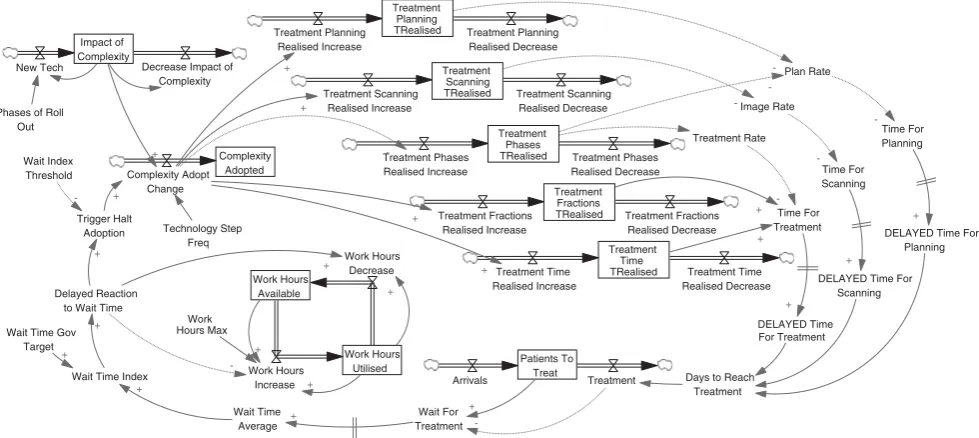
A SD model (illustrated in Figure 2) was developed to capture the dynamics of how the department responds to increasing referral to first treatment times by managing working hours and reducing the complexity of the treat-ment regimes adopted. As more complex treattreat-ments are introduced the expected treatment time increases. The initial impact on treatment time is higher than the
‘expected’ average level because of overall experience within the department dropping and this learning process has an additional impact on the realized treatment time, which impacts the wait experienced by patients. Staff (in thefirst instance) will try to manage the queue by working longer hours, allowing complexity to be maintained. As referral to first treatment times continue to increase the system seeks to reduce the adoption of complexity to balance the system.
This model is used to illustrate system management necessary to ensure that referral to first treatment times experienced by patients do not exceed government targets (or some other desirable level) by adjusting the pattern of complex treatment adoption and work hours. Delay is built into the model to reflect the time it takes for referral tofirst treatment time to be reported to management and thus to allow for a change in behaviour. This model captures the pressure to drive down referral tofirst treat-ment times, illustrates the careful balance that needs to be maintained within the system and that treatment time needs to be managed carefully.
The model consists of nine stocks.‘Impact of complex-ity’and‘complexity adopted’are scalars, and‘patients to treat’is measured in number of patients. The remaining six stocks represent resource time (measured in hours of a Efficiency of
treatment
Aspiring for excellence
Capacity of the system
Ability to meet KPIs
Pressure to meet KPIs Research
reputation of the department
Experienced workforce
Rationing of complexity More complex
imaging
Complexity of treatment
Required treatment slot
length
More complex treatment planning
Technology & techniques
advancing Changes in treatment regime
Staff Retention
Required Time to complete plans
Aspiring for equality
More complex
treatment Required Time
to Image
More complex
Ensure full hospital service
available to all
[image:5.595.139.458.83.273.2]verification
clinician’s time). As the level of treatment complexity available to radiotherapy physicists’changes over time, the Beatson chooses to adopt complex regimes depend-ing on the wait for treatment bedepend-ing experienced by patients.
The treatment process at the centre is modelled in SD as a single stock and flow, but may be broken down further using a DES to include the intricacies of theflow of patients. The SD model currently represents the average population behaviour within the system but further insights can be gained by considering the indivi-dualistic behaviour of patients and their respective treatment plans. The centre has numerous resource restrictions, varying treatment regimes and a range of routes a patient may take through the treatment process meaning that an increase in treatment complexity can
have extensive and diverse impact on the wait time for some cohorts of patients.
DES model
The conceptual model of the DES is presented in Figure 3. The four core elements of the model are circled (booking, imaging, planning and treatment). This model was used to provide more representative insights into the knock-on impact of altering the treatment time or number of treat-ment fractions for different groups of patients. Individual patient characteristics, timetables and work plans can be more easily and transparently represented in DES (see Appendix A for a more detailed representation of the treatment process and Appendix B for the final model). The model provided better understanding of the referral to
Treatment Planning TRealised Treatment Scanning TRealised Treatment Phases TRealised Treatment Fractions TRealised Treatment Time TRealised Impact of Complexity Complexity Adopted Work Hours Available Work Hours Utilised Patients To Treat Work Hours Increase Work Hours Decrease Complexity Adopt Change New Tech Decrease Impact of
Complexity
Phases of Roll Out Technology Step Freq Trigger Halt Adoption Wait Index Threshold + + -+ + Work Hours Max Wait Time Gov
Target
Wait Time Index Delayed Reaction
to Wait Time
+ + -+ + + Treatment Planning Realised Increase Treatment Planning Realised Decrease Treatment Scanning Realised Increase Treatment Scanning Realised Decrease Treatment Phases Realised Increase Treatment Phases Realised Decrease Treatment Fractions Realised Increase Treatment Fractions Realised Decrease Treatment Time Realised Increase Treatment Time Realised Decrease + + -+ + Plan Rate Time For Planning
DELAYED Time For Planning
DELAYED Time For Scanning
DELAYED Time For Treatment
[image:6.595.52.542.81.300.2]Days to Reach Treatment Wait For Treatment Wait Time Average Arrivals Treatment + -+ + -Image Rate Treatment Rate Time For Scanning Time For Treatment + + -+ + +
Figure 2 Overview of the SD model of the centre–Treatment complexity impacting referral to first treatment times, which influences work hours and complex treatment adoption. Note that each stock of timerealised(shown) has an equivalent timeexpected (not shown) that are used to illustrate the challenges of implementing a new treatment regime.
Treat Q Q’s Plan Arrive Scan Q’s Book Q
Q - in
treat Next Fraction Re-Scan Re-Book Re-Plan Exit PreT (Require Consultant) Q
Next Course of Treatment
[image:6.595.58.538.368.503.2]first treatment times experienced and the resulting varia-tion across patients. This enabled the centre to carefully consider the adoption and implementation of such changes in regime, maintaining the throughput of the system and minimising the variation of referral to first treatment times experienced by patients, which reflects access to appropriate and timely treatment.
The DES model may be summarised by the following six stages and characteristics:
Arrivals and booking:The arrival of new patients into the Beatson is split according to 20 ICD10 cancer codes. Demand is static (to represent the current situation) with inter-arrival times exponentially distributed.
Imaging:Time spent on scanning machines depends on the type of cancer, the type of scan carried out and whether radical or palliative care is being provided. All treatment fractions per course are planned before first treatment.
Treatment Planning: Planning is undertaken by skilled radiotherapy physicists with the time taken dependent on the complexity of the treatment regime. Times were estimated by a senior radiotherapy physicist. The require-ment for consultants during the planning process depends on the treatment regime.
Treatment: The centre has 11 treatment machines. Patients attend treatment for a number of fractions with each fraction being equal to one visit. The duration of a treatment fraction depends on the individual characteris-tics of the patient being treated.
Resources: Staff resources work according to shift pat-terns that do not change throughout the year of the baseline model (recruitment or commissioning of machines evaluated in scenarios). Activity (such as ima-ging, planning or treatment) in the model cannot commence until the required resources are available. Re-booked, re-scanned or re-treated patients are mod-elled to highlight the delays caused by unutilised slots and rework.
Model Parameters and Queuing convention:The model runs for 1 year with a 4-week warm-up. All patients are attended to on afirst comefirst serve basis at each server. Priority is given to patients returning to the planning stage over new arrivals to ensure timely arrival at treat-ment. There is no maximum time a patient will spend in the system before they leave voluntarily: all patients wait until they are able to be seen.
Key Metrics: In 2010 over 6,400 new referrals were
received; 8,000 scans/images were taken; and over
100,000 treatment fractions delivered. On average, one referral requires one treatment course consisting of 1.4 phases, with 17 fractions per phase (increases to 24 fractions per phase for radical treatment patients). The centre is operational 13 hours a day, working to a 31-day target for referral tofirst treatment fraction. Initial analysis in the simulation found the average expected time would be 28.5 days. All treatments are manually booked at the same time ahead of the first visit. The number and fre-quency of appointments (time required between fractions)
is determined by the radiotherapy physicist as part of the treatment plan, with most scheduled a day apart.
Mixed methods design
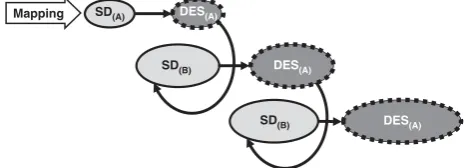
The design of this study was initiallySequential, using SD to explore the problem within the wider context of the system and develop initial understanding of the concepts involved, followed by DES to consider how to implement changes at ground level. Deeper, more technically inter-acting mixed method designs were kept in mind at all stages of model development as possible directions for the project. The modeller identified overlaps and points of exchange between the methods during the project.
In actuality, the models were developed iteratively with each model stage informing the developments made in the next (illustrated in Figure 4). The focus of the SD model was on the wider system behaviour and the DES intended to explore the physical processes within the centre. The differing model boundaries suited to each method made a comparison between the methods illogical/unsuitable. Development of the DES required significant insight into the system that it was possible to develop while construct-ing the SD model. The complementary use of DES allowed examination of the variation in the impact felt by increas-ing treatment times or changincreas-ing the treatment mix. This developed understanding of the knock-on impact can then be used to inform the SD model and the relationship between treatment time and the resulting time a patient takes to progress through treatment (the wait). By examin-ing the problem through a mixed methods lens allows the system to be analysed at several levels of detail and enables the wider policy issues to be explored.
In the past, the key contact for the project within the cancer centre had been drawn to data-intensive detailed analysis of the system that is not always practical because of data limitations. The current approach has enabled wider issues to be examined and the general impact of policies on the overall functionality of the system to be assessed before examining the impact at a patient level. It enabled new questions to be posed and reflections to be made on how the centre functions. In addition, the approach has highlighted what measures might be used to assess performance through discussion around the use of throughputvsreferral tofirst treatment timesvs treat-ment outcomes. The iterative model developtreat-ment also
Mapping SD(A) DES(A)
SD(B) DES(A)
[image:7.595.307.543.605.689.2]SD(B) DES(A)
resulted in emergent learning from the models, with stakeholders developing their understanding of the system and the challenges faced alongside the modeller.
Modelling results and insights
This section describes the insights obtained from the models throughout the modelling process. Baseline mod-els were agreed with the stakeholders and numerous scenarios were explored. Details of model runs are not included because of space limitations, but the impact of the model experimentation is discussed.
SD modelling
The SD model enabled the client to observe the impact of decisions stemming from the feedback structure of the system. Strategies to respond to an increasing amount of time required to prepare and deliver plans were explored to avoid an overall increase in the time at treatment machines. The impact of changing treatment regimes on staff working practices, such as the expected time needed to produce plans, the need for overall increase in the knowledge based of staff and increased frequency of train-ing, were observed in the model.
A progressive implementation strategy was required to cope with the learning process involved with changing treatment regimes, whereby the times required for activ-ities peak then return to an expected level (the target level for that regime). New regimes increase the time required to plan: as treatment regimes become more complex, more complex plans are required. Although the number of plans may decrease as the number of treatment courses per patient falls, the total time a planner spends per treatment plan will increase as complex treatments become common place. Reducing the number of treatment fractions can mean that higher doses are delivered per fraction and so more complex plans are required per treatment phase. This means more time is required to plan ahead of the first phase making government targets for timely access to this stage more challenging to meet.
The net effect of new regimes is to reduce staff and resource workload. Planning is the only part of the plan-ning and treatment process that experiences an increase in workload. All other parts of the system will eventually experience a fall in demand per patient (although the number of patients will continue to increase). New regimes offer the opportunity for a progressive decrease in the number of treatment phases required per patient, a pro-gressive increase in time required on treatment machine per session per patient but a decrease in the overall contact time on an expensive resource – treatment machines. Fewer phases implies fewer visits to hospital for the patient and overall shorter treatments.
DES modelling
The base scenario highlighted the sensitivity of the system because of how close to capacity it is functioning. Any peaks in demand can cause the system to tip queue
growth out of control. Experimentation revealed that increasing the flexibility of consultant work patterns (to be available at different areas throughout a week) generates a greater improvement in time to reach treatment than sharing patients between consultant groups.
Increasing patient access to more complex treatment regimes requires investment in staff and treatment delivery machines. The system is able to cope with thefirst marginal increase in access, but all other scenarios require adjust-ments to be made to the system. The model highlighted that additional machines are needed in order to maintain waiting targets if more than 25% of radical patients receive complex treatment regimes. Providing access forallradical patients to the more complex treatment regimes requires the time taken in treatment planning to reduce signifi -cantly (through investment in training) or more staff.
Changing capacity marginally was found to have a significant impact on the ability of the system to cope with demand, and reduce patient referral tofirst treatment times. The system copes on paper, but when the variation in arrivals of patients is taken into account there is a high chance of the system becoming unable to cope and failing to meet targets. In reality all staff will strive to ensure treatment is received in a timely fashion and the best possible care is provided. Work is already undertaken outside of calculated work hours in order to meet patient needs and unless this is accounted for proposals such as extending working days may have a greater impact on staff workload than predicted. The scenarios modelled in this project were a subset of possible future setups of the system that gave stakeholders the opportunity to confirm or challenge beliefs about the system.
Insights from iterative modelling
The iterative mixed method design benefited the project by enabling insights from one method model to inform the development of the other method model. Maintaining two models encouraged the modeller to limit the complex-ity of each by carefully considering what detail and boundary to capture within each model. This meant that thefirst iteration of the SD model captured a strategic view and highlighted that more (operational) detail was needed into the stages of the treatment process. Then, by model-ling the treatment process (in DES) and exploring the required parameters, resources and constraints, the model highlighted important concepts to include in the SD model. That is, that the DES model provided feedback to the strategic level of the original questions posed, enabling the questions to be formulated more precisely and the SD model to be adjusted.
Lessons from practice
During the model development process the modeller kept detailed notes and (where possible) recordings of key meet-ings with the client. As part of the action research metho-dology, three reflective cycles were undertaken to generate
paragraphs discuss the insights obtained, grouped accord-ing to: the modellers reflections on the project exploration methodology, the value of the models generated as observed from the modellers perspective and researcher perspective reflections on the value of the models and the process.
The use of causal mapping as a problem structuring tool provided the modeller with a method open to capturing a broad range of issues, without being specifically DES or SD focused. On reflection, the use of the problem structuring process enabled the modeller to engage with the indivi-dual views and the two simulation methods enabled representation of the system at two levels of focus.
Both SD and DES had explicit roles to play. In relation to the questions posed around changing treatment regimes, the two models agree on the direction of the impact on the system, with SD able to illustrate the range and scale of the impact of some changes, and the DES illustrating the ability of the system to cope on a day to day basis. The use of SD modelling enabled exploration of the value of changing to more complex treatment regimes. DES model-ling aided identification of process restrictions and limita-tions. Both models were usedto develop understanding of the system while building a case for/against policy changes. They present two complementary views of the system, with each adding value to the other through the under-standing developed during the modelling process. Both methods revealed different perspectives on the system, with insight from the use of one method informing the development of the other model as well as its own.
Positive feedback on the project was received from all stakeholders, but with eachfinding value in the process at different points (from the initial mapping to the final communication of model results). By the end of the project stakeholders appeared to have accepted the roles of the models, and that the SD model represented some important relationships that impacted upon the DES and so the DES should not be taken in isolation. The two models highlighted that stakeholders with only opera-tional questions and issues need to appreciate the wider system for relationships they may fail to consider. This is not only an outcome of the model but also may be a generalisation for a nested system view.
Discussion
OR methods are mixed in practice to: deal with problems in complex systems, support stages of a project, obtain specific benefits from specific methods and overcome shortfalls of methods (Howick & Ackermann, 2011). The rationale for mixed DES and SD projects are similar: the most suitable (or only) way to answer the questions raised, the client requested specific method(s), the system is unique and complex, the desire to do something different, the need to obtain comparative insights, the apparent stages of insight required. These can broadly be split into two groups: personal preferences of the modeller and/or the client and the specifics of the problem and system.
The key difference between the two methods, and benefit to the project, observed by the researcher during the modelling intervention was the different world views of the problem and system a modeller is able to adopt with each method. Although each method may be adapted to create a model similar to the other, the overall philosophies of each method encourage the modeller to think of the system in terms of two different perspectives. These are often referred to as the operational and the strategic per-spectives. These two terms are often pigeonholed to imply that DES and SD areonlyapplicable to systems that conform to these respective perspectives. However, it should be noted that these terms do not represent two different types of system but rather two views the modeller might take of a system: the operational perspective is one that considers how the system can be made to function (such as what shift pattern needs to be applied), and the strategic perspective is one that considers what makes the system function (such as what is the maximum hours staff should be working).
Considering the realised benefits of mixing methods, from the client’s perspective, their beliefs about behaviour of the system were challenged. The use of both DES and SD enabled stakeholders to view the radiotherapy treatment process both as an operational system that needed to minimise the time patients wait for treatment, but also as a larger interacting system. This led to a change in under-standing by stakeholders; an appreciation of the need to explore how strategic decisions influence day-to-day activ-ity and can present unforeseen challenges (SD informing DES) and the long-term knock-on impact of operational decisions (DES informing SD). From the modeller’s per-spective, personal perceptions of the system were also challenged. Cycling between methods encouraged explicit consideration of what is really needed in the models, leading to a fresh perspective of the system.
Could the same insights have been achieved without mixing? In this project, it may have been possible techni-cally to represent both models within a single software package. However, that is not to say that it would have only been a single method that the modeller was adopting. Embarking on the project with only the view to use one of the methods may not have led to the same outputs. It comes down to modeller choice and modeller insight. It is up to the modeller (along with the client) to decide on the detail and boundary of the project, which in turn informs the method(s) used. Exhaustive scenario testing may have led to the conclusion about the dynamics of new treatment regimes. But, talking through the adoption of new treat-ment regimes with the stakeholders and representing the process as a SD model enabled their suspicions to be made clear without the need for extensive scenario analysis. Healthcare models need to be able to represent the different levels at which different individuals view the system.
both are needed to obtain an insightful view on the system. Considering only how to allocate the resources (utilising only DES) may have led to poorly informed conclusions. Similarly, using only SD within the project would have required the method to be stretched to include stochastic events, individual entities and detail complexity. Therefore, in this project, trying to apply SD in isolation may have resulted in utilising an enriched mixed method design.
This modelling project utilised SDfirst, followed by DES as it was intended that the SD model would capture a larger system view. Equally a modeller may choose to use DESfirst in the same situation to obtain a detailed insight into a smaller part of the system before modelling the wider system. The order in which methods are used reflects a modeller’s preference, the information available to a modeller at the time and what the project required.
Healthcare systems are complex, with a history as a setting for simulation, and so offer rich settings for research into modelling processes. Although the modeller was required to develop an understanding of this complex system in order to build the models, this was not the largest hurdle of the project. The main challenge was how to conceptualise a mixed method model. This was achieved by iteratively developing the models that in turn
highlighted points of commonality and complementarity, revealing points of interaction between the models. Just like using any method (such as SD or DES) it may be deduced that it takes practice and guidance to mix meth-ods. Simple example models illustrate the functionality of mixing methods, but may oversimplify the development process by failing to demonstrate the struggle to decide how the model will work. A review of mixed OR method projects highlighted how‘many people do not consciously reflect on or articulate their methodological decisions’ (Howick & Ackermann, 2011). There exists a need for OR modellers to connect the rationale for mixing (the expected benefits) with the actual benefits and outputs of the project. This paper has sought to provide an example of a mixed SD and DES modelling project where the modeller consciously reflects on the process throughout.
Acknowledgements
Thanks are due to the Beatson for their involvement and support throughout this project; to the EPSRC, Simul8 and the Beatson Fund for sponsorships; and to the U.K. OR Society for support to attend the EURO Summer Institute which provided valuable feedback.
References
ACKERMANN F and EDEN C (2005) Using causal mapping with group support systems to elicit an understanding of failure in complex projects: some implications for organisational research.Group Decision and Negotiation14(5),355–376.
AN L and JENGJ-J (2005) On developing system dynamics model for business process simulation. In Proceedings of the Winter Simulation Conference(KUHLME, STEIGERNM, ARMSTRONGFB and JOINESJA, Eds), pp 2187–2195, INFORMS Simulation Society, Florida.
BORSHCHEVA and FILIPPOVA (2004) From system dynamics and discrete event to practical agent based modeling: reasons, techniques, tools. InProceedings 22nd International Conference System Dynamics Society. (Kennedy M, Winch GW, Langer RS, Rowe JI and Yanni JM, Eds), Oxford, UK.
BRAILSFORD SC and HILTON NA (2001) A comparison of discrete event simulation and system dynamics for modelling healthcare systems. InPlanning for the Future: Health Service Quality and Emergency Accessi-bility. (RILEY, J Ed), pp 18–39, Operational Research Applied to Health Services (ORAHS), Glasgow Caledonian University.
BRAILSFORDSC, CHURILOVL and DANGERFIELDB (2014)Discrete-Event Simula-tion and System Dynamics for Management Decision Making. Wiley, Chichester, UK.
BRAILSFORD SC, DESAI SM and VIANA J (2010) Towards the holy grail: combining system dynamics and discrete event simulation in health-care. InProceedings of the Winter Simulation Conference(JOHANSSONB, JAINS, MONTOYA-TORRESJ, HUGANJ andŸUCESANE, Eds), pp 2293–2303,
INFORMS Simulation Society, Baltimore.
CEGLOWSKIR, CHURILOVL and WASSERTHIELJ (2007) Combining data mining and discrete event simulation for a value-added view of a hospital emergency department. Journal of the Operational Research Society. 58(2),246–254.
CHAHAL K and ELDABI T (2008) Which is more appropriate: a multi-perspective comparison between system dynamics and discrete event simulation. InProceedings European and Mediterranean Conference on Information Systems, (Irani Z, Sahraoui S, Ghoneim A, Sharp J, Ozkan S, Ali M and Alshawi S, Eds), Dubai.
CHICK SE (2006) Six ways to improve a simulation analysis.Journal of Simulation1(1),21–28.
COOPER K, BRAILSFORD SC and DAVIES R (2007) Choice of modelling technique for evaluating healthcare interventions.Journal of the Opera-tional Research Society58(2),168–176.
COYLERG (1977)Management System Dynamics. John Wiley and Sons, London.
DJANATLIEVA, BAZANP and GERMANR (2014) Partial paradigm hiding and reusability in hybrid simulation modeling using the frameworks Health-DS and i7-AnyEnergy. InProceedings 46th Winter Simulation Conference: Exploring Big Data through Simulation(TOLKA, DIALLO SY, RYZHOVIO, YILMAZ L, BUCKLEY S & MILLER JA, Eds), pp 1723–1734, INFORMS
Simulation Society, Savannah.
DOEBELIN EO (1998) System Dynamics: Modeling, Analysis, Simulation, Design. Marcel Dekker, New York.
FORRESTER JW (1958) Industrial dynamics: a major breakthrough for decision makers.Harvard Business Review36(4),37–66.
HOWICKS and ACKERMANNF (2011) Mixing OR methods in practice: past, present and future directions.European Journal of Operational Research 215(3),503–605.
JACKSONMC (1999) Towards coherent pluralism in management science.
Journal of the Operational Research Society50(1),12–22.
KOELLINGP and SCHWANDTMJ (2005) Health systems: a dynamic system– benefits from system dynamics. InProceedings 37th Winter Simulation Conference(KUHLME, STEIGERNM, ARMSTRONGFB and JOINESJA, Eds), pp 1321–1327, INFORMS Simulation Society, Florida.
KOTIADISK and MINGERSJ (2006) Combining PSMs with hard OR methods: the philosophical and practical challenges.Journal of the Operational Research Society57(7),856–867.
KULJIS J, PAUL RJ and STERGIOULAS LK (2007) Can health care benefit from modelling and simulation methods in the same way as business and manufacturing. InProceedings 39th Winter Simulation Conference: 40 Years! The best is Yet to Come(HENDERSONSG, BILLERB, HSIEHM-H, SHORTLEJ, TEWJD and BARTONRR, Eds), pp 1449–1453, INFORMS
Simulation Society, Washington DC.
LANEDC (2000) You just don’t understand me: modes of failure and
success in the discourse between system dynamics and discrete event simulation. LSE OR Working Paper 00.34, London School of Economics, http://eprints.lse.ac.uk/22816/.
LANEDC, MONEFELDTC and ROSENHEADJV (2000) Looking in the wrong place for healthcare improvements: a system dynamics study of an accident and emergency department. Journal of the Operational Research Society51(5),518–531.
dynamics, agent-based modeling and discrete-event-simulation. In Proceed-ings 24th International Conference System Dynamics Society, (Grobler A, Rouwette EAJA, Langer RS, Rowe JI and Yanni JM, Eds), Wiley, Boston, MA. MCNIFFJ and WHITEHEAD J (2006) All you Need to Know About Action
Research. Sage Publications, London.
MEADOWSDH (1980) The unavoidable a priori. InElements of the System Dynamics Method(RANDERSJ, Ed.), Pegasus Communications, Waltham, MA. MINGERSJ and BROCKLESBYJ (1997) Multimethodology: towards a
frame-work for mixing methodologies.Omega25(5),489–509.
MINGERSJ, GILLA, ACKERMANNF and BENNETTPet al(1997) Multimethodol-ogy: The Theory and Practice of Combining Management Science Meth-odologies. John Wiley and Sons, Chichester.
MORECROFTJDW and ROBINSONS (2006) Comparing discrete-event simu-lation and system dynamics: modelling a fishery. InProceedings of the 2006 OR Society Simulation Workshop(ROBINSONS, TAYLORS, BRAILSFORD
S and GARNETTJ, Eds), Ashorne Hill Conference Centre, England. MORGANJS (2013) Exploring frameworks for mixing discrete event
simula-tion and system dynamics methods in theory and in practice. PhD Thesis, Department of Management Science, University of Strathclyde, Glasgow. Thesis Number: T13553.
ONGGOBS (2014) Elements of a hybrid simulation model: a case study of the book supply chain in low- and middle-income countries. In Proceed-ings 46th Winter Simulation Conference: Exploring Big Data through Simulation (TOLK A, DIALLO SY, RYZHOV IO, YILMAZ L, BUCKLEY S & MILLERJA, Eds), pp 1597–1607, INFORMS Simulation Society. OWENC, ALBORESP, GREASLEYA and LOVED (2010) Simulation in the supply
chain context: Matching the simulation tool to the problem. In
Proceedings of the 2010 Operational Research Society simulation Workshop (SW10)(Gunal M, Ed), 23–24 March 2010, Worcestershire, England. Operational Research Society, pp. 229–242, 5th Operational Research Society Simulation Workshop, SW 2010, Worcestershire, United King-dom, 23–24 March.
PIDDM (2003)Tools for Thinking: Modelling in Management Science. John Wiley and Sons, Chichester.
PIDDM (2004)Computer Simulation in Management Science. John Wiley and Sons, Chichester.
PIDDM (2012) Mixing other methods with simulation is no big deal. InProceedings 44th Winter Simulation Conference(LAROQUEC, H IMMEL-SPACHJ, PASUPATHY R, ROSEO and UHRMACHERAM Eds), pp 751–757
INFORMS Simulation Society, Berlin, Germany.
RANDERS J (1980) Elements of the System Dynamics Method. Pegasus Communications, Waltham, MA.
RENSHAW E (1991) Modelling Biological Populations in Space and Time. Cambridge University Press, Cambridge.
ROBERTS, EB, Ed (1978) Managerial Applications of System Dynamics. Productivity Press, Cambridge, MA.
ROBINSONS (2003)Simulation–The Practice of Model Development and Use. John Wiley & Sons, Chichester.
STRINGER ET and GENAT W (2004) Action Research in Health. Pearson Education, Upper Saddle River, New Jersey.
SWEETSERA (1999) A comparison of system dynamics and discrete event simulation. InProceedings 17th International Conference of the System Dynamics Society and 5th Australian & New Zealand Systems Conference: System Dynamics Society (Cavana RY, Vennix JAM, Rouwette EAJA, Stevenson-Wright M and Candlish J, Eds), Wellington, NZ.
TAKOAA and ROBINSONS (2009) Comparing discrete-event simulation and system dynamics: users’perceptions.Journal of the Operational Research Society60(3),296–312.
TAKOAA and ROBINSONS (2010) Model development in discrete-event simulation and system dynamics: an empirical study of expert mod-ellers.European Journal of Operational Research207(2),784–794.
TAYLOR K and DANGERFIELDB (2005) Modelling the feedback effects of reconfiguring health services.Journal of the Operational Research Society 56(6),659–675.
TAYLOR K and LANE DC (1998) Simulation applied to health services: opportunities for applying the system dynamics approach.Journal of Health Services Research and Policy3(4),226–232.
The Beatson West of Scotland Cancer Centre. [WWW document] www .beatson.scot.nhs.uk/ (accessed 7 July 2014).
VIANAJ (2014) Reflections on two approaches to hybrid simulation in healthcare. InProceedings 46th Winter Simulation Conference: Exploring Big Data through Simulation(TOLKA, DIALLOSY, RYZHOVIO, YILMAZL, BUCKLEY S & MILLER JA, Eds), pp 1585–1596, INFORMS Simulation Society, Savannah.
VIANAJ, BRAILSFORD SC, HARINDRA V and HARPER PR (2014) Combining discrete-event simulation and system dynamics in a healthcare setting: a composite model for Chlamydia infection.European Journal of Opera-tional Research237(1),196–206.
ZHUJ and MOSTAFAVIA (2014) Integrated simulation approach for assess-ment of performance in construction projects: a system-of-systems framework. InProceedings 46th Winter Simulation Conference: Exploring Big Data through Simulation(TOLKA, DIALLOSY, RYZHOVIO, YILMAZL, BUCKLEY S & MILLER JA, Eds), pp 3284–3295, INFORMS Simulation
Appendix A
Figure A1
Appendix B
This work is licensed under a Creative Com-mons Attribution 3.0 Unported License. The images or other third party material in this article are included in the article’s Creative Commons license, unless indicated otherwise in the credit line; if the material is not
included under the Creative Commons license, users will need to obtain permission from the license holder to reproduce the material. To view a copy of this license, visit http://creativecommons.org/licenses/by/3.0/
Treat
Q
PreT (Require Consultant)
Q
Acuity (Require Consultant)
Q’s
Q’s
Import (Require Planner)
Volume
(Require Consultant)
Plan (Require Planner)
Check (Require Checker)
Review
(Require Consultant)
ADW (Require Consultant)
Plan
-Simple (Require Planner)
Exit
Arrive Scan
Q’s
Book
Q
Not through planning
Re-Plan
QA for IMRT Next
Phase
Next Phase
Next Course of Treatment
Q - in
treat Next
Fraction Re-Scan
Re-Book
[image:12.595.54.542.437.633.2]Figure A1 Detailed conceptual model of the operational processes at the centre.