Transmitted HIV Variants using Longitudinal Clonal HIV Sequence
Data
Rosemary M. McCloskey,a,bRichard H. Liang,aP. Richard Harrigan,a,cZabrina L. Brumme,a,bArt F. Y. Poona,b,c BC Centre for Excellence in HIV/AIDS, Vancouver, British Columbia, Canadaa
; Faculty of Health Sciences, Simon Fraser University, Burnaby, British Columbia, Canadab ; Department of Medicine, University of British Columbia, Vancouver, British Columbia, Canadac
ABSTRACT
A population of human immunodeficiency virus (HIV) within a host often descends from a single transmitted/founder virus. The high mutation rate of HIV, coupled with long delays between infection and diagnosis, make isolating and characterizing this strain a challenge. In theory, ancestral reconstruction could be used to recover this strain from sequences sampled in chronic infection; however, the accuracy of phylogenetic techniques in this context is unknown. To evaluate the accuracy of these meth-ods, we applied ancestral reconstruction to a large panel of published longitudinal clonal and/or single-genome-amplification HIV sequence data sets with at least one intrapatient sequence set sampled within 6 months of infection or seroconversion (nⴝ
19,486 sequences, median [interquartile range]ⴝ49 [20 to 86] sequences/set). The consensus of the earliest sequences was used as the best possible estimate of the transmitted/founder. These sequences were compared to ancestral reconstructions from se-quences sampled at later time points using both phylogenetic and phylogeny-naive methods. Overall, phylogenetic methods con-ferred a 16% improvement in reproducing the consensus of early sequences, compared to phylogeny-naive methods. This rela-tive advantage increased with intrapatient sequence diversity (P<10ⴚ5) and the time elapsed between the earliest and
subsequent samples (P<10ⴚ5). However, neither approach performed well for reconstructing ancestral indel variation,
espe-cially within indel-rich regions of the HIV genome. Although further improvements are needed, our results indicate that phylo-genetic methods for ancestral reconstruction significantly outperform phylogeny-naive alternatives, and we identify experimen-tal conditions and study designs that can enhance accuracy of transmitted/founder virus reconstruction.
IMPORTANCE
When HIV is transmitted into a new host, most of the viruses fail to infect host cells. Consequently, an HIV infection tends to be descended from a single “founder” virus. A priority target for the vaccine research, these transmitted/founder viruses are diffi-cult to isolate since newly infected individuals are often unaware of their status for months or years, by which time the virus pop-ulation has evolved substantially. Here, we report on the potential use of evolutionary methods to reconstruct the genetic se-quence of the transmitted/founder virus from its descendants at later stages of an infection. These methods can recover this ancestral sequence with an overall error rate of about 2.3%—about 15% more information than if we had ignored the evolution-ary relationships among viruses. Although there is no substitute for sampling infections at earlier points in time, these methods can provide useful information about the genetic makeup of transmitted/founder HIV.
H
uman immunodeficiency virus type 1 (HIV-1) is among the most genetically variable human pathogens. HIV-1 envelope diversity within a single host during chronic infection can exceed the global diversity of influenza during a given flu season (1); HIV’s global diversity is more than an order of magnitude greater. This diversity, driven by HIV’s rapid rate of evolution and fre-quent recombination (2), represents a major challenge to vaccine design. For example, vaccine-induced protection against one strain may not protect against another (3). Recently, however, there is growing evidence that transmitted/founder viruses— strain(s) that successfully establish a productive infection follow-ing the transmission bottleneck (4,5)—may be substantially less diverse than the global viral population. Moreover, transmitted/ founder viruses may possess certain genotypic or phenotypic characteristics (6–10), such as envelope sequences that display the CCR5 coreceptor usage phenotype (11), and enhanced sensitivity to antibody-meditated neutralization (12). If infecting strains in-deed represent a particular subset of all circulating viruses, and if immunogens could be designed to specifically stimulateprotec-tive host responses against them, the prospect of a protecprotec-tive vac-cine may be more hopeful. Characterizing transmitted/founder strains is therefore critically important, since this provides a more specific target for vaccine design.
The identification of transmitted/founder strains, however, re-mains challenging. Often, HIV is not diagnosed until the chronic phase of infection, at which point substantial intrahost evolution has already occurred. To date, identification of transmitted/
Received19 February 2014 Accepted11 March 2014
Published ahead of print19 March 2014
Editor:G. Silvestri
Address correspondence to Art F. Y. Poon, [email protected].
Supplemental material for this article may be found athttp://dx.doi.org/10.1128 /JVI.00483-14.
Copyright © 2014, American Society for Microbiology. All Rights Reserved.
doi:10.1128/JVI.00483-14
on November 7, 2019 by guest
http://jvi.asm.org/
founder strains has been accomplished through intensive moni-toring of large prospective HIV cohorts of high-risk individuals, wherein new infections can be identified within days or weeks of exposure (see, for example, references11,13, and14). Although highly valuable, such programs are resource intensive and require follow-up of a great number of individuals to capture a compar-atively small number of founder viruses. In contrast, it is substan-tially less onerous to identify new HIV infections on a time scale of months or years; indeed, an abundance of published HIV se-quence data is available from patients diagnosed after the acute stage. Whereas the sequence of a transmitted/founder strain can be inferred from the genotypes of its immediate descendants when these are captured in acute/early infection (11), the accuracy of reconstructing transmitted/founder strains from more distant de-scendants remains unknown. If it were possible to accurately re-construct transmitted viral strains using later (or even chronic) intrapatient sequences, the wealth of existing sequence data would yield a much larger repository of transmitted/founder virus geno-types for study.
Recovering ancestral sequences from present-day descendants has been of interest to biologists since the middle of the 20th century (15). Extensive statistical and computational methods for ancestral sequence reconstruction, which rely on inferring the phylogeny that models patterns of common ancestry among the observed genetic sequences, have been developed and continue to be improved. Often, these techniques have been used by research-ers interested in evolution on a macro scale (16). In these cases, the algorithms are untestable, since the ancestors in question are long extinct. In contrast, longitudinal intrapatient HIV sequence data provide a unique opportunity to apply these algorithms in a real-world setting and on a more immediate time scale. In an individ-ual with untreated HIV infection, the equivalent of a million years of macroorganism evolution can be observed in a single year (17). Substantial published longitudinal intrapatient data exist on which to validate these algorithms. The best estimate of the trans-mitted/founder strain can be obtained by computing a consensus from intrapatient sequences sampled during acute infection, if these early samples are available. In other words, the consensus of the earliest sequences in a longitudinal data set are a “gold stan-dard” estimate of the true transmitted/founder strain, which we can attempt to recover by performing ancestral reconstruction on the remainder of the data set. Although the output of an ancestral reconstruction procedure is the most recent common ancestor (MRCA) of the input sequences, HIV’s documented transmission bottleneck (4,5) makes the MRCA very likely to be identical to the transmitted/founder virus (with the notable exception of very early selection and rapid fixation of an immune escape mutation; see Discussion). If these techniques can be applied to accurately reconstruct transmitted/founder virus sequences using only lon-gitudinal HIV sequences sampled after acute infection, we will have a more rapid and cost-effective method to examine and char-acterize many more infecting strains in the absence of early sam-ples.
MATERIALS AND METHODS
Data collection.We used the Los Alamos Intra-Patient search interface (www.hiv.lanl.gov/components/sequence/HIV/ipsearch/IPsearch .html) to identify longitudinal studies with two or more clonal or single-genome (SGS) sequences available at each time point, with a known time-line relative to one of several reference points: HIV infection,
sero-conversion, presentation of symptomatic seroconversion illness, or birth. Studies were selected where the earliest (“baseline”) sample was collected within 6 months (186 days) of this reference point, and where at least one of the subsequent (“follow-up”) time points occurred a minimum of 6 months after baseline. Any available follow-up time points less than 6 months after baseline were included in the analysis, as long as the total study duration (baseline to last follow-up) exceeded 6 months. As a crit-ical step of ancestral sequence reconstruction is inferring the evolutionary relationships between sequences from different viruses in a within-host population, sequences derived from direct (“bulk”) sequencing of PCR products, and data sets with only one sequence per time point, were ex-cluded. Known cases of superinfection (n⫽19 patients) were also ex-cluded. References for all published data sources are listed in the supple-mental material.
We organized the data sets from these studies in a purpose-built SQLite database. When patients from two different studies shared one or more sequences (by GenBank accession number), they were treated as one individual with a single ID. The data were grouped by patient and by gene into data sets, defined as a collection of sequences from a single patient and a single HIV gene. HIVenvandgaggenes comprised the majority of data sets (77%,Table 1), butpol,nef,rev,tat,vif,vpr, andvpuwere also represented. A patient may have been associated to more than one data set if more than one gene of that patient’s viral population (for example, both envandgag) was sequenced. We assembled 335 unique data sets from 232 unique patients (Table 1), comprising a total of 19,486 sequences (if a sequence was used for two data sets because it contained two different genes, it was counted twice).
Alignment.Sequences were annotated in FASTA format using Biopy-thon’s SeqIO module (18) and aligned with Seaview (19), using a combi-nation of the built-in MUSCLE interface (20) and manual adjustment. Alignments were trimmed to the interval where a minimum of 50% of sequences within the data set had sequence coverage over each codon. This interval tended to span the entire gene length for relatively short genes such asvifornef(median alignment lengths 558 and 615 bp, respec-tively) or targeted specific regions such as the region encoding HIV pro-tease and reverse transcriptase inpol(median length, 1,261 bp). Because codon models generally have no representation for stop codons (see be-low), columns containing any stop codons were removed. Terminal gaps due to incomplete sequences, which comprised 1.08% of sites across all sequences, were replaced with missing data characters (“?”). Finally, the alignments were split into two FASTA files: one containing the sequences from the baseline time point and the other containing all of the follow-up sequences on which ancestral reconstruction was to be performed.
Consensus sequences.Ancestral reconstruction via consensus is ap-propriate when all taxa directly descend from a single common ancestor (a scenario represented by a “star” phylogeny) because the sequences repre-sent independent outcomes. As has been shown previously (8,11,21,22), a within-host population tends to briefly exhibit a star-like phylogeny in acute infection, so a consensus would be appropriate at this stage. How-ever, as infection progresses, certain lineages in the phylogeny begin to proliferate over others as the host’s immune system exerts selection pres-sure. Thus, we would expect to see the consensus diverge from the ances-tor over time. Consensus sequences were therefore generated from the baseline sample, to be used as the best possible estimate of the “true” ancestor. We refer to these as “baseline consensus” sequences. The con-sensus nucleotide for each column of an alignment was taken as the most frequent non-missing nucleotide, whether or not it was present in more than 50% of the sequences (i.e., plurality rule consensus). A tie between two nucleotide frequencies resulted in an ambiguous DNA character in the consensus sequence; ties between a nucleotide and a gap were resolved to missing data (“?”). Consensus sequences were also generated in the same manner from the follow-up samples, to be used as a phylogeny-naive reconstruction of the ancestor, for comparison against the ancestral re-construction approach. We refer to these as the “follow-up consensus” sequences.
on November 7, 2019 by guest
http://jvi.asm.org/
Phylogenetic tree inference.The software program Bayesian Evolu-tionary Analysis by Sampling Trees (BEAST) (23) was used to generate a random sample of rooted phylogenetic trees from the posterior distribu-tion given each data set, under a molecular clock model of evoludistribu-tion. We specified a log-normal prior for the clock rate; this prior distribution has the mean and standard deviation as hyperparameters. The prior mean was computed as follows. Mansky and Temin (24) estimated an HIV mutation rate of 3.4⫻10⫺5bp per replication cycle, and Perelson et al. (25) esti-mated the mean generation time of HIV to be⬃2.6 days. Thus, an esti-mate of the prior mean clock rate is calculated as follows: [(3.4⫻10⫺5 bp)/generation]⫻(1 generation/2.6 days)⫽(1.3⫻10⫺5bp)/day.
We specified a prior standard deviation of 1 such that the prior distri-bution had a 95% confidence interval of 1.5⫻10⫺6to 4.1⫻10⫺5. All other prior distributions were left at their default settings. We used an HKY85 model of nucleotide substitution rates (26), with stationary nu-cleotide frequencies estimated as model parameters, no variation in sub-stitution rates across sites, and no partitioning of rate parameters by codon position. A prior distribution over trees was specified by a constant effective population size coalescent model with a random starting tree. These settings were applied across all 335 sequence alignments.
For each data set, we evaluated both strict and relaxed uncorrelated lognormal clock models. Two replicate 108-step MCMC chains were run for each clock model for a total of four chain samples, and trees were recorded to a log file every 10,000 steps. Convergence of the chains was assessed using the R package coda’s implementation of the Gelman-Rubin diagnostic, which compares the variance within chains to the variance among chains. We took a Gelman-Rubin diagnostic value ofⱕ1.1 for the posterior traces as a criterion of convergence. If the replicate chains for a
given clock model did not satisfy this criterion, we repeated the analysis with longer chain samples up to 109steps until the criterion was passed. The criterion was not satisfied after 109steps for 0 and 25 data sets for strict and relaxed molecular clock models, respectively. For these, the remaining clock model (which did pass the criterion) was carried forward. Otherwise, using the implementation of the smoothed marginal-likeli-hood estimator of Newton and Raftery (27) in Tracer (28), Bayes factors between the strict and relaxed clock models were calculated, and results from the favored model for each respective data set were carried forward. The first 10% of the sampled trees were disregarded as burn-in, and the remainder imported into Python and converted to the standard Newick format using Biopython’s Phylo module (29).
For each MCMC run, the maximum clade credibility (MCC) tree (23) was computed using Treeannotator (30), and 10 other sample trees were chosen at regular intervals along the chain. At the end of this stage, a total of 11 trees were associated to each data set: the MCC tree, plus 10 addi-tional trees randomly sampled from the posterior distribution (sample trees).
Codon reconstruction.We used an implementation of the
[image:3.585.42.548.79.367.2]Muse-Gaut codon model (MG94) (31) in HyPhy (32) as described previously (33) to estimate the ancestral sequence at the root of the tree. This model takes into account the difference between synonymous and nonsynony-mous codon substitutions. The reconstructed ancestral root sequence was estimated by joint maximum likelihood (ML sequence [34]), and 10 ad-ditional ancestral root sequences were sampled from the posterior distri-bution (“sample” sequences) for a total of 11 reconstructed ancestral se-quences associated to each tree. Since there were 11 trees associated to each data set (1 MCC trees and 10 sample trees), this made for a total of
TABLE 1Data set characteristicsa
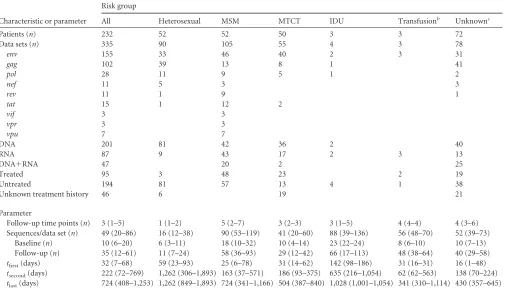
Characteristic or parameter
Risk group
All Heterosexual MSM MTCT IDU Transfusionb Unknownc
Patients (n) 232 52 52 50 3 3 72
Data sets (n) 335 90 105 55 4 3 78
env 155 33 46 40 2 3 31
gag 102 39 13 8 1 41
pol 28 11 9 5 1 2
nef 11 5 3 3
rev 11 1 9 1
tat 15 1 12 2
vif 3 3
vpr 3 3
vpu 7 7
DNA 201 81 42 36 2 40
RNA 87 9 43 17 2 3 13
DNA⫹RNA 47 20 2 25
Treated 95 3 48 23 2 19
Untreated 194 81 57 13 4 1 38
Unknown treatment history 46 6 19 21
Parameter
Follow-up time points (n) 3 (1–5) 1 (1–2) 5 (2–7) 3 (2–3) 3 (1–5) 4 (4–4) 4 (3–6) Sequences/data set (n) 49 (20–86) 16 (12–38) 90 (53–119) 41 (20–60) 88 (39–136) 56 (48–70) 52 (39–73)
Baseline (n) 10 (6–20) 6 (3–11) 18 (10–32) 10 (4–14) 23 (22–24) 8 (6–10) 10 (7–13) Follow-up (n) 35 (12–61) 11 (7–24) 58 (36–93) 29 (12–42) 66 (17–113) 48 (38–64) 40 (29–58)
tfirst(days) 32 (7–68) 59 (23–93) 25 (6–78) 31 (14–62) 142 (98–186) 31 (16–31) 16 (1–48)
tsecond(days) 222 (72–769) 1,262 (306–1,893) 163 (37–571) 186 (93–375) 635 (216–1,054) 62 (62–563) 138 (70–224)
tlast(days) 724 (408–1,253) 1,262 (849–1,893) 724 (341–1,166) 504 (387–840) 1,028 (1,001–1,054) 341 (310–1,114) 430 (357–645) a
Values are numbers (n) for patients and data sets or medians (interquartile ranges) for other data. Abbreviations: MSM, men who have sex with men; MTCT, mother-to-child transmission; IDU, injection drug user;tfirst, baseline time point;tsecond, first follow-up time point;tlast, final follow-up time point. “Days” refers to the number of days after the reference point.
bThat is, two blood and one factor VIII donations.
c
“Unknown” usually indicates that patients were participants in a large cohort comprising multiple risk groups.
on November 7, 2019 by guest
http://jvi.asm.org/
121 reconstructed ancestral sequences per data set that could be classified into four categories: a 1⫻MCC tree with an ML sequence (denoted as MCC/ML), a 10⫻MCC tree with a sample sequence (MCC/sample), a 10⫻sample tree with an ML sequence (sample/ML), and a 100⫻sample tree with a sample sequence (sample/sample). For each category except MCC/ML, we computed the consensus of the reconstructed ancestral quences in that category, resulting in four reconstructed ancestral se-quences per data set (one for each category).
Indel reconstruction.A codon model such as the one we used in the previous step only considers one kind of mutational event: nucleotide substitutions. Other mutational events such as insertions and deletions (indels) are generally not accounted for by codon models. Consequently, we were required to reconstruct the evolution of indel polymorphisms in ancestral sequences separately. We evaluated three methods at this stage. The first two were the published software packages Indelign (35) and Ancestors (36). For Indelign, we assumed a geometric distribution for the lengths of the indels. The two distribution parameters, the average length of insertions and the average length of deletions, were estimated separately per data set. For Ancestors, we used the software’s maximum-likelihood heuristic with the default parameters. Since both software packages lack a character representation for missing data, these were replaced with the consensus of the observed indel character states in their respective col-umns. That is, if the state of an indel polymorphism was unavailable at a given position, it was assumed to be in the most common state. This only occurred when the sequence in question was incomplete at either end; these sites represented 0.98% of all follow-up data at the nucleotide level. The programs were run on nucleotide sequence alignments. In addition, we evaluated a series of “gap character” models that were applied to di-chotomized alignments in which indel polymorphisms were represented by “0” or “1” to indicate the absence or presence of a codon. Full details are provided in the supplemental material (see “Gap character models”).
We initially tested all three methods on a representative sample of data sets and found that Indelign and Ancestors performed comparably and significantly outperformed the binary character approach. However, both packages were designed to handle large regions from only a few taxa and were somewhat unstable with intrapatient phylogenies with many branches. We decided to use the Indelign package, since it was more stable with these data than Ancestors. Indelign produced one sequence per tree, totaling 11 reconstructed ancestral indel patterns per data set. We reduced this to two: a single pattern generated with the MCC tree and a consensus of the 10 patterns generated with sampled trees.
Finalization and comparison.The codon reconstructions were over-written with the indel patterns to obtain four ancestral sequences per data set. The reconstructed ancestors were then compared to the baseline con-sensus. These comparisons were undertaken at both the nucleotide and amino acid levels. We did not consider sites where the baseline consensus nucleotide or amino acid sequence had a missing data character (“?”) or was ambiguous, states that comprised only 0.7% of all sites across all data sets at the nucleotide level and 0.7% at the amino acid level. These sites occurred for one of two reasons: (i) either the majority of baseline se-quences were missing (incomplete) at that site (ii) or, of the baseline data present, exactly half of the sequences had one character and half had another. In either case, we could not be sure of the true ancestral state at these sites, so comparison to the reconstruction would be meaningless.
At the nucleotide level, we considered all of the sites where both the reconstruction and baseline consensus had a residue (i.e., neither se-quence had a gap at that site, and the baseline consensus did not have a missing data character). If the ancestral reconstruction did not match the baseline consensus residue, we called that site a “nucleotide error.” We then defined the nucleotide error rate as follows: nucleotide error rate⫽ (the number of nucleotide errors/the number of sites)⫻100%. The “amino acid error rate” was defined in the same way for the amino acid translations of the reconstructed and follow-up consensus sequences. For comparison, we also calculated these error rates when comparing the consensus of all follow-up sequences to the baseline consensus sequence.
Given only sequences from late in infection, the follow-up consensus sequence represents a phylogeny-naive estimate of the transmitted/ founder virus genotype. For example, this consensus sequence would not account for the effect of selection, which would cause certain lineages in the population to proliferate over others and skew the consensus away from the true ancestor. We do not intend to suggest this method as an “alternative” method of ancestral reconstruction but rather as a compar-ator to provide context for our results.
At each site, the reconstructed ancestor may either correctly match the baseline consensus, be ambiguous, or show one of three types of error: substitution (i.e., a nucleotide or amino acid error), insertion (a present nucleotide or amino acid where the baseline consensus is gapped), or deletion (a gap where the baseline consensus has a present nucleotide or amino acid). We define the “overall error rate,” on both the nucleotide and the amino acid levels, as the combined proportion of ambiguous characters and these three types of error, i.e., as [(the number of substitu-tion errors⫹the number of insertion errors⫹the number of deletion errors⫹the number of ambiguous sites)/the number of sites]⫻100%.
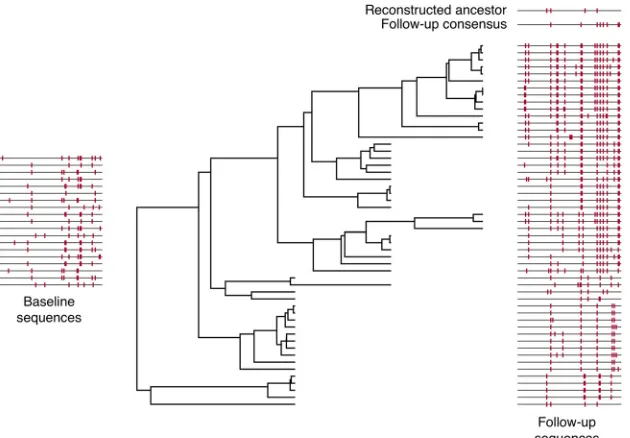
Since we are interested in all types of error, the overall error rate is a useful metric for evaluating reconstruction accuracy. Note that, in data sets with no indel polymorphism, the overall error rate is equal to the amino acid error rate.Figure 1illustrates these definitions, and the com-ponents of ancestral reconstruction, for one data set on which reconstruc-tion was performed with an overall error rate within 0.001% of the me-dian. All sequences in the data set are displayed in the style of Highlighter plots (http://www.hiv.lanl.gov/) with respect to the baseline consensus. In the center is the maximum clade credibility phylogenetic tree. The base-line sequences, which we assume represent the ancestral sequence at the root of this tree, are on the left. On the right, the follow-up sequences are shown at the level of their corresponding tip node in the tree. The fol-low-up consensus and the reconstructed ancestral sequence are shown in comparison to the baseline consensus in the top right. Analogous figures for each data set studied can be found on our web server (link below).
Finally, since insertion and deletion events take place over whole se-quence regions, rather than separately at individual sites, we defined a separate indel error rate to quantify the accuracy of indel reconstruction by regions rather than by sites. We defined an “indel region” as a contig-uous group of alignment columns with a gap occurring at least once in either the follow-up sequences, or the baseline consensus, in every col-umn. If at any site in the region the ancestral reconstruction showed a gap (“-”) and the baseline consensus showed a nucleotide or amino acid, or vice versa, we called the region an “indel error.” A total of 173 (51.6%) of the data sets had one or more indel regions; of these, the number of indel regions was, on average, low (median and interquartile range [IQR]: 3 [1 to 5], with a maximum of 15). The indel error rate was then defined in the same way as the other error rates, using counts of indel regions rather than individual sites, for data sets that had one or more indel regions: indel error rate⫽(the number of indel errors/the number of indel regions)⫻ 100%.
All statistical analyses were conducted with R (37), and plots were made with the ggplot2 (38) package. The data files generated in all six steps of this project (alignment, trees, codon sequences, indel sequences, con-sensuses, and final reconstructions), our database, and analogues ofFig. 1
for all data sets, can be found athttp://bioinfo.cfenet.ubc.ca/pub/ancre2/
(see the ReadMe in this directory for descriptions of all files, as well as the database schema).
RESULTS
Error rates.Toward the goal of evaluating the accuracy of phylo-genetic methods for reconstructing transmitted/founder viruses, we applied ancestral sequence reconstruction techniques to a large panel (n ⫽335 data sets, n ⫽19,486 sequences) of published intrapatient, longitudinal, HIV-1 clonal/SGS sequence data sets. The data originated from 55 studies published between 1991 and 2012 and varied widely with respect to geographic region, HIV
on November 7, 2019 by guest
http://jvi.asm.org/
subtype, transmission risk group, number of patients, and study design. The data sets were selected to contain at least two sample time points at least 6 months (186 days) apart, the first being within 6 months of HIV infection, seroconversion, onset of acute symptomatic seroconversion illness, or birth (in the case of moth-er-to-child transmission). The 6-month baseline cutoff was cho-sen as a liberal definition of “acute/early infection” in order to include as many and as varied data sets as possible (see also refer-ence11for examples of prior investigations of HIV transmission using viruses sampled between 1 and 6 months postinfection). The published sequences had all been generated with either clonal or single-genome sequencing, so that multiple distinct sequences were associated with each time point.
Using the consensus of the earliest available (baseline) time point for each data set as the best estimate of the transmitted/ founder sequence, we evaluated how well one could reconstruct this sequence using only data from subsequent (follow-up) sam-ples. We evaluated several different procedures for extracting an-cestral reconstructions from our phylogenetic analyses of these data sets. First, we used either a random sample of trees from the posterior distribution (this procedure is referred to as “sample”; [39]) or the maximum clade credibility (MCC) tree as the most representative case (see Materials and Methods). Second, we ei-ther used the joint maximum-likelihood (ML) reconstruction of the ancestral genotype at the root of the tree or a random sample from the posterior distribution of genotypes at the root (sample). Overall, there were four combinations of procedures evaluated for tree and sequence reconstructions, respectively, which we denoted as MCC/ML, sample/ML, MCC/sample, and sample/sample.
As a basis for comparison, we also evaluated the accuracy of the phylogenetically naive approach of taking a consensus sequence of follow-up samples (the “follow-up consensus”). The majority of differences between the follow-up and baseline consensuses are
likely due to the selection of within-host mutations that increased in frequency or became fixed in the population between the base-line and follow-up time points. The frequency of these differences represents a phylogeny-naive error rate, corresponding to the de-gree of divergence of the host’s viral population from the trans-mitted/founder sequence (see “Divergence and diversity” below). The results are shown inTable 2. At both the nucleotide and the amino acid levels, all ancestral reconstruction methods yielded lower mean overall, substitution, and deletion error rates than the follow-up consensus approach. However, the mean rates of inser-tion errors were higher for all ancestral reconstrucinser-tion methods than for the follow-up consensus. The difference in accuracy at the amino acid level between ancestral reconstruction and the fol-low-up consensus was highly significant when considered as an interaction effect with sequence diversity (⫹0.8 log odds, bino-mial GLM,P⫽3.49⫻10⫺4). Controlling for this interaction effect and for the effect of entropy itself, ancestral reconstruction remained significantly more accurate than the follow-up consen-sus (⫹0.10 log odds,P⫽0.04), and the magnitude of this im-provement increased with the diversity of the data set (see “Diver-gence and diversity,” below).
Indel reconstruction was performed only for the n ⫽ 173 (51.6%) data sets with one or more indel polymorphisms in their follow-up sequences. When indel errors were counted as a pro-portion of indel regions, rather than as a propro-portion of individual sites, indel reconstruction was revealed to be much more challeng-ing than the reconstruction of ancestral amino acids. At the amino acid level, the mean indel error rate, by regions, of the follow-up consensus was 23.8%. Since the Indelign package reconstructs only maximum-likelihood sequences, the same reconstructed in-del pattern was used for both the ML and sample sequences for each tree, so that the indel error rate varied only with the tree used in the reconstruction. The mean indel error rates were 20.9% for
FIG 1Illustration of ancestral reconstruction process. This figure summarizes the genetic composition and ancestral reconstruction for a representative data set
(with the median reconstruction error rate). Baseline sequences are depicted on the left, with each line segment representing a sequence marked with mutations away from the baseline consensus, akin to a Highlighter plot (http://www.hiv.lanl.gov/). The phylogenetic tree was reconstructed from all follow-up sequences that were sampled at three time points after baseline. Follow-up sequences are depicted on the right with marks indicating mutations from the baseline consensus, and the reconstructed ancestral sequence using phylogenetic methods and the follow-up consensus sequence are depicted above.
on November 7, 2019 by guest
http://jvi.asm.org/
[image:5.585.137.452.66.285.2]indel reconstruction with the MCC tree, and 23.7% for indel re-construction with the sample trees.
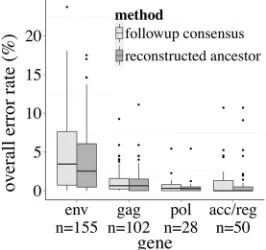
Since the MCC/ML method yielded the lowest overall error rate at both the nucleotide and amino acid levels, all results hence-forth apply to MCC/ML sequences only. Furthermore, all subse-quent references to “error rate” and “overall error rate” refer to the error rates at the amino acid, rather than nucleotide, level. The overall error rates stratified by gene are summarized inFig. 2. The accessory and regulatory genes (nef,tat,rev,vif,vpr, andvpu) are grouped together, since they represented fewer than 20 align-ments each (n⫽51 total). HIVenvwas substantially more diffi-cult to reconstruct than any other gene (Mann-Whitney test,P⬍
10⫺5), withgaghaving the second-highest error rate, followed bypol, and lastly the accessory and regulatory genes. Across all genes, the median error rates for ancestral reconstruction were lower than or equal to the median error rates for the follow-up consensus.
Determinants of error rate.The fact that the data we analyzed originate from diverse study types introduces many possible
sources of reconstruction error. We expected both the design of the study and the clinical characteristics of patients involved to have an impact on the error rate. To identify which variables had an impact on error rates and to what extent, we identified several study design parameters and data features and evaluated their association with error rates using a generalized linear model (GLM). For a data set, we define “⌬t” as the number of days be-tween the baseline and first follow-up samples. In other words,⌬t
is the amount of time evolution has progressed unobserved within the patient after the initial sampling and thus quantifies the amount of diversification we must “undo” to recover the founder strain. Other study design factors that we examined were as fol-lows: the mean number of days between follow-up samples (in-trasample time), the mean number of sequences per time point, and the number of samples per year of additional follow-up (0 for only one follow-up time point). The data features we considered were risk group/mode of transmission (MSM, heterosexual, IDU, MTCT, or transfusion), gene (env,gag,pol, or accessory/regula-tory), molecule type (DNA, RNA, or mixed), and treatment his-tory (treated or untreated). Molecule type was taken from the “mol_type” field of each GenBank entry, with RNA generally orig-inating from free virus in plasma and DNA origorig-inating from pe-ripheral blood mononuclear cells. mRNA molecules were grouped with RNA. If patients ever received antiretroviral therapy (as detailed in the original publication), they were labeled as treated, regardless of the duration or efficacy of the treatment.
[image:6.585.42.546.77.259.2]To identify which of these factors were predictors of recon-struction error rates, we fit a GLM with a logit link function to the overall error rate expressed as a binomial outcome (substitution, insertion, or deletion error, or missing data⫽failure, no error⫽ success). Risk group was unavailable forn⫽78 (23%) of the data sets, since these data originated from cohort studies comprising multiple risk groups and the clinical characteristics of individual patients were not specified. Similarly, forn⫽46 (14%) it was not specified whether the patients were treated or untreated. These cases were excluded from the GLM but are included in all reported univariate relationships.n⫽21 (6%) data sets were missing both pieces of information, so the total number of excluded data sets
TABLE 2Mean error rates of ancestral reconstruction and follow-up consensus at nucleotide and amino acid levelsa
Error rate category
Mean error rate⫻10⫺3(range)
Follow-up MCC/ML MCC/sample Sample/ML Sample/sample
Nucleotide error rates
Overall 14.9 (0–177.9) 13.1 (0–118.8) 14.0 (0–118.8) 13.9 (0–134.9) 13.7 (0–123.0) Substitution 9.5 (0–135.2) 8.6 (0–72.2) 8.6 (0–75.0) 8.1 (0–71.3) 8.3 (0–76.9) Insertion 2.7 (0–66.9) 3.7 (0–66.9) 3.7 (0–65.9) 4.8 (0–92.6) 4.9 (0–92.6) Deletion 1.6 (0–55.6) 0.69 (0–27.9) 0.69 (0–27.9) 0.39 (0–16.5) 0.39 (0–16.5) Missing or ambiguous 1.1 (0–29.7) 0 (0–0) 1 (0–26.6) 0.57 (0–21.5) 0.12 (0–6.3) By indel region 240.9 (0–1,000.0) 207.2 (0–1,000.0) 207.2 (0–1,000.0) 235.6 (0–1,000.0) 235.6 (0–1,000.0)
Amino acid error rates
Overall 27.5 (0–237.4) 23.0 (0–175.0) 24.8 (0–200.0) 23.7 (0–182.9) 23.5 (0–182.9) Substitution 21.0 (0–187.0) 18.6 (0–158.3) 18.5 (0–161.1) 17.4 (0–158.3) 18.1 (0–169.4) Insertion 2.5 (0–66.9) 3.7 (0–66.9) 3.6 (0–64.1) 4.7 (0–92.6) 4.8 (0–92.6) Deletion 1.5 (0–48.8) 0.67 (0–27.9) 0.67 (0–27.9) 0.38 (0–16.5) 0.38 (0–16.5) Missing or ambiguous 2.5 (0–69.3) 0.057 (0–15.1) 2 (0–44.1) 1.2 (0–53.4) 0.23 (0–15.1) By indel region 237.8 (0–1,000.0) 216.4 (0–1,000.0) 216.4 (0–1000.0) 245.7 (0–1,000.0) 245.7 (0–1,000.0)
a
Error rates of follow-up consensus and four ancestral reconstruction methods, broken down by error type (substitution, insertion, deletion, or ambiguous) at both nucleotide and amino acid levels are indicated. Error rates by indel region are also given.
FIG 2Error rates stratified by gene. Box-and-whisker plots show that
ances-tral reconstruction has a lower median error rate than the follow-up consensus across all genes. Error rates ofenvdata are elevated compared to other genes. “Follow-up consensus” denotes the error rate in phylogeny-naive reconstruc-tions from follow-up samples. “Reconstructed ancestor” denotes the error rate in phylogenetic ancestral reconstructions from the same follow-up samples.
on November 7, 2019 by guest
http://jvi.asm.org/
[image:6.585.97.230.539.664.2]wasn⫽103 (31%) We did not consider interaction effects in the GLM because the significant colinearity among some variables would have made it difficult to interpret the interaction terms of the resulting model (see “Sensitivity to route of infection, sam-pling timeline, and viral genome type,” below). The profile of the resulting GLM is shown inTable 3. Coefficients are relative to the most frequent data features, which were MSM risk group,env
gene, DNA-derived sequences, and no treatment.
Increased time between critical time points (t) made recon-struction significantly more difficult (⫺0.08 log odds per year,
P⫽1.15⫻10⫺4;Table 2). This intuitive result was confirmed by examination of the univariate relationship between error rates andt(Spearman’s ⫽0.5,P⬍10⫺5;Fig. 3) and with the time between infection/seroconversion and baseline. The more HIV evolves unobserved, the further its pattern of evolution deviates from the predictive models used in ancestral reconstruction. On the other hand, increasing the number of follow-up time points per year was associated with a higher rate of successful reconstruc-tion (⫹0.3 log odds per follow-up sample per year,P⬍10⫺5), as was increasing the number of sequences per time point, though the effect was more modest (⫹0.03 log odds per additional se-quence,P⬍10⫺5). Reconstruction on HIV RNA-derived data sets was slightly less accurate than on HIV DNA-derived data sets, but this was not significant (⫺0.03 log odds,P⫽0.7). Finally, treat-ment had a positive effect on reconstruction accuracy (⫹0.3 log odds,P⬍10⫺4).
Closer examination of the 17 data sets comprising the highest 5% of error rates did not reveal a single unifying cause for the poor reconstructions. The majority of the data sets wereenv(14env, 2 accessory/regulatory, and 1gag), and the mean alignment length was shorter than the average (247 versus 309 codons). The meant
of these data was more than double the average (1,272 versus 493 days), while the number of follow-up sequences was just over half the average (27 versus 44). Two of three patients in the transfusion risk group were present among the 17, which suggests that these two patients may have been coinfected with more than one founder virus. The other risk groups were represented roughly in proportion to the total (10 heterosexual, 4 MSM, and 1 MTCT), as were molecule types (14 DNA and 3 RNA) and treatment histories
(12 untreated, 4 treated, and 1 unknown). The diversity of the high error rate sequences was over three times the average (mean entropies, 0.3 versus 0.10).
[image:7.585.40.548.76.245.2]Divergence and diversity.Regardless of study design, ances-tral reconstruction is generally impeded by two features of the available data: divergence and diversity. Divergence represents the accumulation and fixation of mutations in the virus population, taking the consensus genotype further away from the transmitted/
TABLE 3GLM profilea
Parameter Coefficient 95% CI (minimum, maximum) P
Intercept (MSM,env, DNA, untreated) 2.75 2.53, 3.0 ⬍10⫺5
Heterosexual –0.21 ⫺0.37,⫺0.04 0.01
MTCT –0.07 ⫺0.27, 0.1 0.54
IDU 0.98 0.64, 1.4 ⬍10⫺5
Transfusion –2.05 ⫺2.47,⫺1.6 ⬍10⫺5
Baseline time (years) –1.03 ⫺1.44,⫺0.6 ⬍10⫺5
⌬t(years) –0.08 ⫺0.12,⫺0.04 1.20⫻10⫺4
Follow-up samples/year (n) 0.34 0.28, 0.4 ⬍10⫺5
Mean sequences/time point (n) 0.03 0.02, 0.04 ⬍10⫺5
gag 1.37 1.21, 1.5 ⬍10⫺5
pol 1.84 1.52, 2.2 ⬍10⫺5
Accessory/regulatory 0.56 0.19, 1.0 4.57⫻10⫺3
RNA –0.03 ⫺0.20, 0.1 0.72
DNA⫹RNA 0.03 ⫺0.19, 0.3 0.78
Treated 0.26 0.13, 0.4 1.06⫻10⫺4
aData were determined using a generalized linear model. Regression coefficients (log odds), 95% confidence intervals (95% CI), andPvalues for the fitted GLM are shown. The parameters used in the GLM are risk group (heterosexual, MTCT, transfusion, and IDU, all relative to MSM), gene (gag,pol, and accessory/regulatory, all relative toenv), molecule type (RNA, RNA⫹DNA, all relative to DNA),⌬t, follow-up samples/year, sequences/time point, and baseline sample time.
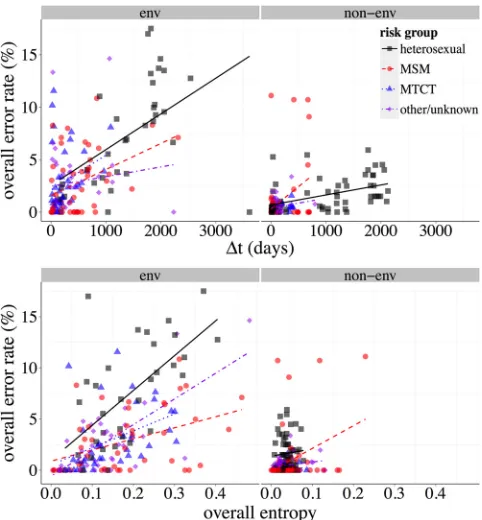
FIG 3Relationship of reconstruction error to⌬tand to entropy,env, and
non-env, stratified by risk group. The scatter plots depict the univariate asso-ciations between overall error rates and amino acid entropy (left) and the time elapsed between the baseline and first follow-up sample (⌬t, right), forenv (top) and HIV genes other thanenv(bottom). Trend lines were derived from linear regressions stratified by risk group as indicated in the inset figure legend.
on November 7, 2019 by guest
http://jvi.asm.org/
[image:7.585.301.542.404.664.2]founder genotype (40). Diversity refers to how different the fol-low-up sequences are from each other or how “spread out” viral evolution has been within the patient (40). We first examined the relationship between diversity and reconstruction accuracy, quantifying diversity with the entropy of the data set. The entropy of an alignment with respect to a set of allowable characters is a measure of diversity, where a higher value indicates a more diverse alignment. The amino acid entropy of an alignment, which is the entropy of the alignment with respect to the amino acid alphabet, was defined by Henikoff and Henikoff (41). We also consider indel entropy, which is analogously defined with respect to the binary alphabet representing presence and absence. A high amino acid entropy indicates a high rate of nonsynonymous polymor-phism; high indel entropy indicates more variable sequence length. The “overall entropy” is the sum of amino acid and indel entropies.
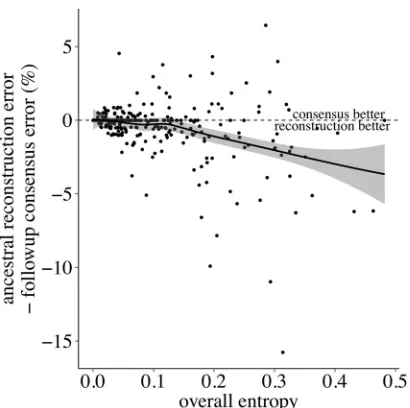
An important measure of ancestral reconstruction’s utility is how well the techniques scale with diversity. As shown inFig. 3, the positive correlation between entropy and error rate is pro-nounced. The more diverse a population, the more difficult re-construction becomes for any method, phylogenetic or otherwise. However,Fig. 4shows that, as entropy increases, the disparity between methods increases. At very high entropy, both methods are disadvantaged, but the relative improvement in accuracy of phylogenetics over the follow-up consensus increases. We note also that both entropy and our definition of error rate are normal-ized by sequence length. The median length of the alignments was 233 codons, and we found no significant difference in reconstruc-tion error rates between sequences above and below this value (Wilcoxon rank-sum test,P⫽0.4).
Population divergence is more intuitively quantified than di-versity, simply by counting the differences between the baseline and follow-up consensus sequences. In other words, the diver-gence of the population can be directly quantified by the error rate
of the follow-up consensus. As the ultimate goal of ancestral re-construction is an error-free recovery of the transmitted/founder virus sequence, we examined the cases where perfect reconstruc-tion was accomplished by either method. Cases where the baseline and follow-up consensuses achieved an exact match— data sets with zero divergence—provided a sanity check on the ancestral reconstruction methods. Examination of cases where ancestral re-construction was error-free informed us about how much diver-gence one could reasonably expect to “undo” with computational methods. Finally, the cases where neither method was perfect in-dicated which technique was more accurate on the more difficult data sets.
There were 79 cases where both methods performed a perfect reconstruction. In 14 cases, the follow-up consensus was perfect but ancestral reconstruction had errors. On the other hand, there were 27 cases of perfect reconstruction by phylogenetics but not by the follow-up consensus. Unsurprisingly, the overall error rates of the follow-up consensus on these data sets were lower than the average (mean [range] error rates 1.1% [0.1 to 6.3%]; see “Error rates,” above). All risk groups except IDU and transfusion were represented in these data sets (10 MSM, 9 unknown, 4 MTCT, and 4 heterosexual). The majority were DNA derived (n⫽14); 5 were RNA derived, and 8 were mixed DNA and RNA data sets. Non-env
genes were over-represented in this sample (63%). Finally, when neither method was perfect, phylogenetics outperformed the fol-low-up consensus by ca. 0.6% of sites (mean error rates⫽3.5% [0.2 to 17.5%] for ancestral reconstruction and 4.1% [0.1 to 23.7%] for follow-up consensus).
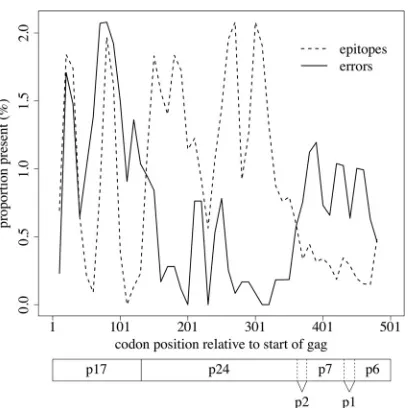
Errors within immunologically relevant positions.Errors oc-curring in immunologically important positions, such as CD8⫹ T-lymphocyte (CTL) epitopes ingag, may also be of particular relevance to vaccine design. We observed a weak, but statistically significant, inverse correlation between overall error rate and den-sity of best-defined epitopes (42) (Spearman’s ⫽ ⫺0.1,P⫽
0.02), a trend particularly noticeable in p24 onward (Fig. 5). How-ever, it is possible that this was due simply to those regions ofgag
which are most epitope dense being most conserved and therefore easier to reconstruct (see Discussion). HIVgagoverall was easier to reconstruct thatenv(see “Error rates,” above) but more diffi-cult thanpolor the accessory/regulatory genes, although sample size may have been a factor in this result.
Rapid divergence from founder.In the preceding analyses, we have measured the accuracy of ancestral reconstruction by com-paring a phylogenetically imputed ancestor to the consensus of samples taken in acute infection. For this comparison to be mean-ingful, the baseline consensus must actually represent the true transmitted/founder strain. However, there may be cases where the baseline consensus is different from the transmitted/founder strain such as, for example, if one or more mutations occurred very early in infection and proliferated to a high frequency by the time of the first (baseline) sample. This possibility introduces an-other source of uncertainty into our reported error rates. Unfor-tunately, since the baseline sequences are the earliest available for each data set, any differences between the baseline consensus and transmitted/founder strain are not directly measurable.
To estimate the impact of this source of uncertainty, we per-formed a similar analysis onn⫽11 longitudinal data sets from a study of simian immunodeficiency virus (SIV)envevolution in macaques experimentally infected by a known inoculum of SIV-mac239 (43). If sequences diverged rapidly from the inoculum
FIG 4Advantage of phylogenetics over naive method increases with diversity.
As entropy of data set increases, the difference between the error rates of the phylogenetic and naive methods increases, in the direction of the phylogenetic method having a lower error rate. Points below the vertical line are data sets where phylogenetics outperforms consensus. Trend line is a local regression (Loess) with 95% confidence interval (shaded area).
on November 7, 2019 by guest
http://jvi.asm.org/
[image:8.585.62.267.64.268.2]genotype by baseline, then one should expect higher error rates when comparing reconstructed genotypes directly to the inocu-lum than against the baseline consensus that will more likely re-semble genetic variants from follow-up samples. In these data, the consensus of SIVenvsequences sampled at baseline (63 to 168 days postinfection) differed from the inoculum genotype at 0.1% of amino acids on average (range, 0 to 0.35%); sequences ranged from 857 to 878 amino acids in length. This level of rapid diver-gence was similar to what has been reported in longitudinal stud-ies of acute HIV infections (21,44,45) (see Discussion). The error rates of the follow-up consensus method were slightly higher when evaluated against the inoculum (mean, 0.33% [0.12 to 0.69%]) than against the baseline consensus (mean, 0.3% [0.12 to 0.58%]). On the other hand, we found no measurable difference in error rates using phylogenetic methods, with means of 0.19% (range, 0 to 0.58%) and 0.19% (range, 0 to 0.47%), respectively, relative to the inoculum and baseline consensuses. These results suggest that rapid divergence of HIV from the transmitted/ founder virus prior to baseline is not a primary source of error in ancestral reconstruction by phylogenetic methods. Since rapid di-vergence before the baseline sample tends to be limited to a small number of sites, however, these error rates are close to the level of stochastic error, making it difficult to measure differences be-tween methods with a high degree of confidence.
DISCUSSION
Previous work.The concept of ancestral reconstruction was first theorized by Zuckerkandl and Pauling (15), whose goal was to “extract evolutionary history from molecules.” Since then, ad-vances in computational techniques and sequencing technologies have allowed researchers to apply ancestral reconstruction to a wide variety of organisms and time scales. In particular, a few studies have made use of ancestral sequence reconstruction to
infer properties of unavailable HIV strains. These studies share the limitation that their methods are unverifiable, as the true ancestor could not be sequenced. For example, Rolland et al. (46) devel-oped a “center of tree” reconstruction method and applied it to
gag,tat, andnefsequences from several different hosts. The recon-structed sequences were synthesized and found to be both func-tional and immunogenic. However, the center of tree sequence was not meant to represent the (unrecoverable) common ancestor to all of the input sequences but rather a hypothetical sequence which minimized evolutionary distance to the extant strains. An-cestral envsequences, reconstructed with maximum-likelihood methods, have likewise been shown to be both functional and immunogenic (47,48). In (33), a reconstruction pipeline from which this work was derived in part was used to examine the pattern of the HIV coreceptor switch within a given host by esti-mating ancestral sequences at all nodes of several intrapatient phylogenies. Although the reconstructed sequences were theo-rized to have existed in the respective patients at some point, this could not be confirmed by sequencing as the study population comprised chronic HIV infections and no early samples were available.
On the other hand, several validations of phylogenetic tree re-construction, a critical step of ancestral rere-construction, have been done within vivoHIV data. Hillis et al. (49) correctly inferred a between-host HIV phylogeny with⌬tbetween 2 and 3 years. Phy-logenetic methods described previously (50) were used to estimate the time elapsed since the most recent common ancestor (tMRCA) of the viral population of several patients, roughly corresponding to date of infection. The estimates corresponded well to clinical measures of infection date. In an earlier study (51), a known HIV phylogeny comprising 13 patients was accurately inferred through a variety of phylogenetic methods.
A natural next step is to apply the idea of testing on real data from the second body of work to the methodological framework of the first—that is, use ancestral reconstruction on groups of extant sequences where the ancestor is already known or can be accurately estimated. This has been applied in a few limited cases, but most often in a controlled laboratory setting. Hillis et al. (52) successfully recovered the branching order (but not the branch lengths) of an experimentally created bacteriophage T7 phylogeny by five different reconstruction methods, and parsimony was used to estimate the ancestral character states with 98.6% accuracy. However, the mutation rate of bacteriophage T7 is substantially lower than HIV. Researchers using experiments with synthesized ancestralenvsequences (48) evaluated their reconstruction meth-ods on a group of macaques inoculated with SIVmacBK28 and were able to recover the inoculum genotype with 99.8% accuracy. The recent availability of longitudinal, intrapatient HIV se-quence data sets provides a large number of test cases for evalua-tion of ancestral reconstrucevalua-tion on real data, with phylogenies having evolved on their own outside a laboratory setting. To our knowledge, ancestral reconstruction has only been applied to one such data set (53). In that case, the objective of the study was not to validate ancestral reconstruction but to examine the relationship of extant sequences to the most recent common ancestor (MRCA). In the present work, we evaluated the performance of phylogenetic methods to reconstruct transmitted HIV variants on a much larger number of cases. We found that, overall, phyloge-netic methods tend to provide a better reconstruction of the amino acid composition of this ancestral sequence than a
consen-FIG 5Proportions of errors and CTL epitopes within HIVgag. Inverse
cor-relation between epitope density and error density. Lines represent sliding window weighted averages of error rates (solid) and epitope densities (dashed) with a window size of 20 codons. Locations of the respective gene products of the Gag precursor, including the matrix (p17), capsid (p24), and nucleocapsid (p7) proteins, are indicated below the plot (based on the HXB2 reference sequence, GenBank accession numberK03455).
on November 7, 2019 by guest
http://jvi.asm.org/
[image:9.585.63.267.63.267.2]sus method. The relative advantage of the phylogenetic method increased significantly with sequence diversity, where reconstruc-tion is generally more challenging for either approach. On the other hand, neither method could reliably reconstruct ancestral indel variation, with mean rates of indel reconstruction error ex-ceeding 21.6%. Finally, reconstruction error rates were signifi-cantly reduced in CTL epitope-dense regions of the HIV genome; this association may be due to the fact that these regions tend to be evolutionarily conserved.
Sensitivity to phylogenetic methods.There are a myriad of programs available for each step of the reconstruction process, and no widely accepted standard for which to use. The packages in our pipeline were chosen based on a combination of literature recommendations and prior experience (50) and limits on com-putational resources. A great many packages exist for the first step, multiple sequence alignment (seeTable 3.1 in reference54) for a list). After all steps of processing, a very poor reconstruction could often be traced back to an inaccurate alignment. Predictably, the hypervariable loops ofenvwere very difficult to align owing to high indel rates in these regions and were likely at least partly responsible for the high error rates seen inenvreconstructions compared to other genes. Many methods also exist for phyloge-netic inference, but the necessity of rooting the tree left us with only two broad options—rooting with an outgroup or using a molecular clock model—and we opted for the latter. As discussed previously (55), outgroup rooting works well only when the out-group is fortuitously chosen close to the ancestor.
To reconstruct sequences at the root of the tree, we chose the Muse-Gaut model of codon substitution (31), which is aware of both nucleotide and amino acid space (in particular, it makes the distinction between a synonymous and nonsynonymous substitu-tion). Mostly, this choice was based on prior experience (50) and having an implementation of the model already available. On the other hand, reconstructing the ancestral indel pattern was a par-ticularly challenging step. To our knowledge, only two published programs, Indelign (35) and Ancestors (36), were available at the time of our study for ancestral indel reconstruction. Moreover, these programs are tailored for whole-genome, macroorganism evolution, where insertions and deletions tend to be large and infrequent. In HIV, indel polymorphisms tend to occur most of-ten in highly variable regions of the HIV genome, such as the region encoding the HIV envelope glycoprotein gp120 variable loops V1 and V2. These regions are inherently difficult to align due to a lack of sequence homology and can undergo extensive change between time points. Finally, our merging of the indel and codon reconstructions by simply “overwriting” one with the other im-plicitly assumes that codons and indels evolve independently, which is unlikely to be the case. On our data, the best phylogenetic methods in the public domain for reconstructing ancestral indel variation were unable to outperform a rudimentary method of taking the consensus of follow-up sequences. This is a significant concern in the context of HIV, where indel variation can play an important role, for example, in mediating escape from the neu-tralizing antibody response (56). Reconstructing ancestral indels is a major challenge because, by definition, the sequence homol-ogy that conventional phylogenetic methods rely on to recon-struct ancestral variation lacks insertions and deletions. As such, this remains an important open area for future work with imme-diate applications to understanding the role of indel variation in transmitted/founder variants of HIV.
Although it complicates the construction of an ancestral re-construction pipeline, the variety of available methods also pro-vides opportunities for further exploration. In particular, the models of evolution used in phylogenetics do not account for recombination as a possible evolutionary event. As such, when recombination does occur, it has the potential to greatly confound both phylogenetic inference (57, 58) and the reconstruction of ancestral sequences (59). Although recombination rates in HIV are high (60), it has recently been suggested that HIV’s effective recombination rate may be 1 to 2 orders of magnitude lower than previously thought (61). In addition, in cases of infection by a single transmitted/founder virus sequence, the only possible types of recombination events are within, as opposed to between, diver-gent lineages (62). Although such events might potentially distort the shape of the estimated phylogeny, the ancestral sequence at the root should be markedly less affected than if interlineage recom-binants were introduced. Regardless of magnitude, recombina-tion is almost certainly a contributing factor to the error rate of ancestral reconstruction. Phylogenetic techniques for ancestral reconstruction which take recombination into account, which could help offset this source of error, are an important area for future research.
Finally, we considered whether sampling trees or sequences conferred an advantage compared to maximum clade credibility phylogenies and maximum-likelihood reconstructions. Hanson-Smith et al. (63) suggest that the Bayesian approach of sampling from the posterior distribution is unnecessary and will not im-prove reconstruction accuracy. Our analysis of longitudinal HIV sequence data agrees with this result, although the apparent loss of accuracy resulting from sampling was very small. This suggests a fairly high degree of uncertainty for our data about both the phy-logeny (perhaps owing to the relatively high homology of intrapa-tient data sets) and the underlying evolutionary process. Indeed, although the heights of the reconstructed phylogenies (which rep-resent the time to most recent common ancestor, i.e., tMRCA) should have been in agreement with the known timelines of lon-gitudinal sampling, this was not always the case, since many of the tree heights were much further in the past than the known refer-ence points (see Fig. S1, left, in the supplemental material). We do not believe this to be entirely attributable to coinfection, since it was observed across all risk groups and even in the SIV data sets we examined, which were known to have only one transmitted/ founder. We investigated the possibility that the assumption of a constant population size was having a deleterious effect on tree heights by using a Bayesian skyline model to marginalize out un-certainty about population dynamics; however, the Bayes factors indicated strong support for the constant population size model in most data sets (data not shown). We also observed a significant correlation between the variance in tree heights sampled from the posterior and reconstruction error (see Fig. S1, right, in the sup-plemental material), further contributing to the evidence for a high degree of phylogenetic uncertainty in these data.
Sensitivity to route of infection, sampling timeline, and viral genome type.A core assumption of applying phylogenetic meth-ods to the problem of reconstructing the sequence of the trans-mitted/founder virus is the existence of a population bottleneck at transmission, resulting in a single productive viral lineage (64). Multiple studies have reported that, although the majority of new infections stem from a single variant, coinfection with two or more variants does occur (7,22,62,65). Using the methods of
on November 7, 2019 by guest
http://jvi.asm.org/
Keele et al. (11), we isolatedn⫽135 data sets where the estimated
tMRCAfell within 3 months on either side of the known reference point. Given the potential margin for error in the reference point itself (which is often reported as the midpoint between the last seronegative and first seropositive HIV test), we could be reason-ably certain that these data sets satisfied the hypothesis of a single transmitted/founder virus. Error rates for these data sets were lower than average (mean error rates [range]⫽1.6% [0 to 14.6%] for ancestral reconstruction and 1.9% [0 to 16.0%] for follow-up consensus), but the relative advantage of phylogenetics over the naive approach (18.5%) was roughly consistent with the rest of the data. A histogram of discrepancies betweentMRCAestimates and known reference points is provided in Fig. S2 in the supplemental material.
On the other hand, modes of HIV transmission that bypass the recipient’s mucosal barriers (e.g., via injecting drugs or blood transfusion) can result in a greater number of infecting strains (66). Since our methods rely on the assumption of a single founder virus, we would expect the reconstructions to be of greatly dimin-ished accuracy in these cases. Although we only had data from six patients in these categories, we observed elevated rates of overall reconstruction error (relative to the MSM risk group) that were consistent with this hypothesis. In the transfusion risk group (n⫽
3) the error rates were well above average (13.3, 14.6, and 6.6%); the error rates of the data sets in the IDU risk group (n⫽4) were 0, 0, 1.9, and 3.4%.
We also observed significantly greater reconstruction errors among individuals in the heterosexual risk category relative to MSM (mean error rates [range]⫽3.7% [0 to 17.5%] for hetero-sexuals versus 1.8% [0 to 11.1%] for MSM). However, it is very likely that this result was due to confounding with other study design variables. Values of⌬twere much higher for the heterosex-ual data, averaging several years for the heterosexheterosex-ual transmission group but only months for the MSM group (median days [IQR]⫽ 1,202 [252 to 1,852] for heterosexuals versus 89 [30 to 489] for MSM). The heterosexual group also had fewer sequences per time point than the MSM group (median number [IQR]⫽10 [7 to 14] for heterosexuals versus 15 [10 to 20] for MSM).
To compare risk groups while controlling for⌬t, we performed a matched test by selecting pairs of data sets, one from each risk group, with values of⌬twithin 15 days of each other. We then compared the error rates between matched pairs of data sets using a paired Wilcoxon signed-rank test. This controls for the effect of ⌬ton error rates; however, due to the wide variation oftvalues, matched pairs comprised only a small subset of the data sets. Us-ing this procedure, we found no significant differences between the heterosexual and MSM risk groups (n⫽26,P⫽0.7), the MSM and MTCT risk groups (n⫽31,P⫽0.2), or the heterosex-ual and MTCT risk groups (n⫽20,P⫽0.09).
We hypothesize that the effect of HIV molecular type (proviral DNA versus RNA) on reconstruction error was due to the pres-ence of “archived” proviral HIV sequpres-ences in the reservoir of la-tently infected cells (67), which has been previously observed to affect the accuracy of phylogenetic inference (68). Moreover, data sets where both DNA and RNA were sequenced tended to have higher error rates than data sets derived from only one molecular type. This outcome suggests that the evolutionary processes within cellular reservoirs represented by the samples of HIV DNA are very different from the processes shaping variation among free virions in plasma. A single evolutionary model may not
ade-quately capture this heterogeneity. As with risk group, the HIV molecular type was correlated with other study design variables. In particular, RNA data sets tended to have lower⌬t, a shorter interval between the reference point and baseline sample, and more follow-up time points per year than DNA data sets (all Wil-coxon rank-sum test,P⬍10⫺5). Although confounding between study parameters makes it difficult to attribute the impact of each parameter on reconstruction error rates, our model analysis indi-cates that a combination of RNA data, low⌬t, high numbers of sequences per time point, and frequent follow-up provides the best chance of an accurate ancestral reconstruction. In addition, the techniques may be inappropriate for modes of transmission where the probability of coinfection is high, such as via blood transfusion or the use of injection drugs.
Finally, there is no guarantee that the consensus of the baseline sequences is an accurate representation of the true transmitted/ founder virus. Discrepancies may occur if, for example, a muta-tion in the HIV genome appearing very early in infecmuta-tion reaches a high frequency in the virus population before the baseline sam-ple is taken. In this case, neither a naive consensus nor phyloge-netic approaches would be able to accurately reconstruct the in-dividual transmitted/founder virus. Instead, estimates of this sequence will erroneously include substitutions that became fixed in the population between transmission and the earliest date of sampling. To assess the impact of rapid divergence from the founder genotype, we analyzed longitudinal data sets of SIVenvin 11 macaques experimentally infected with a clonal SIVmac239 inoculum, such that the transmitted/founder virus genotype was known without ambiguity. In these data, there was limited amino acid divergence (mean, 0.1%) from the inoculum genotype by the baseline sample. As expected, we observed slightly higher mean error rates when the follow-up consensus sequences were evalu-ated against the inoculum instead of the baseline consensus. In contrast, we observed no difference in mean ancestral reconstruc-tion error rates with respect to the inoculum or baseline consen-sus, suggesting that phylogenetic methods were less sensitive to rapid sequence divergence before baseline.
It may be difficult to generalize results from SIV to the rapid divergence of HIVin vivo. However, we found comparable levels of divergence within similar time frames (within 6 months of in-fection) have been reported in studies of acute HIV infections with exceptionally early samples. Herbeck et al. (21) analyzed whole HIV genome sequences (⬃9,100 bp) sampled longitudinally from three seroconverters, including samples as early as 3 days after the onset of symptoms, and found that between 9 and 18 mutations (0.1 to 0.2% of the genome) had accumulated under positive se-lection by 6 to 7 months. These researchers also noted that the transition from a star- to lineage-based phylogeny may occur as early as 50 days into infection, which would shift the baseline consensus away from the transmitted variant. Similarly, Henn et al. (44) performed whole-genome “deep” sequencing on longitu-dinal samples of HIV from one subject, including a sample taken within 15 to 20 days of infection, and identified 2 mutations (⬃ 0.02%) that attained⬎50% prevalence by 6 months after presen-tation. Finally, Goonetilleke et al. (45) performed longitudinal single-genome amplification sequencing on three patients who were at Fiebig stage II (18 to 34 days postinfection) at screening and identified between 4 and 12 mutations (0.05 to 0.15% of the genome) which had become dominant by 6 months after screen-ing. Although our analysis of SIV data sets suggests that