White Rose Research Online [email protected]
Universities of Leeds, Sheffield and York
http://eprints.whiterose.ac.uk/
This is an author produced version of a paper due to be published in Journal of Autism and Developmental Disorders.
White Rose Research Online URL for this paper:
Published paper
Taylor, N., Isaac, C., Milne, E. (2010) A comparison of the development of audiovisual integration in children with autism spectrum disorders and typically developing children, Journal of Autism and Developmental Disorders, Published Online 2010
Title:
A Comparison of the Development of Audiovisual Integration in Children with Autism Spectrum Disorders and Typically Developing Children.
Authors:
Natalie Taylor, Clinical Psychology Unit, University of Sheffield. Claire Isaac, Clinical Psychology Unit, University of Sheffield. Elizabeth Milne, Department of Psychology, University of Sheffield.
Running head:
This study aimed to investigate the development of audiovisual integration in children with Autism Spectrum Disorder (ASD). Audiovisual integration was measured using the McGurk effect in children with ASD aged 7–16 years and typically developing children (control group) matched approximately for age, sex, nonverbal ability and verbal ability. Results showed that the children with ASD were delayed in visual accuracy and audiovisual integration compared to the control group. However, in the audiovisual integration measure, children with ASD appeared to ‘catch-up’ with their typically
developing peers at the older age ranges. The suggestion that children with ASD show a deficit in audiovisual integration which diminishes with age has clinical implications for those assessing and treating these children.
A Comparison of the Development of Audiovisual Integration in Children with Autism Spectrum Disorders and Typically Developing Children.
Neuroconstructivist approaches to child development (e.g. Karmiloff-Smith, 1998) emphasise the importance of small, seemingly insignificant differences between infants with and without
developmental disorders. These tiny differences are hypothesised, over the lifespan, to develop into larger recognisable patterns of symptoms, constituting clinical syndromes (Karmiloff-Smith, 1998). This suggests that from similar origins, a disorder can have diverse presentations, as the original deviance from a ‘typical’ pattern of development triggers further deviance, and more obvious signs of neurodevelopmental difference. Therefore, Karmiloff-Smith (1998) argued that neuropsychologists should focus on the small, micro-level differences between children with and without developmental disorders, rather than investigating wide ranging cognitive abilities.
Sensory processing has been of interest to autism researchers for decades, with the literature suggesting that people with ASD experience sensory events in a different way to people without ASD (for a review, see Iarocci & MacDonald, 2006). Audiovisual integration, or the integration of sight and sound, is particularly relevant to autism researchers, because of the importance of audiovisual
about the process of development of audiovisual integration, nor about where deviance from typical development begins.
This study aims to investigate the development of audiovisual integration in children with ASD
compared to typically developing children. The McGurk task will be used to investigate this, as there is evidence that McGurk effect increases with age (Dupont et al., 2005). Developmental trajectories (e.g. Karmiloff-Smith et al., 2004) will be devised showing the development of auditory accuracy (the ability to identify auditory speech syllables), visual accuracy (the ability to identify speech syllables by lip-reading), and audiovisual integration across age for the ASD group and control group. The
trajectories will be compared to see whether either the rate of development (indexed by the gradient of the best-fit line) or the level of performance at the youngest age tested (indexed by the intercept of the best-fit line, and indicative of developmental delay at the youngest age tested) are different between the ASD and control groups. It is hypothesised that there will be no significant differences in the
development of auditory accuracy between groups, given the simple nature of repeating auditory speech syllables. Given evidence of poorer speech-reading in children with ASD (Williams et al., 2004), it is expected that the ASD group will be delayed in visual accuracy compared to the control group at the youngest age tested, shown by a lower intercept in the ASD trajectory. Furthermore, it is expected that the ASD group will be impaired in audiovisual integration at the youngest age tested compared to the control group, demonstrated by a lower intercept in the trajectory best-fit line for the ASD group.
Method
Participants
with ASD aged 7:11 – 16:5 years (ASD group), recruited from local schools (both specialist ASD schools and mainstream schools with specialised resource units, in which children with ASD are taught in mainstream school with extra support), and 30 children without ASD aged 8:4 – 16:5 years (control group), recruited from local mainstream schools. This age range was chosen because children within this age range could understand the experimental task, but should still show development of
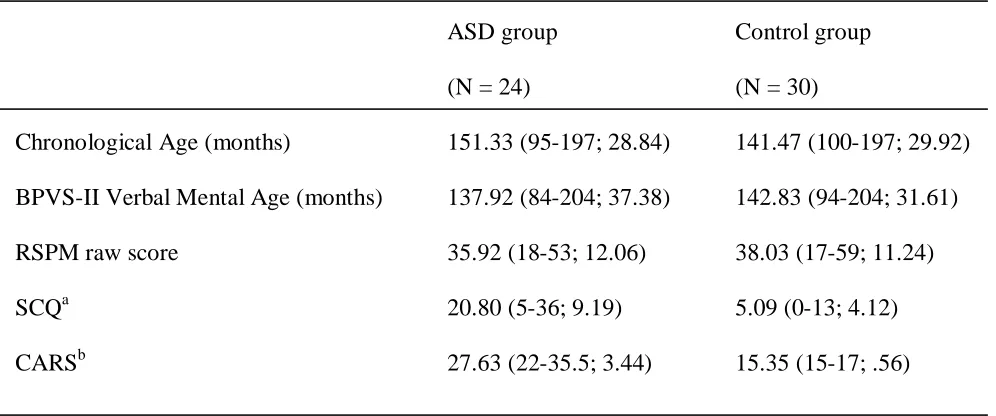
audiovisual integration (Hockley & Polka, 1994). Each child with ASD had a pre-existing diagnosis of ASD (High-functioning Autism, Autism, or Asperger Syndrome) made by a qualified practitioner based upon criteria specified in the Diagnostic and Statistical Manual of Mental Disorders, 4th Edition (APA, 1994) and was receiving specialist help within school because of this diagnosis. Each child was also rated by the experimenter using the Childhood Autism Rating Scale (CARS; Schopler, Reichler & Rochen Renner, 2002), and parents were asked to fill in the Social Communication Questionnaire (SCQ; Rutter, Bailey, Berument, Lord & Pickles, 2003), a parent-report measure designed to screen for pervasive developmental disorders. All participants completed the Ravens Standard Progressive Matrices (RSPM; Raven, Raven & Court, 1998) and the British Picture Vocabulary Scale (BPVS-II; Dunn, Dunn, Whetton & Burley, 1997). Descriptive statistics for chronological age, RSPM, BPVS-II, CARS and SCQ scores are shown in Table 1.
[place Table 1 about here]
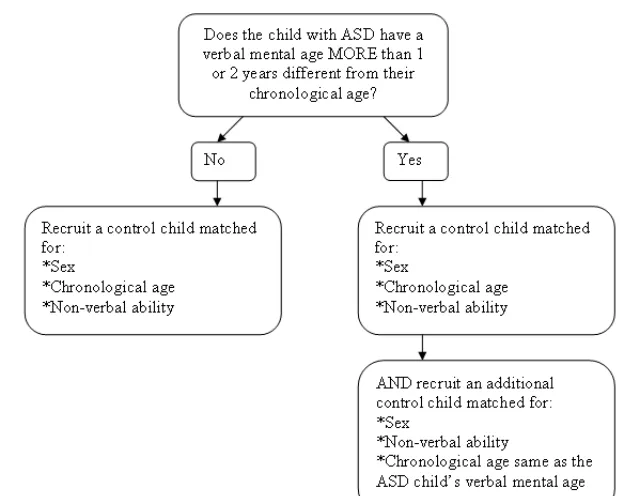
The process for matching control children is summarised in Figure 1. Each child in the ASD group was individually matched on the basis of chronological age (to within 12 months), sex and non-verbal ability (to within 11 points, as indexed by RSPM) to a control child without autism. Moreover, where the child with ASD had a verbal mental age (as indexed by the BPVS-II) that was discrepant, by more than 1-2 years, to their chronological age, a further control child was recruited with the same
chronological age as the child with ASD’s verbal mental age. Given the problems discussed in the literature of exact matching based upon measures such as the BPVS and RSPM (in which such measures typically overestimate the abilities of children with ASD, e.g. Burack, Iarocci, Flanagan & Bowler, 2004; Mottron, 2004), this group was not intended to be an exact verbal mental age match to the ASD group, but intended to ensure that the control group roughly encompassed the ASD group’s verbal mental and chronological ages. A benefit of the developmental trajectory approach is that the issue of control group matching has less potential to influence the results than in more traditional clinical vs. control group comparisons, as the factor of interest is development over a wide age range (thus a wide range of mental ages and ability-levels), rather than performance at a fixed age and ability level (Karmiloff-Smith et al., 2004). The control group in this study spanned both the chronological and verbal mental ages of the ASD group, consistent with the developmental trajectory approach (Karmiloff-Smith et al., 2004).
[place Figure 1 about here]
Materials
scale designed to screen for autism, and has demonstrated good reliability and validity (Schopler et al., 2002). The SCQ is a parent-report questionnaire designed to screen for pervasive developmental disorders, and has shown good reliability and validity in clinical samples (Rutter et al., 2003).
McGurk stimuli used by Bohning, Campbell and Karmiloff-Smith (2002) in their study of audiovisual integration in individuals with Williams Syndrome were used here as these stimuli have been shown to elicit reliable McGurk effects. Stimuli consisted of a range of disyllables (/aba/, /ava/, /atha/, /ada/, and /aga/) spoken by an unfamiliar female English speaker and presented on a laptop computer with a 13 x 8 inch high-definition screen. For further details of how the stimuli were generated, please see
Bohning et al. (2002). Auditory only stimuli were syllables played on the soundtrack accompanying a blank computer screen, and visual only stimuli were syllables played visually (so that the speaker’s face was visible) without the auditory sound track. Audiovisual stimuli were stimuli in which the participant could both see and hear the speaker. Audiovisual stimuli were generated for every
combination of auditory and visual disyllables, so that 5 items were congruent (the auditory soundtrack matched the visual track) and 20 items were incongruent (the auditory soundtrack was different to the visual track). The stimuli were organised into discrete lists, with each list containing the same 35 items representing the 5 auditory-only items, the 5 visual-only items, the 5 congruent audiovisual items, and the 20 incongruent audiovisual items. The order of items was different in each list. Each item
consisted of the speech segment (1 sec) and a 3 sec blank screen in which the participant was asked to respond by repeating ‘what the lady said’. Participants first completed 5 practice items to ensure that the child understood the procedure.
approximately 1 metre from the computer screen, and the auditory sound track was presented via internal headphones to minimise extraneous noise where possible. Some participants in the ASD group would not use headphones. In these circumstances, the corresponding control child/children were also tested without headphones in order to equate the McGurk task presentation between groups. The experimenter sat with the child during the task to ensure that they looked at the computer screen during every trial.
Procedure
Each child in the ASD group completed the BPVS-II, RSPM and McGurk task in a one hour individual testing session which was held in a quiet room at the child’s school, usually during a lesson period. The order of the session was either BPVS-II or RSPM, followed by the McGurk task, followed by BPVS-II or RSPM (depending upon which had been completed at the beginning of the session). The order of the BPVS-II or RSPM was alternated with each participant to counterbalance order effects. The McGurk task was always kept in the middle of the session to try to maximise concentration (the child had settled in but should not be tired).
Results
Suitable matched control children within mainstream schools could not be found for 4 children with ASD due to the low ability levels of these children. However, these children were included in the analysis (and in Table 1) because it focuses upon developing trajectories or models of development for each group, and increasing the number of available data points can improve the accuracy of the
resulting models. In addition, 2 children (one in the ASD group and one in the control group) only completed 3 out of 4 lists of stimuli due to time constraints. Visual inspection of the results suggested that none of these children were outliers in the McGurk task, and their results were therefore included in the analysis.
Similarly to Bohning et al. (2002), McGurk task data were scored so that participants gained credit – a score of 1 - for correctly identifying the auditory disyllable (/aba/, /ava/, /atha/, /ada/ and /aga/) in auditory only trials and correctly identifying the viseme in visual trials (/aba/, /ama/, and /apa/ were scored as correct for the visual stimulus /aba/; /afa/ and /ava/ for visual /ava/; /atha/ for visual /atha/; /ata/ and /ada/ for visual /ada/; /aka/ and /aga/ for visual /aga/). McGurk scores across consonant types and trials were averaged so that mean scores for auditory only and visual only stimuli were calculated. Audiovisual trials were scored so that participants gained credit for correctly identifying the auditory disyllables for incongruent and congruent audiovisual stimuli (see below for further details). From the McGurk task scores, three dependent variables were identified: auditory accuracy; visual accuracy; and McGurk effect (audiovisual integration).
score for each group. These best-fit linear models were labelled ‘developmental trajectories’ (Thomas et al., 2009). Statistically significant linear models (with high R2 and p<.05), suggested that there was a reliable linear relationship between chronological age and task score in a group. Statistically non significant models (p>.05) suggested that the linear relationship was unreliable. For all generated trajectories, Cook’s D statistics were calculated to identify whether any cases (participants) exerted undue influence upon the regression model, and cases with values >1 were excluded as outliers. Residuals were examined and z statistics for skew were calculated. 1 In line with the conventions described by Tabachnick and Fidell (1996), z statistics exceeding 2.58 for regression models were seen as indicators that linear models were inappropriate to characterise the data.
Cross-sectional Analysis of Covariance (ANCOVA) was used to establish whether the dependent variables for each group differed significantly in performance at the youngest age tested (intercept) and rate of development (gradient; Thomas et al., 2009). A significant main effect of age indicated a relationship between task score and age when the groups were combined. A significant main effect of group indicated that task score was different between groups, and that the intercept (performance at youngest age tested) was different between groups (Thomas et al., 2009). A significant interaction between age and group indicated that the rate of development (gradient) was different between groups (Thomas et al., 2009).
Auditory Accuracy
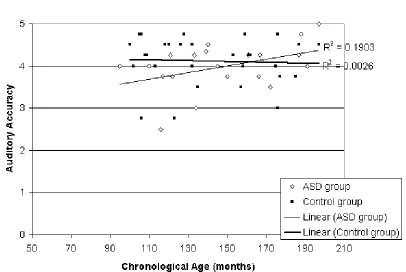
are shown in Figure 2.2 Linear regression suggested that the relationship between chronological age and auditory accuracy was reliable for the ASD group (R2= .19, F(1, 22) = 5.172, p < .05), and auditory accuracy appeared to increase with chronological age. In contrast, the relationship between chronological age and auditory accuracy was not reliable for the control group (R2 = .003, F(1, 28) = .074, p = .787). The lack of relationship between chronological age and auditory accuracy in the control group appears to reflect a ceiling effect, as most participants scored 80% correct or more. No Cook’s D statistics exceeded 1.
[place Figure 2 about here]
ANCOVA was used to compare the rate of change in performance relative to chronological age, and the age at onset (intercept) between groups. Auditory accuracy was entered as the dependent variable, group as the independent variable, and chronological age was entered as the covariate. Following Thomas et al. (2009), the interaction of group x covariate (chronological age) was also entered into the ANCOVA model in order to examine whether auditory accuracy varied differently with chronological age across the 2 groups. There were no statistically significant effects of chronological age (F(1,50) = 1.845, p = .181, ηp2 = .036), group (F(1,50) = 3.789, p = .057, ηp2 = .07), or group x chronological age
interaction (F(1,50) = 3.024, p = .088, ηp2 = .057). As illustrated in Figure 2, this suggests that the
development and onset (performance at the youngest age tested) of the ASD trajectory for auditory accuracy was not significantly different from the control group trajectory, although the lack of statistical reliability of the control group model means that this model should be treated with caution.
Visual Accuracy (Speech-Reading)
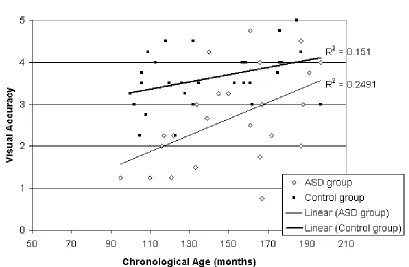
possible score was 0. Trajectories for the ASD and control group are shown in Figure 3. Linear regression suggested that visual accuracy reliably increased with chronological age for both the ASD group (R2= .249, F(1, 22) = 7.298, p<.05) and the control group (R2= .151, F(1, 28) = 4.982, p<.05). No Cook’s D statistics exceeded 1. ANCOVA was used to compare the gradient and intercept of the regression lines between groups. Visual accuracy was entered as the dependent variable, group as the independent variable, and chronological age was entered as the covariate. As with auditory accuracy, the interaction of group x chronological age was also entered into the model. There were statistically significant main effects of group (F(1,50) = 12.735, p<.01, ηp2 = .203) and chronological age (F(1,50)
= 13.287, p<.01, ηp2 = .210), but there was not a significant group x chronological age interaction
(F(1,50), = 1.982, p = .165, ηp2 = .038). As illustrated in Figure 3, these results suggest that the ASD
group was significantly delayed in performance at the youngest age tested relative to the control group, but that the rate of development of visual accuracy (gradient) in the ASD group was not significantly different than in the control group.
[place Figure 3 about here]
McGurk Effect
= .007), group (F(1,48) = 1.342, p =.252, ηp2 = .027) or chronological age x group interaction (F(1,48)
= .523, p =.473, ηp2 = .011). However, it was felt that this scoring method could have been affected by
children who had poor auditory recognition skills, and in fact when auditory accuracy was entered into the ANCOVA model as a covariate, its main effect reached significance (F(1,48) = 20.114, p<.001, ηp2
= .295), whilst visual accuracy did not (F(1,48) = 2.726, p =.105, ηp2 = .054). In the Bohning et al.
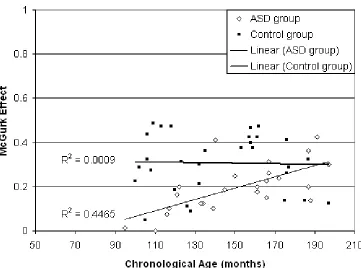
(2002) scoring, incorrect responses to incongruent audiovisual stimuli were taken as indicators of increased McGurk effect, so poor auditory recognition skills may have confounded with audiovisual integration. To address this issue, baseline auditory accuracy was then corrected for by subtracting the mean individual score for incongruent audiovisual stimuli (the mean score for the 20 items in which the auditory disyllable was different from the visual disyllable, ranging between 0 and 1) from the mean individual score for congruent audiovisual stimuli (the mean score for the 5 items in which the visual disyllable was the same as the auditory disyllable, ranging between 0 and 1) for each participant. The resulting difference score was labelled ‘McGurk effect’, and taken to represent level of audiovisual integration.
Figure 4 depicts trajectories showing McGurk effect for the ASD and control groups. Linear regression suggested that McGurk effect increased reliably with age in the ASD group (R2 = .447, F(1, 22) = 17.749, p<.001), but not in the control group (R2 = <.001, F(1, 28) = .025, p = 875). No Cook’s D statistics exceeded 1.
[place Figure 4 about here]
ANCOVA was used to compare performance at the youngest age tested (intercept) and rate of
significant main effect of group (F(1,50) = 16.176, p<.0001, ηp2 = .244), chronological age (F(1,50) =
5.027, p<.05, ηp2 =.091 ), and group x chronological age interaction (F(1,50) = 6.165, p<.05, ηp2
=.110). As illustrated in Figure 4, these results suggest that the ASD group were delayed in frequency of McGurk effect at the earliest age tested (intercept) but showed a faster rate of development
(gradient) relative to the control group, resulting in similar scores to the control group at the older ages tested. However, due to the unreliable linear model for the control group, these results should be treated with caution.
To examine whether the differences found between groups in McGurk effect could be attributed to poorer visual accuracy, ANCOVA was repeated as before with visual accuracy entered as an additional covariate. Similarly, results showed a significant main effect of group (F(1,49) = 7.788, p<.01, ηp2
=.137), and a significant group x chronological age interaction (F(1,49) = 4.473, p<.05, ηp2 =.084).
The main effect of visual accuracy also reached statistical significance (F(1,49) = 4.064, p<.05, ηp2
=.077), but the main effect of chronological age did not (F(1,49) = 1.276, p =.264, ηp2 = .025). This
suggested that although visual accuracy influenced frequency of McGurk effect, when visual accuracy was controlled for, the ASD group still displayed a delayed performance at the youngest age tested and a faster rate of development across chronological age than the control group.
Discussion
at the older ages tested. Reduced audiovisual integration in the ASD group was partly (but not exclusively) attributable to reduced visual accuracy.
Findings of delayed audiovisual integration skills at the youngest age tested in the ASD group were consistent with the initial hypothesis. However, the ASD group subsequently developed audiovisual integration at a faster rate than the control group. Whilst the unreliable regression models for the control group mean that conclusions about the delay at youngest age tested (intercept) and rate of development (gradient) might be limited, the statistically significant main effects of group in the McGurk effect ANCOVA suggest that there were genuine differences between the mean audiovisual integration scores between groups, with the ASD group showing lower levels of audiovisual integration than the control group. Thus, it can be concluded that the high-functioning ASD sample in this study showed reduced audiovisual integration compared to typically developing control children at the younger ages tested. Moreover, this effect occurred even when visual accuracy was controlled for, suggesting that although visual accuracy is important, reduced audiovisual integration scores could not be wholly attributed to poorer lip-reading ability in the ASD group. This is consistent with the findings of de Gelder et al. (1991).
The ASD group were delayed in visual accuracy compared to the control group across the age range tested. This is consistent with previous findings (e.g. Smith & Bennetto, 2007), and is in agreement with the initial hypothesis. The fact that the ASD group in this sample appeared to be developing speech-reading skills with age is promising, and it would be interesting to investigate visual accuracy in older children with ASD to see whether it reaches the control group level at older ages, or whether the ASD group remain delayed into adulthood.
The lack of a linear relationship between chronological age and audiovisual integration in the typically developing children in the current study is not consistent with previous studies that have investigated the development of audiovisual integration, as these studies have demonstrated increased audiovisual integration in older children and adults compared to younger children (Dupont et al., 2005; Hockley & Polka, 1994; Tremblay et al., 2007). There are methodological differences between the current study and previous studies which may underlie these different findings. Firstly, previous studies included younger children (as young as 4 years) than the current study. It may be that the fastest development in audiovisual integration occurs before the age of 7 years (the youngest age in the current study), making it harder to show age effects in the current sample. Secondly, previous studies mainly compared groups of children at a particular age to groups of older children or adults, rather than charting
development across a wide age range, as was the approach in the current study. Other studies have also used French speakers (Dupont et al., 2005; Tremblay et al., 2007), in contrast to the native English speakers who participated in the current study. Previous research has demonstrated different kinds of McGurk effects in different languages (Sekiyama & Burnham, 2008).
impaired connectivity hypothesis of autism (Rippon, Brock, Brown & Boucher, 2007). Mirror neurone theory suggests that particular cells in the human superior temporal sulcus (STS) labelled ‘mirror neurones’, which are activated during passive observation of another person performing an action, do not function properly in autism, and that these cells are also involved in audiovisual integration
(Williams et al., 2004). Impairment in mirror neurones in the STS of individuals with ASD might also explain deficits in speech-reading, as extensive activation of the STS during speech-reading tasks has consistently been shown in neuroimaging studies (Calvert & Campbell, 2003). There are reasons to suppose that mirror neurone systems may continue to develop well into adolescence (see Kilner & Blakemore, 2007), which would be consistent with the results of the current study. Impaired
connectivity theory (Rippon et al., 2007) suggests that reduced functional connectivity between cortical regions underlies the problems found in ASD, which could result in reduced ability to combine
information between the auditory and visual cortices. Future research investigating the development of audiovisual integration using brain imaging techniques will help to expose the neural basis for
audiovisual integration deficits in ASD, and to elucidate the roles of mirror neurones and impaired connectivity in such deficits.
The current study also has important clinical implications. The finding of delayed speech-reading and audiovisual integration in younger ASD children suggests that these abilities could be targets for early intervention. Given the importance of audiovisual integration and speech-reading in face-to-face communication (e.g. Calvert et al., 1998), helping children with ASD to process face-to-face speech could have implications for future communication and social abilities. Previous studies (e.g. de Gelder et al., 1991) with small groups of participants have suggested that training children with autism to speech-read improves visual accuracy and audiovisual integration, but further research with larger groups of participants is needed to establish whether these effects are reliable, and whether
improvements (if found) have wider effects on communication.
audiovisual integration across age, in contrast to the current control sample. Finally, this study
References
APA. (1994). Diagnostic and Statistical Manual of Mental Disorders (revised, 4th ed.). Washington, DC: American Psychiatric Association.
Bebko, J., Weiss, J., Demark, J., & Gomez, P. (2006). Discrimination of temporal synchrony in intermodal events by children with autism and children with developmental disabilities without autism. Journal of Child Psychology and Psychiatry, 47, 88-98.
Bohning, M., Campbell, R., & Karmiloff-Smith, A. (2002). Audiovisual speech perception in Williams Syndrome. Neuropsychologia, 40, 1396-1406.
Burack, J. A., Iarocci, G., Flanagan, T. D., & Bowler, D. M. (2004). On mosaics and melting pots: Conceptual considerations of comparison and matching strategies. Journal of Autism and Developmental Disorders, 34 (1), 65-73.
Calvert, G. A., Brammer, M. J., & Iverson, S. D. (1998). Crossmodal identification. Trends in Cognitive Sciences, 2, 247-253.
Calvert, G. A., & Campbell, R. (2003). Reading speech from still and moving faces: The neural substrates of visible speech. Journal of Cognitive Neuroscience, 15 (1), 57-70.
de Gelder, B., Vroomen, J., & van der Heide, L. (1991). Face recognition and lip-reading in autism. European Journal of Cognitive Psychology, 3 (1), 69-86.
Dunn, Lloyd M., Dunn, Leota M., Whetton, C., & Burley, J. (1997). The British Picture Vocabulary Scale, (2nd ed.). London: NFER-Nelson Publishing co, Ltd.
Dupont, S., Aubin, J., & Menard, L. (2005). A study of the McGurk effect in 4 and 5-year-old French Canadian children. ZAS Papers in Linguistics, 40, 1-17.
Hockley, N. S., & Polka, L. (1994). A developmental study of audiovisual speech perception using the McGurk paradigm. The Journal of the Acoustical Society of America, 96 (5), 3309.
Karmiloff-Smith, A. (1998). Development itself is the key to understanding developmental disorders. Trends in Cognitive Science, 2 (10), 389-398.
Karmiloff-Smith, A., Thomas, M., Annaz, D., Humphreys, K., Ewing, S., Brace, N., et al. (2004). Exploring the Williams Syndrome face-processing debate: The importance of developmental trajectories. Journal of Child Psychology and Psychiatry, 45, 1-17.
Kilner, J. M., & Blakemore, S. (2007). How does the mirror neuron system change during development? Developmental Science, 10 (5), 524-526.
Massaro, D. (1987). Speech perception by ear and by eye: A paradigm for psychological inquiry. Hillsdale, NJ: Lawrence Erlbaum Associates.
McGurk, H., & MacDonald, J. (1976). Hearing lips and seeing voices. Nature, 264, 746-748. Mongillo, E. A., Irwin, J. R., Whalen, D. H., Klaiman, C., Carter, A. S., and Schultz, R. T. (2008).
Audiovisual processing in children with and without autism spectrum disorders. Journal of Autism and Developmental Disorders, 38, 1349-1358.
Mottron, L. (2004). Matching strategies in cognitive research with individuals with high-functioning autism: Current practices, instrument biases, and recommendations. Journal of Autism and Developmental Disorders, 34 (1), 19-27.
Raven, J., Raven, J. C., & Court, J. H. (1998). Standard Progressive Matrices. Oxford, England: Oxford Psychologists Press Ltd.
Rippon, G., Brock, J., Brown, C., & Boucher, J. (2007). Disordered connectivity in the autistic brain: challenges for the ‘new psychophysiology’. International Journal of Psychophysiology, 63, 164-172.
Rutter, M., Bailey, A., Berument, S. K., Lord, C., & Pickles, A. (2003). Social Communication Questionnaire (SCQ). Los Angeles: Western Psychological Services.
Sekiyama, K., & Burnham, D. (2008). Impact of language on development of auditory-visual speech perception. Developmental Science, 11(2), 306-320.
Smith, E., & Bennetto, L. (2007). Audiovisual speech integration and lipreading in autism. Journal of Child Psychology and Psychiatry, 48 (8), 813-821.
Tabachnick, B. G., & Fidell, L. S. (1996). Using multivariate statistics, (3rd ed.). New York: Harper Collins Publishers.
Thomas, M. S. C., Annaz, D., Ansari, D., Scerif, G., Jarrold, C., & Karmiloff-Smith, A. (in press, 2009). Using developmental trajectories to understand developmental disorders.
Tremblay, C., Champoux, F., Voss, P., Bacon, B., Lepore, F., & Théoret, H. (2007). Speech and non-speech audio-visual illusions: A developmental study. PLoS ONE, 2 (8), e742.
doi:10.1371/journal.pone.0000742
van der Smagt, M., van Engeland, H., & Kemner, C. (2007). Brief report: Can you see what is not there? Low-level auditory-visual integration in autism spectrum disorder. Journal of Autism and Developmental Disorders, 37, 2014-2019.
Williams, J., Massaro, D., Peel, N., Bosseler, A., & Suddendorf, T. (2004). Visual-auditory
integration during speech imitation in autism. Research in Developmental Disabilities, 25, 559-575.
Author Note
Natalie Taylor, Clinical Psychology Unit, University of Sheffield, South Yorkshire, UK. Claire Isaac, Clinical Psychology Unit, University of Sheffield, South Yorkshire, UK. Elizabeth Milne, Department of Psychology, University of Sheffield, South Yorkshire, UK.
Acknowledgements. The authors would like to acknowledge the support of all of the schools, children and young people who participated in this study, to thank Professor Ruth Campbell for the use of the McGurk stimuli, and Dr Adrian Simpson for his statistical advice. This study has been prepared from a DClinPsy doctoral thesis written by the first author.
Correspondence concerning this article should be addressed to Dr. E. Milne, Department of
Footnotes
1
z statistic = skew . standard error of skew 2
Whilst age was re-scaled as the age from the youngest ASD age during the regression and
Tables
Table 1. Descriptive statistics for participants: mean (range; SD).
ASD group Control group
(N = 24) (N = 30)
Chronological Age (months) 151.33 (95-197; 28.84) 141.47 (100-197; 29.92) BPVS-II Verbal Mental Age (months) 137.92 (84-204; 37.38) 142.83 (94-204; 31.61) RSPM raw score 35.92 (18-53; 12.06) 38.03 (17-59; 11.24)
SCQa 20.80 (5-36; 9.19) 5.09 (0-13; 4.12)
CARSb 27.63 (22-35.5; 3.44) 15.35 (15-17; .56)
a
Higher SCQ scores indicated higher ratings of ASD symptoms/behaviours. For this measure, N = 20 for the ASD group and N = 22 for the control group, as not all SCQs were returned by parents.
b
Figure Captions
Figure 1. Diagram to show the matching process for control children.
Figure 2. Developmental trajectories showing auditory accuracy for the ASD group and the control
group, with auditory accuracy plotted against chronological age.
Figure 3. Developmental trajectories showing visual accuracy against chronological age for both
groups.
Figure 4. Developmental trajectories showing McGurk effect against chronological age for both