The predictive value of quantitative nucleic
acid amplification detection of Clostridium
difficile toxin gene for faecal sample toxin
status and patient outcome
Kerrie A. DaviesID1*, Tim Planche2, Mark H. Wilcox1
1 Leeds Teaching Hospitals NHS Trust, and University of Leeds, Leeds, United Kingdom, 2 St George’s
Healthcare NHS Trust, St. George’s University of London, London, United Kingdom
Abstract
Background
Laboratory diagnosis of Clostridium difficile infection (CDI) remains unsettled, despite updated guidelines. We investigated the potential utility of quantitative data from a nucleic acid amplification test (NAAT) for C. difficile toxin gene (tg) for patient management.
Methods
Using data from the largest ever C. difficile diagnostic study (8853 diarrhoeal samples from 7335 patients), we determined the predicative value of C. difficile tgNAAT (Cepheid Xpert C. diff) low cycle threshold (CT) value for patient toxin positive status, CDI severity, mortality and CDI recurrence. Reference methods for CDI diagnosis were cytotoxicity assay (CTA) and cytotoxigenic culture (CTC).
Results
Of 1281 tgNAAT positive faecal samples, 713 and 917 were CTA and CTC positive, respec-tively. The median tgNAAT CT for patients who died was 25.5 vs 27.5 for survivors (p = 0.021); for toxin-positivity was 24.9 vs 31.6 for toxin-negative samples (p<0.001) and for patients with a recurrence episode was 25.6 vs 27.3 for those who did not have a recurrent episode (p = 0.111). Following optimal cut-off determination, low CT was defined as�25 and was significantly associated with a toxin-positive result (P<0.001, positive predictive value 83.9%), presence of PCR-ribotype 027 (P = 0.025), and mortality (P = 0.032). Recur-rence was not associated with low CT (p 0.111).
Conclusions
Low tgNAAT CT could indicate CTA positive patients, have more severe infection, increased risk of mortality and possibly recurrence. Although, the limited specificity of tgNAAT means it cannot be used as a standalone test, it could augment a more timely diagnosis, and opti-mise management of these at-risk patients.
a1111111111 a1111111111 a1111111111 a1111111111 a1111111111
OPEN ACCESS
Citation: Davies KA, Planche T, Wilcox MH (2018)
The predictive value of quantitative nucleic acid amplification detection of Clostridium difficile toxin gene for faecal sample toxin status and patient outcome. PLoS ONE 13(12): e0205941.https://doi. org/10.1371/journal.pone.0205941
Editor: Joy Scaria, South Dakota State University,
UNITED STATES
Received: October 1, 2018
Accepted: November 6, 2018
Published: December 5, 2018
Copyright:©2018 Davies et al. This is an open access article distributed under the terms of the
Creative Commons Attribution License, which permits unrestricted use, distribution, and reproduction in any medium, provided the original author and source are credited.
Data Availability Statement: The data used in this
Background
Laboratory diagnosis ofClostridium.difficileinfection (CDI) is contentious, especially regard-ing the use of standaloneC.difficiletoxin gene (tg) nucleic acid amplification tests (tgNAATs) [1–2]. Tg detection is highly sensitive but poorly specific for the diagnosis of CDI. Detection of free toxin within the stool of symptomatic patients, as opposed to toxin gene, correlates with mortality and severity markers [3]. Notably, outcomes of patients who are tgNAAT+ve/toxin-ve are indistinguishable from those who are tgNAAT-tgNAAT+ve/toxin-ve/toxin-tgNAAT+ve/toxin-ve [3–4]. The possible over-diagnosis of CDI associated with use of tgNAATs alone has been highlighted, as asymptomatic carriage ofC.difficilecan occurs in up to 20% of inpatients [4]. There is a high prevalence of hospital onset diarrhoea (HOD) from other causes [5], and so without a direct toxin assay, a positive tgNAAT assay may simply reflect the detection of “bystander” organism in a patient colonised byC.difficile. Over-diagnosis of CDI in hospitals using standalone tgNAAT can lead to unnecessary treatment, overburden on limited isolation facilities and may cause clinicians to overlook the real underlying diagnosis.
European guidelines recommendC.difficiletgNAAT should only be used as part of a two-stage algorithm, with a toxin detection assay as the second two-stage [2]. Two-stage algorithms using a glutamate dehydrogenase enzyme immunoassay (EIA) or a tgNAAT followed by toxin detection have been widely adopted in the UK [6]. In 2013, 48% of hospitals in 20 European countries were using an optimised algorithm for laboratory diagnosis of CDI, a relative increase of 50% from the previous year [6]. There are distinct differences in laboratory practice between Europe and the USA; in 2014, ~44% of US hospitals reported using tgNAAT alone for CDI diagnosis, whilst in Europe (in 2013) that level was much lower at 5% [4,6].
While qualitative results of tgNAATs have poor positive predictive value for CDI, the value of quantitative data from these assays for CDI diagnosis is uncertain. Lower cycle threshold (CT) value (the point at when sufficient nucleotide is detected and the assay is called positive), in molecular assays may indicate greater quantity of assay target; thus, a lower tgNAAT CT value could equate to higher bacterial load. TheC.difficiletgNAAT CT could provide more information than the binary positive/negative result, by lower CTs predicting poorer outcomes [7,8]. However, limitations of previous studies (single centre design, lack of optimal reference method, cohort sizes and use of composite outcome) mean that the relationship between CT value and CDI severity, including mortality, and risk of recurrence merits further investiga-tion. We have utilised data from the largest ever study ofC.difficilelaboratory diagnostic assays across four centres to determine the value of the tgNAAT CT value in predicting sever-ity of disease, mortalsever-ity and CDI recurrence.
Methods
Study design
The study was approved by the National Research Ethics Service (reference number 10/ H0715/34) for collection of anonymised data without consent. All diarrhoeal faecal samples (with sufficient volume) were collected at 4 UK sites (Leeds Teaching Hospitals, Leeds; St George’s University of London, London; University College Hospital NHS Foundation Trust, London and Oxford University Hospitals NHS Trust, Oxford) between October 2010 and Sep-tember 2011[3]. Fresh samples were tested with two reference methods: cytotoxicity assay (CTA) and cytotoxigenic culture (CTC), and one commercial molecular method for toxin gene detection; Cepheid Xpert C. diff (Cepheid, Sunnyvale, CA, US) (tgNAAT)) [3]. Patient data were collected for markers of CDI severity (WCC, serum creatinine, serum albumin, and PCR- ribotype) and for patient outcomes (30-day mortality, recurrence and length of hospital
on a case by case basis. Applications for access by qualified researchers should be made to the Healthcare Associated Infections (HCAI) Research Programme Manager, Georgina Davis (georgina. [email protected]). Requests will be evaluated according to the following pre-specified criteria: can the data answer this research question, and is the question novel? The data is stored on a shared access drive on the Leeds Teaching Hospitals NHS trust encrypted server, which has a mirror backup every day. Access to this dataset is password protected and access is granted by the Research Programme Manager.
Funding: This work was partly supported by
external funding from the Department of Health, UK, awarded to Leeds Teaching Hospitals NHS Trust (MHW); and partly by the University of Leeds as part of KD’s PhD studentship. The funders had no role in study design, data collection and analysis, decision to publish, or preparation of the manuscript. There was no additional external funding received for this study above that already disclosed.
Competing interests: The authors of this
stay (LOS)). The molecular assay was performed as per manufacturers’ instructions and results collected for presence of genes for toxin B and binary toxin. PCR-ribotyping was performed as previously described [9].
Analysis
Only those patients who had at least one NAAT positive sample were included in the analysis. The area under receiver operator curve (AUROC) was calculated for those samples that were positive by tgNAAT to determine if there was an association between low cycle threshold (CT) and patient faecal toxin positive status, CDI recurrence and mortality. Recurrence was defined as a sample that tested positive for toxin (by CTA) at least 14 days after the initial CTA positive sample for that same patient was tested. Recurrence was only assessed in patients who had repeat samples submitted within the study period. Once a low CT had been defined, associa-tions between low CT (�25) and markers of CDI severity and outcome were investigated by univariate analysis; T-test was used to compare means, Mann-Whitney for Medians (LOS) and Chi-squared for categorical variables.
Results
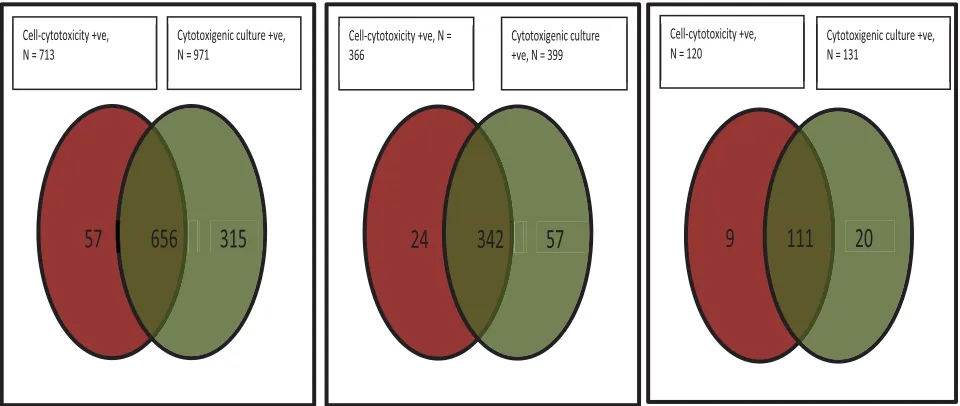
There were 8853 samples from 7335 patients, 1281 of which were NAAT positive and could be used for the analysis. Of the 1281, 713 were CTA positive and 917 CTC positive, with a positive agreement of 51.2% (Fig 1). The median tgNAAT CT value for patients who died was 25.5 vs 27.5 for those who survived (p = 0.021), 24.9 vs 31.6 for CTA positive vs CTA negative faecal samples, respectively (p<0.001) and 25.6 vs 27.3 for patients with vs without a laboratory defined CDI recurrence (p = 0.111). CT values of�24 (to optimise for CTA positivity) and
�25 (to optimise for mortality) were both investigated as cut-off values.
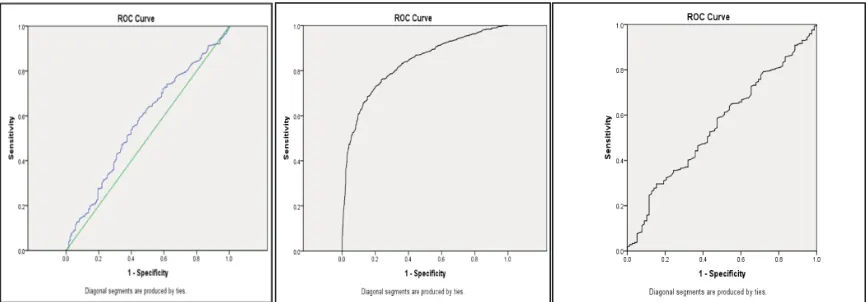
[image:3.612.97.577.475.678.2]Of the 436 samples with a tgNAAT CT�25, 366 were CTA positive and 399 CTC positive, with a positive agreement of 78.4%. Of the 145 samples with a tgNAAT CT�24, 120 were CTA positive and 131 CTC positive, with a positive agreement of 76.6% (Fig 1). The positive predictive values (PPVs) of CT�25 and CT�24 for recurrence were 49.3% and 18.3%, respec-tively. The AUROC for CT value and death was 0.572 (95% CI 0.519–0.624, p = 0.009) (Fig
Fig 1. Results ofC.difficilereference methods. A) all tgNAAT +ve samples (n = 1281) positive agreement 51.2%; (B) those with only CT<25 (n = 436) positive agreement 78.4%; (C) those with only CT�24 (n = 145) positive agreement 76.6%.
2A); the AUROC for CT value and toxin positive status was 0.831 (95% CI 0.808–0.853, P<0.001) (Fig 2B); and the AUROC for CT value and recurrence was 0.557 (95% CI 0.490– 0.624 p = 0.11) (Fig 2C).
Low CT
In a univariate analysis, a CT�25 was significantly associated with a toxin positive result, pres-ence of PCR-ribotype 027, and mortality with a positive predictive value of 83.9%) for toxin detection (Table 1andFig 3). However the sensitivity and specificity for CT�25 to determine the presence of toxin in tgNAAT positive samples were 51.3% (366/713,95%CI 48–55%) and 87.5% (491/561, 95%CI 84–90%) respectively.
A CT�24 was also significantly associated with a toxin positive result and the presence of PCR-ribotype 027, with a PPV of 86.1% for toxin detection (Table 1andFig 3). Due to the slight advantage of using CT�25 over�24 as a cut-off, further analyses defined low CT as�25.
Patients with a low CT (�25) had higher mean WCC, a higher baseline mean serum creati-nine, lower mean serum albumin and longer length of stay, but these differences were not sig-nificant (except serum creatinine p = 0.04,Table 1). For patients with both a low CT and the presence of PCR-ribotype 027, mortality risk and LOS were significantly increased (Table 1). The PPV of low CT for mortality in this population was 17.4% (95% CI 13.5–22.2%); the nega-tive predicnega-tive value (NPV) of CT>25 for mortality was 88.0% (65% CI 85.0–90.5%). The rela-tive risk of mortality in CDI with low CT was 1.45 (95% CI 1.0–2.0, p = 0.04), which increased to 2.18 (95% CI 1.2–4.0p = 0.03) in cases also due to PCR-ribotype 027.
The relative risk of mortality in CDI with low CT and a positive binary toxin gene test was 1.72 (95% CI 1.1–2.8, p = 0.05), with a significant difference in mortality rates between those with versus without binary toxin gene (25.3 vs 14.7%, p = 0.049,Table 1). There was no differ-ence in the rate of toxin positive (CTA) samples between those with or without detection of the binary toxin gene (Table 1). Patients with a low CT and who were binary toxin positive had higher mean WCC, a higher mean serum creatinine lower mean serum albumin and shorter LOS; of these differences, only increased serum creatinine was significant (p = 0.006) (Table 1). Unsurprisingly, a positive binary toxin gene result was significantly associated with samples containing PCR-ribotype 027 (p<0.001).
Presumptive 027 result
[image:4.612.143.577.542.693.2]A PCR-ribotype was available for 817 NAAT positive samples; the sensitivity, specificity, PPV and NPV in this cohort for the Cepheid ‘presumptive 027 ribotype’ result were 93.5% (95% CI
Fig 2. ROCs for CT values. ROCs for CT values against a) mortality (AUROC 0.569) and b) CTA (0.83) and c) recurrence (0.557).
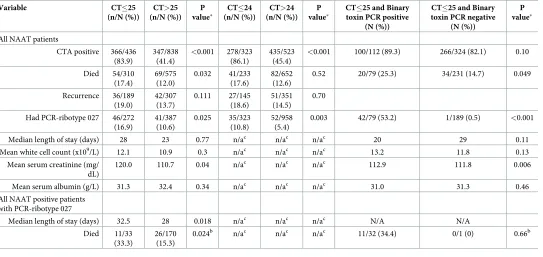
85.8–97.3), 94.6% (95% CI 92.6–96.1), 68.8% (95% CI 59.8–76.6) and 99.1% (95% CI 98.0– 99.6), respectively. Those samples that were falsely identified as containing ribotype 027 did not contain strains with ribotypes that fall within the same clade as 027 (RBT002 (n = 1), 005 (n = 1), 014 (n = 2), 015 (n = 2), 016 (n = 10, 023 (n = 9), 078 (n = 18), 140 (n = 2), 193 (n = 1), Table 1. Outcomes and severity markers for patients with CT values�25 or>25.
Variable CT�25
(n/N (%))
CT>25 (n/N (%))
P value�
CT�24 (n/N (%))
CT>24 (n/N (%))
P value�
CT�25 and Binary toxin PCR positive
(N (%))
CT�25 and Binary toxin PCR negative
(N (%))
P value�
All NAAT patients
CTA positive 366/436 (83.9) 347/838 (41.4) <0.001 278/323 (86.1) 435/523 (45.4)
<0.001 100/112 (89.3) 266/324 (82.1) 0.10
Died 54/310 (17.4) 69/575 (12.0) 0.032 41/233 (17.6) 82/652 (12.6)
0.52 20/79 (25.3) 34/231 (14.7) 0.049
Recurrence 36/189 (19.0) 42/307 (13.7) 0.111 27/145 (18.6) 51/351 (14.5) 0.70
Had PCR-ribotype 027 46/272 (16.9) 41/387 (10.6) 0.025 35/323 (10.8) 52/958 (5.4)
0.003 42/79 (53.2) 1/189 (0.5) <0.001
Median length of stay (days) 28 23 0.77 n/ac n/ac n/ac 20 29 0.11
Mean white cell count (x109/L) 12.1 10.9 0.3 n/ac n/ac n/ac 13.2 11.8 0.13
Mean serum creatinine (mg/ dL)
120.0 110.7 0.04 n/ac n/ac n/ac 112.9 111.8 0.006
Mean serum albumin (g/L) 31.3 32.4 0.34 n/ac n/ac n/ac 31.0 31.3 0.46
All NAAT positive patients with PCR-ribotype 027
Median length of stay (days) 32.5 28 0.018 n/ac n/ac n/ac N/A N/A
Died 11/33 (33.3)
26/170 (15.3)
0.024b n/ac n/ac n/ac 11/32 (34.4) 0/1 (0) 0.66b
Table showing the outcomes and severity markers for patients with CT values�25 or>25
�T-test for comparisons of means, Mann Whitney for comparisons of medians, Chi-squared for categorical comparisons. b
fishers exact probability.
c
CT�24 not investigated further as low CT defined as�5 for further analyses.
[image:5.612.142.573.499.681.2]https://doi.org/10.1371/journal.pone.0205941.t001
Fig 3. Boxplots of tgNAAT CT values. Boxplots of tgNAAT CT values against a) mortality b) CTA result and c) recurrence.
and so are not known to have the same tcdC deletion as used to presumptively identify 027 in this assay [10].
Discussion
This is the largest study to date examining the clinical utility of tgNAAT CT value to predict the diagnosis and outcomes of CDI. Importantly, this is the only study that has tested all sam-ples with both the CTA and CTC reference assays. We have shown that a low tgNAAT CT value (�25) is significantly associated with a toxin positive status, presence of PCR-ribotype 027, and mortality. Laboratory defined CDI recurrence was also associated with low CT, although this was not significant, possibly due to the low number of such cases within the data-set. The median tgNAAT CT value for patients who died was significantly lower than for those who survived (25.5 vs 27.5 p = 0.021) with a significant AUROCC for NAAT positives and mortality; 0.572 p = 0.009. In addition, the median tgNAAT CT value for a diarrhoeal sample that was (CTA) toxin positive was 24.9 compared with 31.6 for toxin negative samples (p <0.001); the AUROC here was 0.83 (p<0.001).
In order to optimise the CT cut-off we investigated both�24 and�25 cycles but found lit-tle difference between these (Table 1); a slighter higher PPV for toxin positivity using CT�24 was offset by the lack of significant association with mortality seen using CT threshold�25. We therefore used CT�25 as our ‘low CT’ threshold, which was slightly higher than found in two smaller recent studies [8,11]. One of these reported an AUROC of 0.857 when using a CT of 23.5; however, this was for a composite end-point of ‘poor outcome’ [8]. As our patient cohort was ~8-fold larger than in the previous study, we have been able to determine a signifi-cant association between low CT and single outcome measures, rather than for a composite outcome. Indeed, as the PPV of a low tgNAAT CT (�25) for toxin detection was 83.9%, it is possible that such a threshold could be used as a proxy for presumptive toxin detection, as sug-gested from a recent small study [12]. However, it is difficult to recommend tgNAAT be used as a standalone test, even with these cut-offs, as it has relatively low sensitivity and specificity for confirmation of detection of toxin gene (51% and 88%) and only moderate usefulness in the prediction of mortality (AUCROCC 0.568 and relative risk of death 1.45). Qualitative (pos-itive/negative) and higher quantitative CT values in this tgNAAT are even less predictive of toxin positivity status [3,4].
The relative risk of mortality in patients with a low CT (�25) vs a CT>25 was 1.45 which increased to 2.18 in those patients who had a low CT and had PCR-ribotype 027. Indeed, in those patients with a low CT (�25), mortality and longer LOS were also significantly associ-ated with the presence of PCR-ribotype 027, compared with other PCR-ribotypes, highlighting a possible ‘at risk’ group. There is conflicting evidence regarding the role of binary toxin in CDI outcomes [13–14]. Our data show that the relative risk for mortality in patients with low CT increased from 1.45 to 1.72 when the presence of binary toxin gene was taken into account. Patients with a low CT also had a lower serum albumin but mean WCC, higher mean serum creatinine, longer LOS were not significantly different. This was possibly due to the small sam-ple size in these subgroups. The same pattern was seen in patients with a low CT who were also binary toxin gene positive, with the exception that these had a shorter LOS than binary toxin negative subjects. This warrants further investigation in a larger, prospective study.
recurrence was associated with a low CT in our study, this was not a significant finding, possi-bly due to the low number of recurrent cases within this dataset. Risk of CDI recurrence has also previously been shown to be higher in PCR-ribotype 027 [17]. However, traditional typing methods used to identify the ribotype of a strain causing CDI require culture first and so are not timely; in this regard, a rapid ‘presumptive 027’ result could be of value. We found that the Cepheid Xpert C. diff assay has a high NPV for ‘presumptive RT027’, but does overcall the number of samples that truly contain PCR-ribotype 027 (i.e. a low PPV of 69.9%). The pres-ence of the gene target used to identify PCR-ribotype 027 by the Cepheid Xpert C. diff assay in other ribotypes related to PCR-ribotype 027 can confound the results produced by this assay [10,18].
Our study has some limitations. We performed a retrospective data analysis and had no val-idation set to test. Nevertheless, we utilised data from the largest ever study ofC.difficile diag-nostic assays [3], which contemporaneously collected CDI outcome data. Our analyses of recurrence were based on a laboratory definition (i.e. submission of more than one patient sample), which will likely miss true cases; for example, patients who did not have a new sample submission, or who were retested elsewhere [3]. Our original study was not designed to cap-ture recurrence data systematically and a full prospective study of the impact of CT value infor-mation on recurrence rates and patient management is warranted. Additionally, our data only relate to one NAAT, and so require confirmation with respect to other assays. However, there is some emerging evidence that other NAATs may have similar quantitative predictive value [19].
Developing predictive tools is a step forward, but also a challenge to patient treatment. Our study provides evidence of how quantitative tgNAAT results could augment the diagnosis and management of CDI. Low tgNAAT CT values (�25) indicate patients with more severe infec-tion and at higher risk of mortality and possibly recurrence. In those with a low CT (�25) and a presumptive RT027 result, the risk of mortality increases further. Timely diagnosis and opti-mised management may have the biggest impact in these patients.
Acknowledgments
We thank all of the sites and staff that took part in the original study; Leeds Teaching Hospi-tals, Leeds; St George’s University of London, London; University College Hospital NHS Foundation Trust, London and Oxford University Hospitals NHS Trust, Oxford.
Author Contributions
Conceptualization: Kerrie A. Davies.
Formal analysis: Kerrie A. Davies.
Methodology: Kerrie A. Davies.
Project administration: Kerrie A. Davies.
Writing – original draft: Kerrie A. Davies, Tim Planche, Mark H. Wilcox.
Writing – review & editing: Tim Planche, Mark H. Wilcox.
References
2. Crobach MJ, Planche T, Eckert C, et al. European Society of Clinical Microbiology and Infectious Dis-eases: update of the diagnostic guidance document for Clostridium difficile infection. 2016. Clinical Microbiology and Infection. Suppl 4:S63–81.
3. Planche TD, Davies KA, Coen PG, et al. Differences in outcome according to Clostridium difficile testing method: a prospective multicentre diagnostic validation study of C. difficile infection. Lancet Infect Dis 2013; 13:936–45.https://doi.org/10.1016/S1473-3099(13)70200-7PMID:24007915
4. Polage CR, Gyorke CE, Kennedy MA, Leslie JL, Chin DL, Wang S, Nguyen HH, Huang B, Tang YW, Lee LW, Kim K, Taylor S, Romano PS, Panacek EA, Goodell PB, Solnick JV and Cohen S H. Overdiag-nosis of Clostridium difficile infection in the molecular test era. 2015. JAMA Internal Medicine. Online publicationhttps://doi.org/10.1001/jamainternmed.2015.4114PMID:26348734
5. Mawer D, Byrne F, Drake S, et al. Hospital-onset diarrhoea prevalence, aetiology and management in the United Kingdom: the HOODINI study: ECCMID 2017 Vienna, Austria
6. Davies KA, Longshaw CM, Davis GL, et al. Underdiagnosis of C. difficile across Europe: the European, Multicentre, Prospective, Biannual, Point -Prevalence Study of Clostridium difficile Infection in Hospital-ised Patients With diarrhoea (EUCLID). Lancet Infect Dis. 2014; 14:1208–9.https://doi.org/10.1016/ S1473-3099(14)70991-0PMID:25455988
7. Kamboj M, Brite J, Aslam A, Kennington J, Babady NE, Calfee D, Furuya Y, Chen D, Augenbraun M, Ostrowsky B, Patel G, Mircescu M, Kak V, Tuma R, Karre TA, Fry DA, Duhaney YP, Moyer A, Mitchell D, Cantu S, Hsieh C, Warren N, Martin S, Willson J, Dickman J, Knight J, Delahanty K, Flood A, Harring-ton J, Korenstein D, Eagan J, Sepkowitz K. Artificial Differences in Clostridium difficile Infection Rates Associated with Disparity in Testing. Emerg Infect Dis 2018; 24:584–7.https://doi.org/10.3201/eid2403. 170961PMID:29460760
8. Reigadas E, Alcala´ L, Valerio M, Marı´n M, Martin A, Bouza E. Toxin B PCR cycle threshold as a predic-tor of poor outcome of Clostridium difficile infection: a derivation and validation cohort study. J Antimi-crob Chemother. 2016 May; 71(5):1380–5.https://doi.org/10.1093/jac/dkv497Epub 2016 Feb 10. PMID:26869691
9. Fawley WN, Knetsch CW, MacCannell DR, Harmanus C, Du T, Mulvey MR, Paulick A, Anderson L, Kuijper EJ, Wilcox MH. Development and validation of an internationally-standardized, high-resolution capillary gel-based electrophoresis pcr-ribotyping protocol for Clostridium difficile. PLoS One. 2015; 10 (2):e0118150.https://doi.org/10.1371/journal.pone.0118150PMID:25679978
10. Rupnik M, Avesani V, Janc M, von Eichel-Streiber C and Deleme´e M. A novel toxinotyping scheme and correlation of toxinotypes with serogroups of Clostridium difficile isolates. 1998. Journal of Clinical Microbiology. 36(8): 2240–7. PMID:9665999
11. Kamboj M, Babady NE, Marsh JW, et al. Estimating risk of C. difficile transmission from PCR positive but cytotoxin negative cases. PLoS One. 2014 Feb 11; 9(2):e88262.https://doi.org/10.1371/journal. pone.0088262eCollection 2014. PMID:24523882
12. Schenchyna F, Gaur RL, Gombar S, Truong CY, Schroeder LF and Banaei N. Clostridium difficile PCR cycle threshold predicts free toxin. 2017. Journal of Clinical Microbiology. 55(9): 2651–2660https://doi. org/10.1128/JCM.00563-17PMID:28615471
13. Reigadas E, Alcala´ L, Marı´n M, Martı´n A, Iglesias C, Bouza E. Role of binary toxin in the outcome of
Clostridium difficile infection in a non-027 ribotype setting. Epidemiology and Infection. 2016 Jan; 144
(2):268–73.https://doi.org/10.1017/S095026881500148XPMID:26119775
14. Berry CE, Davies KA, Owens DW, Wilcox MH Is there a relationship between the presence of the binary toxin genes in Clostridium difficile strains and the severity of C. difficile infection (CDI)? European Jour-nal of Clinical Microbiology and Infectious Disease. 2017 Dec; 36(12):2405–2415.
15. Debast SB, Bauer MP, Kuijper EJ; European Society of Clinical Microbiology and Infectious Diseases. European Society of Clinical Microbiology and Infectious Diseases: update of the treatment guidance document for Clostridium difficile infection. Clin Microbiol Infect. 2014 Mar; 20 Suppl 2:1–26.https://doi. org/10.1111/1469-0691.12418PMID:24118601
16. Cornely OA, Nathwani D, Ivanescu C, Odufowora-Sita O, Retsa P, Odeyemi IA. Clinical efficacy of fidaxomicin compared with vancomycin and metronidazole in Clostridium difficile infections: a meta-analysis and indirect treatment comparison. J Antimicrob Chemother. 2014 Nov; 69(11):2892–900. https://doi.org/10.1093/jac/dku261Epub 2014 Jul 28. PMID:25074856
17. Marsh JW1, Arora R, Schlackman JL, Shutt KA, Curry SR, Harrison LH. Association of relapse of
Clos-tridium difficile disease with BI/NAP1/027. 2012. Journal of Clinical Microbiology. 50:4078–82.https:// doi.org/10.1128/JCM.02291-12PMID:23052318