Contents lists available atScienceDirect
Journal of Materials Processing Tech.
journal homepage:www.elsevier.com/locate/jmatprotec
Visualisation and optimisation of shielding gas coverage during gas metal
arc welding
I. Bitharas
a,⁎, N.A. McPherson
b, W. McGhie
c, D. Roy
c, A.J. Moore
aaInstitute of Photonics and Quantum Sciences, Heriot-Watt University, Edinburgh, EH14 4AS, UK bDepartment of Mechanical and Aerospace Engineering, University of Strathclyde, Glasgow, G1 1XQ, UK cBAE Systems, Naval Ships, Glasgow, G51 4XP, UK
A R T I C L E I N F O
Keywords:
Shielding gas Schlieren Visualisation
Finite element modelling Magnetohydrodynamics FCAW-G
A B S T R A C T
The density gradients andflow characteristics of the gas shield during gas metal arc welding (GMAW) of DH36, higher strength‘construction steel’, were visualised using schlieren imaging. A systematic study was undertaken to determine the effect of shielding gasflow rate, as well as changes in the nozzle stand-offand angle, on the weld quality. The schlieren images were used to validate 2D and 3D magnetohydrodynamic (MHD)finite ele-ment models of the interaction between the Ar shielding gas, the arc and the ambient atmosphere. Weld porosity levels were determined through x-ray radiography. Sufficient shielding gas coverage was provided at a minimum of 9 l/min pure Ar, irrespective of relatively large increases in the nozzle stand-offand angle. Using 80% Ar/20% CO2shielding gas, and 86% Ar/12% CO2/2% O2shielding gas withflux cored arc welding (FCAW-G), achieved good quality welds down to 5 l/min. The introduction of 12 l/min in production welding has been implemented with no compromise in the weld quality and further reductions are feasible.
1. Introduction
Gas metal arc welding (GMAW) uses aflow of argon (Ar), carbon dioxide (CO2), or a mixture thereof, to limit chemical reactions of the molten metal with the surrounding air. The shielding gas also provides a medium for the electrical current to flow in the arc between the workpiece and the electrode. Decades of metallurgical studies (Kou, 2003) have shown that if shielding conditions are poor, then air en-trainment on the arc jet leads to weld pool or droplet contamination: unwanted reactions occur between O2and N from the air and the liquid metal including any alloying elements it contains, leading to increased spatter and large variability in the properties of welded joints. For steels, excess CO is released after solidification of the metal, forming pores. Such discontinuities in welded joints reduce the effective cross section and accumulate stresses, constituting potential crack initiation sites.
The volumetricflow-rate of the gas supply should therefore be set sufficiently high to achieve the required weld quality. A shield gasfl ow-rate of 15–20 L per minute (l/min) is often used in GMAW, but in practice welders sometimes use as much as 36 l/min. Such overuse of shield gas is wasteful, impacts negatively on the environment and can lead to turbulence induced porosity in the weld. Similarly, reducing shield gas usage is also important in the additive manufacture of metals
via directed energy deposition processes based on welding, where lo-calised trailing shield units useflow-rates as high as 195 l/min (Ding et al., 2015). Although many models of welding are reported in the literature, and shield gas coverage has been visualised by experimental techniques, there has been no systematic study reported that specifi -cally aims to optimize the shield gas usage.
The objective of this study is therefore to investigate systematically the minimumflow conditions with which to adequately shield an ac-ceptable weld using a combined experimental and modelling approach. We are specifically interested in GMAW, for which common process parameters such as the stand-offand angle of the nozzle, the voltage, current and length of the arc, and the properties of the shield gas itself all affect the quality of coverage achieved. An advantage of the com-bined experimental and modelling approach is that the sensitivity of the shield gas coverage to variations in these process parameters can also be determined in order to identify their relative importance in main-taining weld integrity.
Numerical arc modelling has been used to understand aspects of the GMAW process, however the majority of these studies focus on the behaviour of the arc core, high velocity plasma jet or droplet/weld pool dynamics: the low velocity nozzleflow and thus optimum coverage during welding has not been thoroughly examined. (Murphy et al., 2009) showed that the equations of convection-diffusion can be applied
https://doi.org/10.1016/j.jmatprotec.2017.11.048
Received 24 July 2017; Received in revised form 16 October 2017; Accepted 23 November 2017
⁎Corresponding author.
E-mail address:[email protected](I. Bitharas).
Available online 02 December 2017
to the mixing and de-mixing of metal vapour with Ar, with only a few studies employing them to model an Ar-air plasma in a GMAW context. Simulating the Ar plasma spray process, the k-εturbulence model has previously been used to model air entrainment within a high velocity Ar jet by (Williamson et al., 2003). Compared with a previous series of experimental measurements by (Fincke et al., 2003), the k-ε model adequately predicted the generalflow features, provided initial condi-tions for the turbulent kinetic energy were well posed. (Cheng and Chen, 2004) expanded the model to include the thermophysical prop-erties calculated by (Murphy, 1995). An additional diffusion coefficient to account for the jet’s turbulent behaviour enhanced the model’s pre-dictive capability for air entrainment. The key features of the model we report are therefore the interaction of the plasma jet with the low ve-locity nozzleflow, and the introduction of the convection-diffusion of air into the plasma as introduced for plasma spray processes in to a GMAW context.
Of particular relevance to this study is the combination of numerical modelling with schlieren imaging to examine the gas distribution during arc welding. Shadowgraphy has been used to visualise the effect of cross-drafts speeds on the shield gasflow profile and coverage during GMAW of mild steel, at a range of shield gasflow-rates and torch nozzle diameters (Beyer et al., 2013). The shadowgraphy revealed an em-pirical ratio of cross-draft speed to shield gas speed < 1.25 to be a re-liable indicator of acceptable weld quality independent of nozzle dia-meter, validated by radiographic measurements of the welds. A model of the shield gasflow was reported, but it did not include the plasma jet and so its predictive capability was severely limited. (Dreher et al., 2013) examined a large set of variables numerically, including aspects of the torch geometry, as well as the nozzle stand-offand angle. The model confirmed the profound influence of Lorentz forces (magnetic pinch) on the bulkflow of the shield gas, as coverage quality deterio-rated with an increase in current. Additionally, it was shown that the increased temperature at higher currents causes diffusion to play an increasingly important role in the gas dynamics. The shielding gasfl ow-rate was determined for a range of arc currents and stand-offdistances, but the calculation omitted temperature-dependent transport properties of the gas mixture; and a somewhat arbitrary O2limit of 50 ppm was imposed as a criterion for acceptable Al or Ti welds without system-atically relating that value to the weld quality achieved in practice. Our interest is in mild steel, for which (Tamaki et al., 1978) reported up to 5% air concentration (∼10,000 ppm O2) in CO2 could be tolerated without harmful porosity in the weld, partly due to the comparatively large number of alloying elements and low carbon content (Sato et al., 1993). Hence the aim of the study reported in this paper is to establish a pragmatic limit of O2concentration for GMAW of mild steel, validated against weld quality, that is consistent for a range of weld parameters. Section2of this paper describes the schlieren setup that we used to visualise GMAW under typical workshop conditions. Section 3gives details of the MHDfinite element model used to simulate the process, based on solidfiller wire and pure Ar shield gas. In Section4, we use the model to examine temperature, pressure and Ar concentration in the weld region and thus understand the refractive index gradients ob-served optically. Using a combination of experiment and simulation, parameters that influence the shield gas coverage (such as shield gas flow-rate, nozzle stand-off and angle) were varied systematically in order to determine the minimum shield gas input for which weld quality was not compromised. Thefinal weld quality was validated with x-ray radiography in order to determine a pragmatic limit of O2 con-centration for mild steel. Finally, we use the process understanding gained from solid wire and pure Ar, to perform schlieren imaging of solid wire with 80% Ar/20% CO2shield gas, andflux-cored wire with 86% Ar/12% CO2/2% O2shielding gases. Gas-shielded,flux-cored arc welding (FCAW-G) is a GMAW process that is commonly employed in industry but there are no reports of schlieren imaging or of a systematic study of the minimum shield gas levels required for this process.
2. Experimental setup
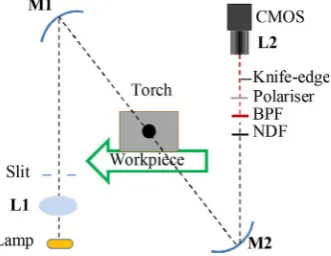
Shadowgraphy and schlieren techniques enable localised refractive index gradients to be visualised. These gradients arise in welding due to temperature and pressure gradients associated with the MHDflow and due to concentration gradients in regions where the shielding gas meets and mixes with the environment.Fig. 1shows the schlieren system used in this study. (Bitharas et al., 2016) used a version of the schlieren imaging setup reported here to study alternating Ar and He shield gas flows during gas tungsten arc welding (GTAW). In that study, high-speed schlieren imaging revealed that a stable horizontal region of He was maintained in the weld region by the denser Ar from the preceding pulse, thus increasing the weld penetration by 13% compared to welding with a pre-mixed 50% Ar/50% He shield gas.
For this study, new parabolic field mirrors M1 and M2 were in-troduced, having a larger diameter (150 mm) and the same focal length (1.27 m). A brighter light source was used (200 W tungstenfilament lamp). Finally, the high-speed camera for imaging the alternating shield gas was replaced with a monochromatic CMOS camera (Flea 3) re-cording at 150 frames per second (fps) with a resolution of 1280 × 1024 pixels, fitted with a telephoto lens (L2). The images captured at this lower frame rate have a longer exposure time than with the high-speed camera, which is suitable for the steady-state welding of long weld seams in a workshop environment.
[image:2.595.351.517.574.702.2]Other key aspects of the schlieren system remained the same. Light from the lamp was collected by a condenser lens, L1, to reduce the lamp’s spot size at the source slit and to maximise the light collection efficiency. The source slit was a 2 mm × 6 mm rectangle with the long edge vertical. The slit was placed at the focus of M1 to produce a col-limated beam that is focussed to a spot by M2 in the ideal case. In practice, the included‘Z’angles in the optical path were approximately 8° in order tofit the welding torch between the mirrors within the confines of the welding bay. This angle introduced a small amount of astigmatism in the recorded images and a small separation of the tan-gential and sagittal focus planes of M2. The image of the slit at the focus of M2 was filtered by a vertical knife-edge filter positioned midway between the tangential and sagittal focal planes. The knife-edgefilter was positioned with a micrometre stage to block 50% of the image of the source slit in the vertical (y) direction, in order to achieve a uniform measurement range. Hence camera images recorded an intensity pro-portional to the gradient of the refractive index∂n/∂x, which in turn is proportional to the density gradient∂ρ/∂x. The spectroscopic emission profile of the tungsten-halogenfilament imaged through the source slit peaked around 630 nm, whilst GMAW arcs with stainless steel have shown relatively low intensity emission in that region (Schwass et al., 2011). Therefore, a 633 nm ± 1 nm full width at half maximum band-passfilter (BPF) was used to reduce light from the arc, a polariser was used to remove glare from the workpiece, and a neutral densityfilter
(NDF) reduced the overall light intensity to an appropriate level for the camera.
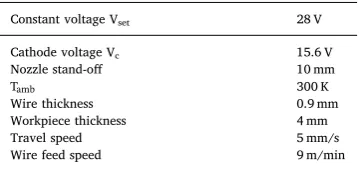
The automated welding setup incorporated a typical shipbuilding production unit, comprising a stationary Binzel straight neck torch with a 16 mm diameter nozzle, connected to a transformer-based Kempii welder and inert gas supply. The welding torch remained stationary whilst the workpiece was moved on a translation stage beneath it, en-abling the schlieren system to remain static. The workpieces were 4 mm thick plates of DH36 grade mild steel, which were ground prior to welding to remove primer and expose the surface grain. An 80 mm long weld bead was deposited on to the workpiece that moved with a con-stant travel speed of 5 mm/s. Other default weld parameters are shown inTable 1. From this default setup, the gasflow was imaged for welds carried out under variation inflow-rate (6–15 l/min), nozzle stand-off (10–20 mm) and angle (0°–20°−). An electronicflow meter was used at the nozzle’s end, with a measurement accuracy of ± 1 l/min. In-dependent radiographic examination of all welded plates was carried out to determine the presence of porosity.
3. MHD model
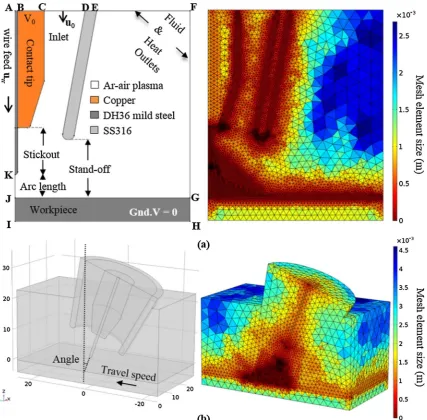
As discussed in the introduction, the generic physics governing the MHD effect in welding arcs are well utilised and established. However, appropriate geometric assumptions can be made to simplify and for-mulate the equations so that they are solved efficiently and accurately. Fig. 2(a) shows the geometry, modelled in COMSOL multiphysics software, comprising a 2D axisymmetric plane that is rotated about the centre of thefiller wire. The geometry was partitioned to form a grid of Lagrangian triangles with varying size. A convergence study showed that a minimum size of the order ∼0.1 mm around the arc region provided acceptable accuracy and convergence time. The complete mesh comprised∼12,400 domain elements and∼670 boundary ele-ments, yielding a model that required∼5GB of RAM and converged in
∼20 min on a Hewlett-Packard Z420 Workstation. To incorporate variations in the nozzle angle, a 3D half symmetry model was also produced, Fig. 2(b). It comprised ∼206,600 domain elements and 12,700 edge elements and required∼45GB of RAM and∼6 h to con-verge.
It has been shown that the largest turbulence levels in the shield gas coincide with the highest current in the GMAW arc cycle when the Lorentz forces are at their maximum (Dreher et al., 2013). Therefore, we assume that the largest degree of entrainment of air into the plasma and workpiece occurs at this condition, and used a time-independent formulation of the conservation equations (described in the following section) corresponding to a steady-stateflow at the maximum current and voltage condition. An arc length of 5 mm was assumed, which is representative of the high current and voltage phase of the arc cycle. The melt pool was excluded from the models on the assumption that the shape of its molten surface has a relatively small effect on the shield gas flow. Finally, the effect of Fe vapour in the plasma was not included in our models. Fe vapour has a noticeable effect on the plasma, typically reducing its peak temperature from ∼20 kK to ∼16 kK. As a con-sequence of overestimating the plasma temperature, our models will overestimate the conductivity and hence overestimate the current and
Lorenz force. An increased Lorenz force increases air entrainment into the plasma and therefore provides an underestimate of the shielding condition achieved. A conservative estimate of the shielding condition aligns with the aim of this systematic study to minimize shield gas usage.
The models assumed afiller wire made of mild steel and shielding of pure Ar surrounded by air of a standard composition (20.95% O2). A copper contact tip and stainless steel nozzle, with geometries modelled to match those used experimentally, were included in the computa-tional domain. The material properties for mild steel were taken from (Hu and Tsai, 2007), for stainless steel from (Kim, 1975) and those of copper were taken from (Gale and Totemeier, 2003). The plasma, treated as a multicomponent gas with a distributed mass fraction, was assumed to be in local thermodynamic equilibrium (LTE), indicating that electrons have the same temperature with heavy particles. (Valensi et al., 2010) experimentally validated the LTE assumption for GMAW, which enables the use of a single temperature variable for all species in the gas mixture. Consequently, the plasma’s thermophysical properties (density, heat capacity, viscosity, thermal and electrical conductivity) were expressed as a function of temperature for the range of 300–30,000 K as well as the mass fraction of air. Such data have been generated through the Chapman-Enskog method (Murphy, 1995), but including some recently updated collision integrals for the Ar and N species, as presented in (Murphy and Tam, 2014) and (Murphy, 2012), respectively.
The non-linear partial differential equations describing theflow and the boundary conditions are given in the following two sections. These equations were solved using a combination of the double dogleg and Newton–Raphson solvers. The input values used in the model were the default welding parameters shown inTable 1.
3.1. General equations
The partial differential equations (PDEs) used in the model are given below using vector notation. Vectors are represented in bold while properties used as a function of temperature and mass fraction are in italics. For fluid flow, the compressible Navier-Stokes equations for momentum(1)and mass(2)conservation were used:
∇ = ∇ − + ∇ + ∇ + × +
u u u
ρ( · u) ·[ p μ( ( ) )]T B J ρg (1)
∇·(ρu)=0 (2)
The two body force terms on the right-hand side of(1)represent the effect of the Lorentz forces and gravity, respectively. In order to better capture the turbulence due to the plasma jet but also to expand the stable solution space of the model, the two equation k-ε model was utilised to complement the Navier-Stokes equations. To describe the electricfield, current continuity was used while a gauged version of Ampere’s law was employed for the self-induced magneticfield.
∇·J=0 (3)
⎜ ⎟
∇ × ⎛ ⎝
∇ × ⎞
⎠
=J+ ∇
1
μ0 A Ψ (4)
Ψ(r) = 1 is the arbitrary scalar Coulomb gauge function whose value has no effect on physical observables since only its derivative is used. By including the Coulomb gaugefixing condition,
∇·A=0 (5)
the electric and magneticfields remain unchanged but the magnetic field is uniquely defined. The current density is then given by Ohm’s law, while the magneticflux densityBand electricfieldEare defined in terms of their respective potentials:
= − ∇σ
J V (6)
= ∇ ×
[image:3.595.74.254.79.165.2]B A (7)
Table 1
Welding parameters.
Constant voltage Vset 28 V
Cathode voltage Vc 15.6 V
Nozzle stand-off 10 mm
Tamb 300 K
= −∇
E V (8)
For the arc thermodynamics, an energy balance was used to account for conductive, convective and radiative heat transfer. The effects of re-sistive and thermoelectric heating were added as source terms, in-dicated by the second and third term in the right-hand side of Eq.(9). Thefinal term of Eq.(9)was only solved within the gas domain, ac-counting for the total radiative loss from the plasma (Boulos et al., 1994). The values utilised for the radiative emission coefficientεNwere
also input as a function of both temperature and mass fraction.
∇ = ∇ ∇ + + ∇ −
ρc (u· T) ·(k T) J E· 5k J ε
2e · T 4π
p b N
(9) To convey movement in the steady-state models, a moving reference frame was used. In the 2D and 3D model, the specified axial velocity in the wire domain was that of the wire feed speed, yielding an equivalent convectiveflux. Similarly, for the workpiece domain in the 3D confi g-uration, the travel speed was specified as the equivalent horizontal convective motion. No convection term was used for the workpiece in the 2D configuration, where movement cannot be conveyed. Results from the model, as well as the cited literature, have shown that the plasma jet is five orders of magnitude faster (∼100 m/s) and the shielding gasflow (∼m/s) is three orders of magnitude faster than the
travel speed (∼mm/s). It is therefore reasonable to assume that the movement of the torch has negligible effect on the coverage. This as-sumption has been validated by comparing the output from the 2D axisymmetric model, where travel speed cannot be included, with that from the 3D model, for the same geometry but incorporating the movement of the workpiece, and showing that the calculatedfluidflow and coverage are equivalent.
In order to evaluate the quality of gas coverage, the mixing and de-mixing of the shield gas with the air may be modelled so as to estimate the amount of environmental contaminants entrained in the plasma jet. Therefore, an additional set of conservation equations were added to model the convective and diffusive modes of transport of the gases present during the process: Ar and air. The mass fraction of the i-th constituentωiis given by
⎜ ⎟
− ∇ ⎛ ⎝
∇ + ∇ + ∇ ⎞
⎠
+ ∇ =
ρD ρ D D ρu
· ω ω M
M
T
T ( · )ω 0,
io i i io n iT n
i
(10) whereDio is the ordinary diffusion coefficient andD
iT is the thermal diffusion coefficient (Murphy, 2014) while Mnis the sum of the molar masses of all the constituents. Eq.(10)was solved for speciesω2(air) and the remaining mass was assigned to speciesω1(Ar). An additional contribution to the diffusion coefficient of each species was added to
account for turbulent mixing of small eddies. = D μ Sc , iT T T (11)
whereμTis the Reynolds-averaged turbulent kinematic viscosity and ScTis the turbulent Schmidt number. A value of ScT= 0.2 was used, as it has shown the best agreement with experimental results for mixing in jets (He et al., 1999).
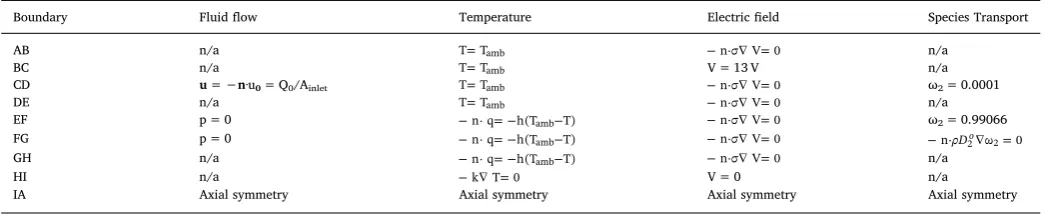
3.2. Boundary conditions
The conditions applied to the external boundaries of the geometry (labelled inFig. 2) are summarised inTable 2. At the rounded wire tip, a Neumann condition was imposed on Eq. (9), to describe heat dis-sipation due to thermionic heating in the plasma sheath.
= J
q | | Φa (12)
Additionally, to aid convergence at low temperatures, the thin layer method as used by (Hu and Tsai, 2007) was used at the wire tip boundary to model enhanced heat transfer due to local charge accu-mulation. A layer thickness of 0.1 mm was specified, over which the minimum thermal conductivity was that of plasma, defined as
= ⎧ ⎨ ⎩
≤ >
k k k
k k k
k(T,ω ) (T , ω ), (T,ω ) (T , ω ) (T,ω ), (T,ω ) (T , ω ) 1
0 1 1 0 1
1 1 0 1 (13)
Giving a rough measure of the energy available within the plasma sheath, T0= 10,000 K was used. Adding further to the energy balance (9), a heatflux described by Eq.(14)was set at the top surface of the workpiece, using Vcas the surface voltage due to the metastable state excitation in the non-thermionic cathode, as discussed by (Lowke and Tanaka, 2008).
= J V−
q | |( c Φ )c (14)
To model the energy losses in the solid regions due to radiation, a greybody radiationflux was prescribed to all internal solid-to-plasma interfaces, given by the Stefan-Boltzmann law
= −ε
q σT .4 (15)
At the inlet, the prescribed turbulent intensity It0and length scale Lt0 were defined as
= Re−
It0 0.16 1
8 (16)
=
Lt0 0.07D (17)
D is the hydraulic diameter of the nozzle at the height of the contact tip, which was also used as the characteristic length of the Reynolds number in(16). To model the effect of the moving workpiece in the 3D geometry, the horizontal velocity component of the no-slip boundary condition was set equal to the travel speed on the workpiece surface. Finally, all the magneticfield vectors were set to 0 across all boundaries by imposing
× =
n A 0. (18)
4. Results
This section contains a comparison between the experimental and numerical results for the case of solid wire and an Ar shielding gas, for which appropriate diffusion data are available for the model. The de-fault welding conditions are shown in Table 1, around which the shielding gasflow-rate, the nozzle stand-offand the nozzle angle were systematically varied as described in the following three sections.
4.1. Variation in shielding gasflow-rate
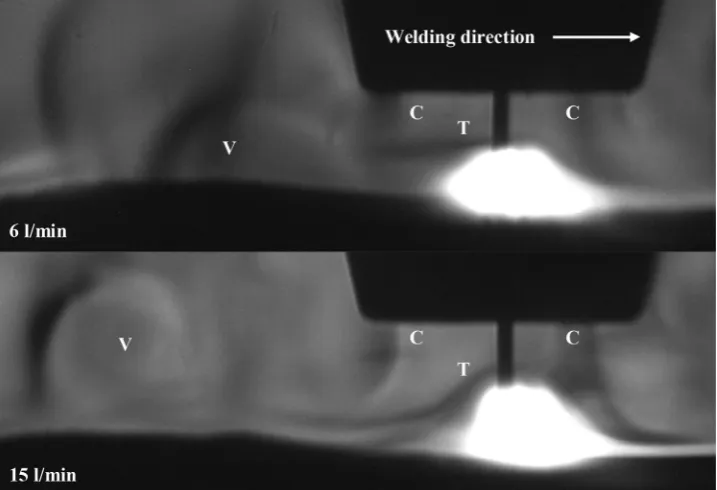
Keeping all other welding parameters as shown in Table 1, the shielding gasflow-rate was varied in the range Q0= 6–15 l/min.Fig. 3 shows the refractive index gradients in the horizontal direction∂n/∂r recorded by schlieren imaging for the two extremeflow-rates. These images are taken from videos which are available for all theflow-rates tested (6, 9, 12 and 15 l/min) in the additional material accompanying this paper. The refractive index gradients are primarily due to varia-tions in temperature, pressure and gas concentration averaged through the measurement region. Although the interdependence of these three parameters makes it difficult to draw quantitative data directly from the schlieren images, they reveal a great deal of qualitative information regarding theflow. The steady state vortex (marked V in the images) is established further behind the torch at higherflow-rates due to the increased momentum of the shielding gas from the nozzle. A dark, bell-shaped line marked T is visible in both images, primarily due to steep temperature gradients around the arc. Below the nozzle sidewalls, vertical lines marked C indicate the concentration and temperature gradients at the interface between the shielding gas and the sur-rounding air. An increase in air mass fraction under the nozzle, and hence poorer shielding performance, is indicated for 6 l/min by the blurriness and recessed position of the C lines due to a greater degree of gas intermixing and the increased separation of the T line from the plate surface.
The DH36 bead-on-plate samples produced at eachflow-rate were inspected in order to determine the weld quality.Fig. 4shows that a 6 l/ min shield resulted in clear porosity in the cross-section (top row), x-ray image (middle row) and visual inspection of the weld seam (bottom row). Flow rates of 9 l/min or greater consistently produced welds which satisfied specification requirements for presence of porosity: in effect the welds were free of porosity. Weld hardness measurements showed no significant differences from welds produced under higher gasflow conditions.
Although it is difficult to extract the temperature, pressure and gas concentration quantitatively from the schlieren images, it is straight-forward to use the values calculated from the numerical model and to plot the ∂ρ/∂r density gradient to produce an “artificial schlieren”
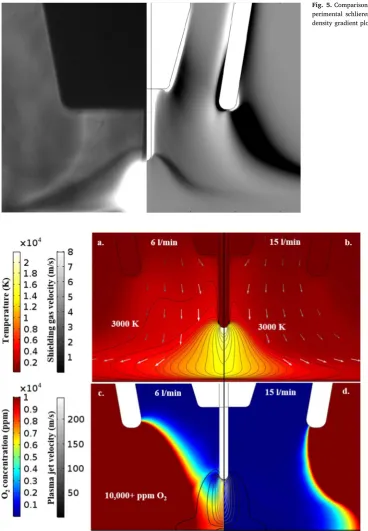
[image:5.595.37.561.80.187.2]image.Fig. 5shows a direct comparison between an experimental and an artificial schlieren image. The model successfully portrays the ob-served∂n/∂rfeatures, which indicates that the underlying temperature, pressure and concentration gradients are computed with acceptable accuracy to describe the main features of theflow.
Table 2
External boundary conditions.
Boundary Fluidflow Temperature Electricfield Species Transport
AB n/a T=Tamb − ⋅ ∇n σ V=0 n/a
BC n/a T=Tamb V = 13 V n/a
CD u =−n·u0= Q0/Ainlet T=Tamb − ⋅ ∇n σ V=0 ω2= 0.0001
DE n/a T=Tamb − ⋅ ∇n σ V=0 n/a
EF p = 0 −n· q= −h(Tamb−T) − ⋅ ∇n σ V=0 ω2= 0.99066
FG p = 0 −n· q= −h(Tamb−T) − ⋅ ∇n σ V=0 − ⋅nρD2o∇ω2=0
GH n/a −n· q= −h(Tamb−T) − ⋅ ∇n σ V=0 n/a
HI n/a − ∇ =k T 0 V = 0 n/a
The top row ofFig. 6compares the temperature calculated from the numerical model at the two extreme shielding gas flow-rates. The characteristic bell shape of the GMAW arc is clearly seen. Superimposed on the plots are isothermal contours plotted in 1000 K intervals, and vectors that are coloured and scaled proportionally to thefluid’s velo-city, but truncated to 8 m/s to show the relatively low velocities char-acteristic of the shielding gasflow. Increasing theflow of gas from the nozzle has a mild cooling effect in the atmosphere under the nozzle: the 6 l/min case results in higher temperatures than those with 15 l/min. For the 6 l/min case, thefluid has lower momentum when exiting the nozzle, indicated by∼50% lower bulkflow velocities compared to the 15 l/min case. The convective heat transfer at 6 l/min is therefore weaker, as shown by the higher position of the 3000 K isotherm, which is indicated in thefigure for both flow-rates. Conversely, the higher velocities at 15 l/min suggest that a larger fraction of the heat around
the around the arc is convected downwards, adding more heat to the workpiece. This effect is seen in the cross-sections of Fig. 4, where penetration is deeper and the heat affected zone is wider (boundaries out of image) at 9 l/min compared to 6 l/min. These observations suggest that distortion can be reduced at lower shielding gasflow rates. The bottom row ofFig. 6 shows contours of the fluid velocities above 10 m/s, which are characteristic of the high velocity plasma jet. Thefluid is accelerated inwards towards the regions of higher current and magneticfield at the wire tip due to Lorentz forces (the pinch ef-fect). The difference in the plasma jet velocity between the two shielding gas flow-rates is negligible. The bottom row ofFig. 6 also shows the O2concentration in parts per million (ppm) with the scale truncated at 10,000 ppm, which corresponds to the∼5% of O2found in atmospheric air. It can be seen that air entrainment is severe in the 6 l/ min case as a large mass fraction of O2is present in that area under the nozzle. In contrast, 15 l/min provides an inert atmosphere with only trace amounts of O2. The reduced downwards momentum of theflow at 6 l/min compromises the flow’s capability to resist the inwards pull effect of the pinch effect. These numerical results show that as the total momentum of Ar exiting the nozzle increases, the net outwardsflow is stronger, while the pinch of the arc remains the same. As a result, the boundary after which O2 content increases exponentially is pushed outwards, away from thefiller wire and melt pool. Consequently, re-sistance to air entrainment and coverage area increase with input flowrate.
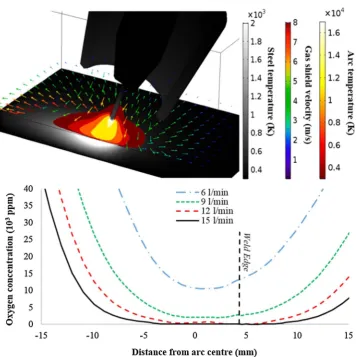
[image:6.595.39.398.57.302.2]The effect of the total momentum carried by theflow contributing to resist air entrainment can be quantified by determining the area over which O2levels are low. For the range of inputflow-rates of interest, the calculated O2concentration at the surface of the workpiece was plotted against radial distance, r, from the centre of the filler wire, Fig. 7. The concentrations at r < 4 mm at the edge of the weld seam are indicative of the amount of O2available to react with the molten metal.Fig. 7 shows thatflow-rates greater than 12 l/min effectively resulted in the same coverage, while for 9 l/min the quality was only somewhat diminished. It is clear that for 6 l/min the O2 levels are disproportionately elevated, suggesting an air-rich atmosphere, as seen already inFig. 6(c). The weld seam inspection ofFig. 4showed that all welds at 9 l/min were of acceptable quality, indicating that an O2 concentration in the range of approximately 2000–13,000 ppm at the edge of the weld seam might be used as an estimate of the threshold for
Fig. 3.Schlieren frames under low (top) and high (bottom) shielding gasflow-rates. The steady state vortex (V) behind the torch, a bell-shaped line (T) primarily due to steep temperature gradients around the arc, and vertical lines below the nozzle sidewalls (C) due to concentration and temperature gradients at the interface between the shielding gas and the surrounding air, are visible in both cases.
[image:6.595.40.354.61.513.2] [image:6.595.43.285.322.517.2]sufficient shielding in other configurations of the model.
4.2. Variation in nozzle stand-offdistance
Fig. 8shows time-averaged schlieren images made from the image sequences at increasing nozzle stand-distances. Each image was pro-duced by averaging 250 frames (equivalent to an exposure of 1.2 s), taken after the arc had stabilised. This process emphasizes the sta-tionaryflow features around the torch and is consistent with the time-independent numerical model. These videos are available in the sup-plementary material. As the stand-offincreased, an inward contraction in the gas shield was noted due to loss of momentum in theflow as the distance travelled increases, but there was no decrease in the visibility
of the schlieren gradients at the nozzle edges. These results indicate that the shielding performance was maintained with increased stand-offand that the important parameter was the shield gas flow-rate. This ob-servation was confirmed with radiography measurements on the welds: all the welds at 9 + l/min were acceptable while all the welds at 6 l/ min were again unacceptable. Increased nozzle stand-offhad no effect on the weld seam porosity for the range of stand-offdistances tested.
[image:7.595.36.405.54.586.2]Fig. 9(top) shows the calculated O2 concentration and the tem-perature distribution and low flow velocities associated with the shielding gas, respectively for a 9 l/minflow-rate and at 20 mm stand-off. In practice, it is well known that holding the torch further away from the workpiece results in reduced penetration due to a lower arc current (Lancaster, 1986), a trend we observed experimentally and in
Fig. 5.Comparison between shielding gas visualisation through an ex-perimental schlieren image (left hand side) and numerically calculated density gradient plot (right hand side), at 12 l/minflow-rate.
Fig. 6.Simulated temperatures (top) and O2
the model. This reduced current at increased stand-offproduces a lower peak temperature and reduces the inward pull of the surrounding at-mosphere due to the arc. Through this effect, an increase of up to 200% in stand-off was found to be “auto-compensated” in terms of the shielding gas coverage. Fig. 9(bottom) shows the calculated O2 con-centration at the workpiece surface for each shield gas flow-rate at 20 mm stand-off. Comparing the O2concentrations at the edge of the weld seam for the 9 and 6 l/min cases (good and bad welds respec-tively) indicates that the estimate of the threshold for sufficient shielding for the model is in the range 11,000–33,000 ppm.
[image:8.595.323.541.50.378.2]4.3. Variation in nozzle angle
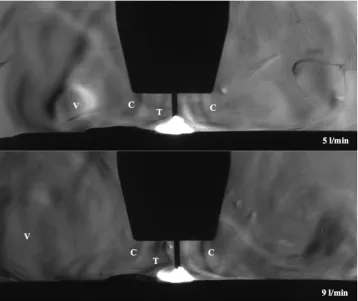
Fig. 10shows time-averaged images recorded from the schlieren video sequences at increasing nozzle angles to the vertical for the lowest shielding gas flow-rates tested (6 and 9 l/min). The standard stand-offof 10 mm was maintained at the centre of the nozzle. These videos are available in the supplementary material. As the angle in-creased there is an obvious asymmetry in the shield gas coverage, but there was no decrease in the visibility of the schlieren gradients at the nozzle edges. However, a clear decrease in visibility of the schlieren lines was again noted at 6 l/min. These results indicate that the shielding performance was maintained with increased angle and that the important parameter was again the shield gasflow-rate. This ob-servation was confirmed with radiography measurements on the welds: all the welds at 9 l/min were acceptable while all the welds 6 l/min were again unacceptable. Increased nozzle angle had no effect on the weld seam porosity for the range of angles tested.
[image:8.595.81.249.56.211.2]Changes in nozzle angle break the 2D axial symmetry and require the 3D numerical model to examine the O2concentration.Fig. 11(top) shows a composite result from the 3D model for the arc and steel temperature distributions and the low flow velocities associated with the shielding gas for a 15 l/min flow-rate and a nozzle angle of 20°. Fig. 11 (bottom) shows the calculated O2 concentration at the
workpiece surface for each shield gasflow-rate at the 20° nozzle angle. The zero position is taken at the intersection of the centre of thefiller wire with the workpiece surface. Comparing the O2concentrations at 4 mm behind this position for the 9 and 6 l/min cases (good and bad welds respectively) indicates an estimate of the threshold for sufficient shielding for the model of approximately 5000–19,000 ppm. The 4 mm distance was chosen for consistency with the 2D model.Fig. 11shows that the O2threshold was higher behind the weld than in front of it; it was also higher behind the weld than the threshold observed at the weld edges.
5. Discussion
Schlieren imaging was used to understand the shielding gas cov-erage at different stand-offdistances and nozzle angles for a range of gasflow-rates. The visibility of the schlieren C lines associated with the
Fig. 7.Calculated O2concentration at workpiece surface for 10 mm stand-offand at
different shielding gasflow-rates.
Fig. 8.Time-average schlieren images at different nozzle stand-offdistances and 9 l/minflow-rate.
Fig. 9.Numerical results for 20 mm stand-offand a 9 l/minflow-rate. Top: O2
con-centration and the temperature distribution and lowflow velocities associated with the shielding gas (arrows scaled as in Fig. 6). Bottom: Calculated O2 concentration at
[image:8.595.83.514.616.730.2]flow from the nozzle was significantly reduced at 6 l/min, which cor-responded to unacceptable weld porosity. Atflow-rates of 9 l/min and above, these schlieren lines had increased visibility and the weld por-osity was acceptable irrespective of the nozzle stand-offor angle in the range tested. However, it was not feasible to quantify the shielding
[image:9.595.83.512.56.285.2]using the schlieren images alone because these lines are formed due to both concentration and temperature gradients. The difference in re-fractive index between pure Ar and air at ambient temperature is of the order of 10−4 which would require a very sensitive schlieren mea-surement to resolve. The schlieren system was configured for low
Fig. 10.Time-average schlieren images different nozzle angles and shielding gasflow-rates.
Fig. 11.3D simulation results, with torch tilted at 20°: (Top) arc temperature, gas shield velocity vec-tors and workpiece/wire temperatures for a 190 A, 28 V GMAW arc. (Bottom) Calculated O2
concentra-tion at workpiece surface at different shielding gas
[image:9.595.42.400.308.667.2]sensitivity and a large measuring range, discussed in detail in (Settles, 2001), indicating locally elevated temperatures at theflow edges. This behaviour was also observed from the numerical model due to the convective cooling effect from the bulk flow: at lower shielding gas flow-rates the temperature gradients were smaller which contributed to the reduced visibility and blurring of the schlieren lines.
The power of the combined approach lies in using the schlieren imaging to visualise and understand the shielding gasflow and to va-lidate the numerical model, and using the model to gain insight into the effect of various physical parameters on the process. The 2D and 3D models of theflow-rates, nozzle stand-offand nozzle angle provided a satisfyingly consistent result. Radiography measurements indicated that all the welds at 6 l/min were unacceptable while all the welds at 9 l/ min or above were acceptable, irrespective of the nozzle stand-offor angle in the range tested. The O2concentration ranges predicted by the model for 6 and 9 l/min at r = 4 mm from the nozzle centre was con-sistent between the three cases, indicating that the main features of the interaction between the shielding gas and plasma jet flows was suc-cessfully captured by the time-independent model. Furthermore, the highest concentration at 6 l/min of 11,000 ppm (for stand-offof 20 mm) and the lowest concentration at 9 l/min of 13,000 ppm (for 10 mm stand-off) indicates an approximate threshold of 12,000 ppm can be used in the model. Clearly this value is not absolute for physical welding due to the necessary assumptions and simplifications used in the model. Besides, it is not possible to measure the absolute value accurately during physical welding and the tolerance to porosity will depend on the particular application of the welded component. However, the important point is that this threshold is pragmatic and related to failure criteria in ship building, rather than 50 ppm (Dreher et al., 2013) which is a limit more usually used for material processing in a sealed chamber. It is consistent with other studies in a welding context where a few thousand ppm has been shown to leave minimal porosity in Ti-6Al–4 V (Ding et al., 2015) and steel (Tamaki et al., 1978). We are currently extending this approach tofillet welding and directed energy deposition additive manufacturing (or wire-arc
additive manufacturing, WAAM), which will be reported elsewhere. For the application of interest in this paper, namely minimising the shielding gasflow-rate in GMAW, the results indicate that adequate shielding can be accomplished withflow-rates as low as 9 l/min in the absence of cross-drafts. Further experiments were undertaken on other filler wires and shield gases that are of industrial interest. These in-cluded: mild steelfiller wire with (a) 80% Ar/20% CO2shielding gas and (b)flux core filler wire with 86% Ar/12% CO2/2% O2shielding gas. These cases were not modelled due to the added complexity and change in properties associated with the inclusion offlux and multi-component gas mixtures in the simulation. (Schnick et al., 2011) showed that the inclusion of 18% CO2in the Ar shielding gas led to marked increases in the arc temperature and plasma jet velocity. This increase was attributed to the higher heat capacity, and electrical and thermal conductivity of CO2 compared to Ar. GMAW simulations by (Ogino et al., 2016) suggested that adding 18% CO2can increase the maximum temperature by∼16% but also affect the droplet formation process, requiring∼22% higher current to transition from globular to spray transfer. (Jonsson et al., 1995) found that the addition of up to 5% O2to the gas mixture has almost no influence of the arc’s properties. However, (Onsoien et al., 1995) showed that up to 2–3% volumetric content of O2in the gas can result in optimised microstructures in HSLA steels, due to higher fractions of acicular ferrite in the weld’s micro-structure.
The schlieren imaging proved extremely useful in these more complex cases.Fig. 12shows typical results forflux corefiller wire with 12% CO2/2% O2which we believe to be thefirst reported schlieren imaging for gas shielded,flux cored arc welding (FCAW-G). These vi-deos are available in the supplementary material. As seen previously, the bulkflow gradients are blurrier for 5 l/min compared to those of 9 l/min, suggesting less intermixing in the latter case. The‘T’gradient over the arc appearsflatter and the arc itself was consistently shorter and wider. Increased fume levels were observed compared to the pure Ar GMAW videos. Radiography revealed acceptable quality of the FCAW-G welds, even down to 5 l/min for the full range of nozzle
stand-Fig. 12.Schlieren images of FCAW-G using 1.2 mm
flux core wire and 86% Ar/12% CO2/2% O2gas
mixture, stand-off 10 mm. The temperature and concentration gradients, as well as the steady-state vortex trailing the torch are labelled‘T’,’C’and‘V’
[image:10.595.39.398.56.357.2]offs and nozzle angles used previously. The improved shielding is due to reactions between elements contained in theflux and the remaining O2 and N from the environment that were not excluded by the shield gas, before they could be absorbed by the steel.
Inspection of the welds with solid wire and 80% Ar/20% CO2 in-dicted that they were also acceptable down to 6 l/min for the full range of nozzle stand-offs and nozzle angles used previously. Compared to pure Ar, the extra CO2content helps to prevent porosity due to diff er-ences in surface chemistry (Ebrahimnia et al., 2009). Using such shielding gas mixtures generally increases the “effective absorptive capacity”of the system, enhancing the tolerance for excess N and O2. These results supported the introduction offlow controllers pre-set at 12 l/min in production welding at BAE Systems Govan shipyard with no compromise in the weld quality. They indicate that further shield gas savings could be achieved and represent a considerable reduction in cost, usually specified for production GMAW and at the same time re-ducing the carbon footprint whilst maintaining weld integrity, in terms of mechanical properties, hardness and freedom from weld defects.
In a similar way, the model can be used to investigate the effect of varying physical parameters that are difficult or too time-consuming to implement experimentally. As noted above, thefluctuations in the arc’s length, voltage and current throughout the phases of the arc, as vi-sualised through high-speed imaging by (Wilhelm et al., 2010), are not captured in the steady state model. Therefore, an arc length of 5 mm was used throughout Section4, representative of the high current and voltage phase when the Lorentz forces (and thus turbulence levels and entrainment) are at their maximum. However, the exact arc length and current of each phase depends on the inductance regulation of the
power supply and the many ways in which it can be adjusted, resulting in large variability between welding machines or operators using dif-ferent settings.
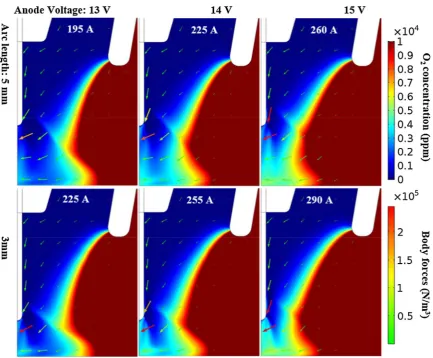
[image:11.595.82.516.51.409.2]To characterise the effect of such dynamics on the resulting en-trainment of air, the steady state O2 concentration profiles with in-creasing arc current at 5 mm and 3 mm arc length are plotted on Fig. 13. The O2 concentration plots show the profound effect of arc current on air entrainment. At low currents, a small centralised air vortex retains a few thousands of ppm of entrained air at most, which dissipate before reaching the workpiece.Fig. 13shows that the reduced arc length does not significantly increase the entrainment of air, despite the associated 30 A current increase. The inwards electromagnetic pinch of the shield gas intensifies with increasing arc current, shown by the body force vectors, and progressively higher air mass fractions are present in the plasma jet and bulkflow. The∼5000 ppm predicted at 260 A is under the 12,000 ppm threshold established in Section4, in-dicating sound welds may be produced at the reducedflowrates even with relatively higher currents and spray transfer. However, the model predicted that a rise in current by 33% incurred an increase in the total air stagnating at the workpiece by 250%. This suggests that when op-erating at very high currents with specialised waveforms, a small in-crease in the shielding gasflow rate might be warranted to compensate for the stronger electromagnetic pinch.
6. Conclusions
A detailed experimental and computational analysis of the GMAW process allowed characterisation of the conditions under which a weld
Fig. 13.O2concentration with body force vectors (sized on logarithmic scale, 3 orders of magnitude) for various currents, determined from the anode voltage and arc length, 10 mm
was adequately shielded. The MHD model was validated against the schlieren images and shown to calculate the underlying temperature, pressure and concentration gradients with acceptable accuracy to de-scribe the main features of theflow. X-ray radiography results allowed systematic characterisation of the porosity levels in the welds, from which realistic O2concentrations levels for the process could be de-termined from the model.
•
In the absence of cross-drafts, 9 l/min or greater provided sufficient coverage irrespective of increases in the nozzle stand-offto 20 mm and nozzle angle to 20°.•
The model provided physical insight into the welding behaviour observed, for example the auto-compensation of coverage at in-creased stand-offdue the reduced current, the general benefit of operating at lower currents and the reduced temperature of the workpiece due to convective heat transfer at lowerflow rates po-tentially reducing distortion.•
The pragmatic O2concentration threshold of∼12,000 ppm in the model for DH36 mild steel was consistent for the range of shield gas flow rates and nozzle stand-offand angles investigated.•
Experiments using FCAW-G with 86% Ar/12% CO2/2% O2shield gas indicate that good quality bead-on-plate welds can be deposited withflow-rates as low as 5 l/min.Acknowledgements
This work was supported by the Engineering and Physical Sciences Research Council (Grant numbers EP/G037523/1 and EP/K030884/1) and BAE systems.
Appendix A. Supplementary data
Supplementary data associated with this article can be found, in the online version, athttps://doi.org/10.1016/j.jmatprotec.2017.11.048.
References
Beyer, V., Campbell, S.W., Ramsey, G.M., Galloway, A.M., Moore, A.J., McPherson, N.A., 2013. Systematic study of effect of cross-drafts and nozzle diameter on shield gas coverage in MIG welding. Sci. Technol. Weld. Join. 18, 652–660.http://dx.doi.org/ 10.1179/1362171813Y.0000000143.
Bitharas, I., Campbell, S.W., Galloway, A.M., McPherson, N.A., Moore, A.J., 2016. Visualisation of alternating shielding gasflow in GTAW. Mater. Des. 91, 424–431.
http://dx.doi.org/10.1016/j.matdes.2015.11.085.
Boulos, I., Fauchais, P., Pfender, E., 1994. Thermal Plasmas. Springer.
Cheng, K., Chen, X., 2004. Prediction of the entrainment of ambient air into a turbulent argon plasma jet using a turbulence-enhanced combined-diffusion-coefficient method. Int. J. Heat Mass Transf. 47, 5139–5148.http://dx.doi.org/10.1016/j. ijheatmasstransfer.2004.06.028.
Ding, J., Colegrove, P., Martina, F., Williams, S., Wiktorowicz, R., Palt, M.R., 2015. Development of a laminarflow local shielding device for wire+arc additive manu-facture. J. Mater. Process. Technol. 226, 99–105.http://dx.doi.org/10.1016/j. jmatprotec.2015.07.005.
Dreher, M., Füssel, U., Rose, S., Häßler, M., Hertel, M., Schnick, M., 2013. Methods and results concerning the shielding gasflow in GMAW. Weld. World 57, 391–410.
http://dx.doi.org/10.1007/s40194-013-0038-2.
Ebrahimnia, M., Goodarzi, M., Nouri, M., Sheikhi, M., 2009. Study of the effect of shielding gas composition on the mechanical weld properties of steel ST 37-2 in gas
metal arc welding. Mater. Des. 30, 3891–3895.http://dx.doi.org/10.1016/j.matdes. 2009.03.031.
Fincke, J.R., Crawford, D.M., Snyder, S.C., Swank, W.D., Haggard, D.C., Williamson, R.L., 2003. Entrainment in high-velocity, high-temperature plasma jets. Part I: experi-mental results. Int. J. Heat Mass Transf. 46, 4201–4213.http://dx.doi.org/10.1016/ S0017-9310(03)00272-2.
Gale, W.F., Totemeier, T.C., 2003. Smithells Metals Reference Book. Butterworth-Heinemann.
He, G., Guo, Y., Hsu, A.T., 1999. The effect of Schmidt number on turbulent scalar mixing in a jet-in-crossflow. Int. J. Heat Mass Transf. 42, 3727–3738.
Hu, J., Tsai, H.L., 2007. Heat and mass transfer in gas metal arc welding. Part I: The arc. Int. J. Heat Mass Transf. 50, 833–846.http://dx.doi.org/10.1016/j.
ijheatmasstransfer.2006.08.025.
Jonsson, P.G., Murphy, A.B., Szekely, J., 1995. The influence of oxygen additions on argon-shielded gas metal arc welding processes. Weld. J.- Weld. Res. Suppl. 74, 48s.
Kim, C.S., 1975. Thermophysical Properties of Stainless Steels (No. ANL–75-55). Argonne National Lab, USA.
Kou, S., 2003. Welding Metallurgy. J. Wiley & Sons.
Lancaster, J., 1986. The Physics of Welding. International Institute of Welding.
Lowke, J.J., Tanaka, M., 2008. The physics of non-thermionic cathodes of electric arcs, in: gas Discharges and Their Applications, 2008. GD 2008. 17th International Conference On. IEEE 137–140.
Murphy, A.B., Tam, E., 2014. Thermodynamic properties and transport coefficients of arc lamp plasmas: argon, krypton and xenon. J. Phys. Appl. Phys. 47, 295202.http://dx. doi.org/10.1088/0022-3727/47/29/295202.
Murphy, A.B., Tanaka, M., Yamamoto, K., Tashiro, S., Sato, T., Lowke, J.J., 2009. Modelling of thermal plasmas for arc welding: the role of the shielding gas properties and of metal vapour. J. Phys. Appl. Phys. 42, 194006.http://dx.doi.org/10.1088/ 0022-3727/42/19/194006.
Murphy, A.B., 1995. Transport coefficients of air, argon-air, nitrogen-air, and oxygen-air plasmas. Plasma Chem. Plasma Process. 15, 279–307.http://dx.doi.org/10.1007/ BF01459700.
Murphy, A.B., 2012. Transport coefficients of plasmas in mixtures of nitrogen and hy-drogen. Chem. Phys. Chem. Phys. Low-Temp. Plasmas 398, 64–72.http://dx.doi.org/ 10.1016/j.chemphys.2011.06.017.(in honour of Prof Mario Capitelli).
Murphy, A.B., 2014. Calculation and application of combined diffusion coefficients in thermal plasmas. Sci. Rep. 4.http://dx.doi.org/10.1038/srep04304.
Ogino, Y., Hirata, Y., Murphy, A.B., 2016. Numerical simulation of GMAW process using Ar and an Ar–CO2 gas mixture. Weld. World 60, 345–353.http://dx.doi.org/10. 1007/s40194-015-0287-3.
Onsoien, M., Liu, S., Olson, D., 1995. Shielding gas oxygen equivalent in weld micro-structure optimization. Weld. J. Res. Suppl. 75, 216s–224s.
Sato, Y., Tomita, K., Kuwana, T., 1993. Oxygen absorption by steel weld metal in an Ar-CO2-O2welding atmosphere. 2nd report: oxygen absorption during gas metal arc
welding. Weld. Int. 7, 358–364.http://dx.doi.org/10.1080/09507119309548406. Schnick, M., Wilhelm, G., Lohse, M., Füssel, U., Murphy, A.B., 2011. Three-dimensional
modelling of arc behaviour and gas shield quality in tandem gas–metal arc welding using anti-phase pulse synchronization. J. Phys. Appl. Phys. 44, 185205.http://dx. doi.org/10.1088/0022-3727/44/18/185205.
Schwass, D., Wittlich, M., Schmitz, M., Siekmann, H., 2011. Emission of UV Radiation During Arc Welding. Institute of Occupational Safety and Health of the German Social Accident Insurance (IFA), Sankt Augustin.
Settles, G.S., 2001. Schlieren and Shadowgraph Techniques: Visualizing Phenomena in Transparent Media. Springer.
Tamaki, K., Masumoto, I., Takahashi, Y., 1978. Some observation of the gas shielding conditions of CO2 arc welding by the application of a television system.pdf. J. Jpn. Weld. Soc. 47, 37–42.
Valensi, F., Pellerin, S., Boutaghane, A., Dzierzega, K., Zielinska, S., Pellerin, N., Briand, F., 2010. Plasma diagnostics in gas metal arc welding by optical emission spectro-scopy. J. Phys. Appl. Phys. 43, 434002.http://dx.doi.org/10.1088/0022-3727/43/ 43/434002.
Wilhelm, G., Gött, G., Schöpp, H., Uhrlandt, D., 2010. Study of the welding gas influence on a controlled short-arc GMAW process by optical emission spectroscopy. J. Phys. Appl. Phys. 43, 434004.http://dx.doi.org/10.1088/0022-3727/43/43/434004. Williamson, R.L., Fincke, J.R., Crawford, D.M., Snyder, S.C., Swank, W.D., Haggard, D.C.,