City, University of London Institutional Repository
Citation
:
Santomauro, C., Powell, M., Davis, C., Liu, D., Aitken, L. M. ORCID: 0000-0001-5722-9090 and Sanderson, P. (2018). Interruptions to intensive care nurses and clinical errors and procedural failures: A controlled study of causal connection. Journal of Patient Safety, doi: 10.1097/PTS.0000000000000528This is the accepted version of the paper.
This version of the publication may differ from the final published
version.
Permanent repository link:
http://openaccess.city.ac.uk/id/eprint/20318/Link to published version
:
http://dx.doi.org/10.1097/PTS.0000000000000528Copyright and reuse:
City Research Online aims to make research
outputs of City, University of London available to a wider audience.
Copyright and Moral Rights remain with the author(s) and/or copyright
holders. URLs from City Research Online may be freely distributed and
linked to.
City Research Online: http://openaccess.city.ac.uk/ [email protected]
Interruptions to intensive care nurses and clinical errors and procedural failures:
A controlled study of causal connection
Chiara Santomauro, PhD,1 Madeleine Powell, BN,2 Chelsea Davis,
GradCert(IntCareNursing),2 David Liu, PhD,34 Leanne M Aitken, PhD,267 Penelope
Sanderson, PhD134
1 School of Psychology, The University of Queensland
2 Intensive Care Unit, Princess Alexandra Hospital
3 School of Information Technology and Electrical Engineering, The University of Queensland
4 Faculty of Medicine, The University of Queensland
6 School of Health Sciences, City, University of London
7 School of Nursing and Midwifery, Griffith University
Corresponding author:
Chiara Santomauro
School of Psychology, The University of Queensland
St Lucia, QLD 4072 Australia
+61 (0)403 714 886
Funding:
This research was funded by an Australian Research Council Discovery Project
(DP140101821). Chiara Santomauro is further supported by an Australian Postgraduate
Abstract
Objectives. Interruptions occur frequently in the Intensive Care Unit (ICU) and are
associated with errors. To date, no causal connection has been established between
interruptions and errors in healthcare. It is important to know if interruptions directly cause
errors before implementing interventions designed to reduce interruptions in ICUs. Our
objective was to investigate whether ICU nurses who receive a higher number of workplace
interruptions commit more clinical errors and procedural failures than those who receive a
lower number of interruptions.
Methods. We conducted a prospective controlled trial in a high-fidelity ICU simulator. A
volunteer sample of ICU nurses from a single unit prepared and administered intravenous
medications for a patient manikin.Nurses received either 3 (n = 35) or 12 (n = 35)
scenario-relevant interruptions and were allocated to either condition in an alternating fashion. Primary
outcomes were the number of clinical errors and procedural failures committed by each
nurse.
Results. The rate ratio of clinical errors committed by nurses who received 12 interruptions
compared to nurses who received 3 interruptions was 2.0 (95% CI [1.41, 2.83]), p < .001. The
rate ratio of procedural failures committed by nurses who received 12 interruptions compared
to nurses who were interrupted 3 times was 1.2 (95% CI [1.05, 1.37]), p = .006.
Conclusions. More workplace interruptions during medication preparation and
administration lead to more clinical errors and procedural failures. Reducing the frequency of
interruptions may reduce the number of errors committed; however, this should be balanced
against important information that interruptions communicate.
Introduction
Interruptions to healthcare workers are viewed as a common and accepted part of
practice.1 An Australian study found that interruptions occurred 14 times per hour in the
Intensive Care Unit (ICU) and contributed to over a third of total communication.2 However,
interruptions are associated with increased workload,3 increased time taken to return to and
complete the interrupted task,4 5 and an increased likelihood of abandoning the interrupted
task.6
Importantly, interruptions have been associated with clinical errors and procedural
failures.7 8 In a large observational study of 4271 medication administrations by 98 nurses on
medical wards, Westbrook et al.8 found that 80% of medication administrations contained a
clinical error or a procedural failure regardless of whether or not interrupted, and that each
additional interruption was associated with a 12.7% increase in clinical errors and a 12.1%
increase in procedural failures. Medical errors can not only result in patient harm, but also
traumatise healthcare workers who commit them9 and disrupt their organisations.
Consequently, efforts have been made to reduce interruptions in order to reduce the
likelihood of subsequent errors.
Despite the strong association reported by Westbrook et al.,8 there is no conclusive
evidence for a direct causal relationship between the number of interruptions received in the
healthcare workplace and the likelihood of errors.10 A few simulation studies point to a causal
connection, but they do not directly test the hypothesis that more interruptions lead to more
errors11-13 or they are underpowered pilot studies.14
Given that a causal dose-response relationship has not been established with a
prospective, controlled experimental design,15 we do not know whether efforts to reduce
interruptions will succeed in reducing errors.16 Recent interventions in clinical contexts have
errors remains unclear.17-19 Of greater concern is the fact that such interventions can produce
unforeseen consequences. For example, when nurses wore a “do not interrupt” vest,
interruptions from patients decreased whereas interruptions from other nurses increased.20
Certain interruptions are considered an essential aspect of clinical workflow, which calls into
question the effectiveness of interruption-elimination interventions.21
This study was designed as an efficacy trial to investigate the effect of a lower versus
higher number of workplace interruptions on errors in a simulated ICU setting. Since
interruptions may be impractical to eliminate entirely,2 we chose not to incorporate a
zero-interruptions condition. Nurses would receive either 1 interruption per scenario (3 in total) or
4 interruptions per scenario (12 in total). We predicted that ICU nurses who received 12
interruptions would commit significantly more clinical errors and procedural failures than
Method
Participants
Participants were registered nurses practicing in a tertiary ICU with a 1:1 nurse to
patient ratio in Queensland, Australia, recruited via flyers and emails advertising the study
internally within their unit. Research Ethics Board approval was obtained from Metro South
Hospital and Health Service (HREC/16/QPAH/391) and The University of Queensland
(2016001102). Inclusion criteria were ≥6 months registered nursing experience and being unaware of the study aim, to avoid expectancy effects. To conceal the study aim, participants
were advised that the researchers were interested in workflow and team communication.
After study completion, participants received a small gift and a debrief sheet that did not
reveal the purpose of the study but requested that participants not discuss the study with
others.
Sample size was based on a Cohen’s d of 0.73 from our prior laboratory study
(Santomauro & Sanderson, in preparation), which allowed for a minimum rate ratio of 1.44
for clinical errors between interruption conditions to be detected with 80% power and α = .025 to control for multiplicity with two primary outcome variables (clinical errors and
procedural failures).
Design
A prospective, alternately-allocated parallel groups design was used to examine the
effect of frequency of interruptions (3 vs. 12 interruptions) on the number of clinical errors
and procedural failures. The 12-interruptions condition was based on Westbrook et al.’s8 data
showing nurses received up to 6 interruptions per medication administration and an
observational study conducted in the ICU in question which found that nurses received up to
12 interruptions per hour.22 Participants were alternately allocated to a condition of lower (3)
due to concerns that we would not reach the desired sample size due to events outside our
control and we wanted to ensure equal numbers were obtained across the two conditions.
Outcomes and measures
Primary outcomes were the number of clinical errors and procedural failures. Clinical
errors were any deviation from the medication order or procedure that would result in the
patient directly receiving a medication inconsistent with what they were prescribed.
Procedural failures were sequencing errors, and safety or technique violations that would not
directly result in a medication inconsistent with the patient’s order.
Secondary outcomes included participant demographics and post-experiment surveys
assessing realism of scenarios, immersion in scenarios, and level of distraction and
annoyingness of the actor on 5-point Likert scales. They also included the NASA Task Load
Index (NASA-TLX), a validated workload questionnaire used to assess mental, physical, and
temporal demand, perceived performance, effort, and frustration on 20-point Likert scales.23
24
Scenario design, equipment, and delivery
Each participant performed intravenous medication preparation and administration
tasks in 3 scenarios that were joined to form a continuous experience of usual ICU patient
care; these scenarios always occurred in the same order. Each scenario included 1 or 2
medications and 1 or 4 interruptions (making 3 or 12 interruptions overall) and was scripted
in detail and precisely timed.
Each interruption occurred at a specific time during a medication task and was designed
to be disruptive, based on interruptions theory and prospective memory theory (e.g.,
interruptions that are longer in duration are more disruptive than interruptions that are shorter
in duration,25-27 and interruptions that occur in the middle of a task are more disruptive than
ignore. If a participant chose not to engage with an interruption, the researchers had
procedures to ensure that the interruption still occurred but in a slightly different way. For
example, if the actor phoned the participant to provide some information but the participant
did not answer, the actor would simply enter the room instead. Interruptions were designed
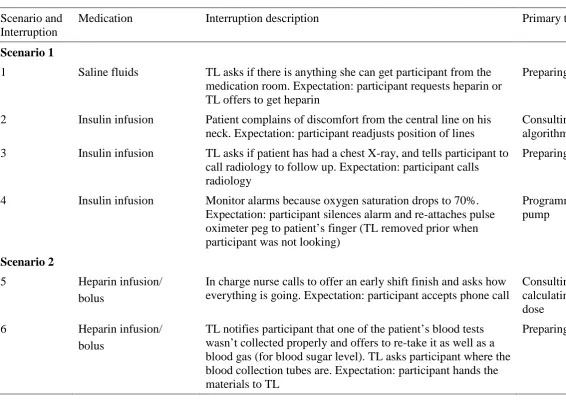
with the help of local ICU nurses to be relevant to the scenario and plausible (Table 1 and
Figure 1). Participants in the 3-interruptions condition received 3 interruptions that had
different properties from one another (e.g., a participant in this condition would not get two
phone calls). We created several combinations of 3-interruptions so that all of the
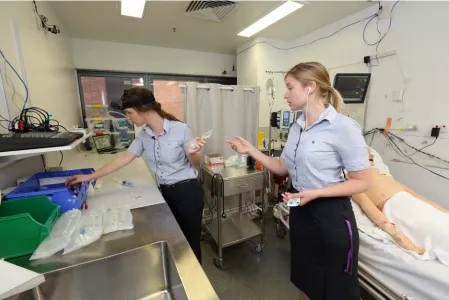
interruptions were sampled in this condition. The simulation setting represented an ICU
bedspace and small medication room. The room included most equipment that would
typically be found at an ICU bedspace, including a bedside phone that connected to a mobile
phone in the control room. The patient was simulated with a manikin (Megacode Kelly:
Laerdal Global Health) voiced by a research assistant in the control room with a microphone
connected to a loud speaker.
The ICU Electronic Medication Record (EMR) system was installed on a computer in
the simulation room, with reduced functionality. A medication room separated by a partition
contained a locked restricted drugs cupboard, a non-restricted drugs cupboard, drug register,
materials to prepare infusions, and another computer with the EMR system.
Video was recorded and live streamed with four wall-mounted Logitech cameras and a
GoPro Hero 5 recording from the participant’s forehead. Audio was recorded and live
streamed with a whole room microphone and lapel microphones worn by the participant and
the actor. The experimental coordinator (author CS) used a microphone in the control room to
communicate to the actor via an ear piece, coordinated the scenarios from the control room,
and answered any questions the participant had during the simulation over the loud speaker.
delivered interruptions and helped participants when required (e.g., checking medications).
The participant could use the bedside phone to call the TL or other personnel whenever
needed. The research assistant was located in the control room to voice the patient and all of
the phone-based characters.
Procedure
After providing informed consent, participants completed a demographic survey.
Recording equipment was established, equipment and processes explained, and participants
advised that they could ask for information or clarification at any time. Tasks not required
and any deviations from typical duties were explained (e.g., participants were not required to
record patient observations in the iEMR system even though this is typically required). The
experimental coordinator provided a patient handover, indicated that the TL would visit
shortly and left the room, leaving the participant to start their patient assessment.
The first medication of Scenario 1 was uploaded to the EMR system, and when the
participant finished their patient assessment they typically checked the computer, saw the
medication, and began preparing it. The TL then entered the room and prompted the
participant to check the computer, if it had not been checked after the assessment. The next
two scenarios unfolded with no break between them.
Participants were asked to prepare and administer each medication from start to finish
before moving to the next one, otherwise it would have been difficult to deliver interruptions
at the correct times. This behaviour was reinforced by uploading a new medication to the
EMR system only while the participant was preparing or administering the previous
medication. Other than this, participants had the freedom to carry out the tasks as they
wished.
Towards the end of Scenario 3, the TL told the participant to call her when the
everything and perform any corrections or extra tasks they felt were important before
finishing. Throughout the scenario, participants could correct any clinical errors and
procedural failures they detected, or ask the TL to make corrections. After the simulation, the
participant completed the NASA-TLX and answered questions about the TL and the
simulation, described earlier.
The experimental coordinator recorded any clinical errors and procedural failures that
were detected during scenario delivery. Pump programming, labelling, and documentation
were checked for any further errors before preparing for the next participant.The whole
experiment lasted 1–2.5 hours, the large variation due to participants having freedom to
perform extra tasks such as patient observations throughout the scenarios.
Data analysis
Video footage was analysed with DataVyu (http://www.datavyu.org/) and exported into
Microsoft Excel worksheets. A research assistant independently coded 10% of the video
footage, which revealed a good level of agreement for identification of clinical errors and
procedural failures, ĸ = .79, p < .001. All clinical errors and procedural failures were checked
and confirmed by the research nurse, and any discrepancies or uncertainties were resolved by
consulting unit or hospital policies.
Statistical analyses were conducted in IBM SPSS 22 with two-tailed tests and α = .025
for primary outcomes analyses and α = .05 for remaining analyses. For primary outcomes,
Poisson regression with corrections for overdispersion as required was used to analyse count
data (clinical errors and procedural failures). To assess and control for potential baseline
imbalances in demographics, age was converted to continuous format (mean age for each
category range) and education was collapsed into three categories (Diploma, Bachelor,
Postgraduate). Both full regression and reduced (using backwards stepwise regression with
parametric tests were used for non-count data with log or square-root transformations as
required according to residual diagnostics, otherwise non-parametric tests were applied. For
parametric tests, residual diagnostics were conducted to assess appropriateness of model fit
Results
Demographics
Seventy-two nurses volunteered to participate; one subsequently declined due to use of
video recording, and one was excluded due to loss of blinding prior to participation.
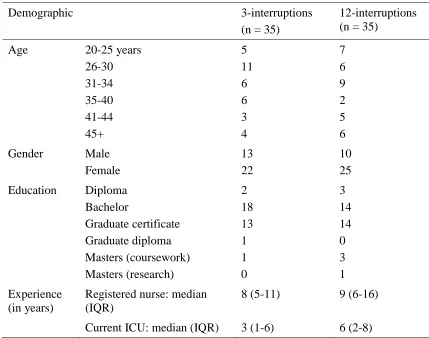
Demographic characteristics of the 70 nurses were similar across both groups, although
participants who received 12 interruptions had more experience in the current ICU than
participants who received 3 interruptions (Table 2).
Participants in the 3-interruptions condition received all 3 interruptions. However, 4
participants in the 12-interruptions condition received 11 interruptions instead of 12. In these
situations, an interruption was missed due to technical issues such as the alarm on the
monitor not sounding, or because the participant completed the primary interrupting task
much faster than anticipated.
Although the interruptions were designed to be difficult to block, defer, or ignore,
participants were free to deal with them as they pleased. Two participants blocked one
interruption, one participant multi-tasked one interruption, and the rest engaged or deferred
all interruptions.
Primary outcomes
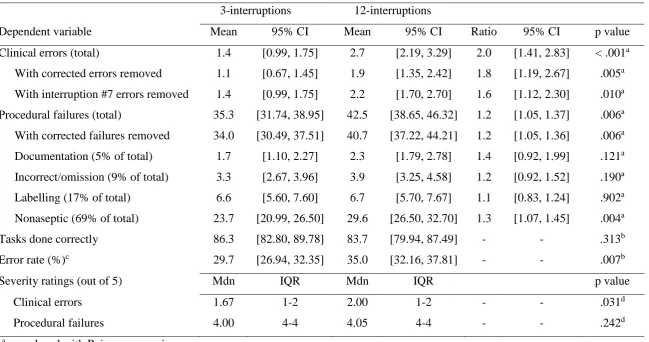
Nurses who received 12 interruptions committed clinical errors 2.0 times (95% CI
[1.41, 2.83]) more frequently than nurses who received 3 interruptions. Nurses who received
12 interruptions committed procedural failures 1.2 times (95% CI [1.05, 1.37]) more
frequently than nurses who were interrupted 3 times (Table 3).
After controlling for baseline demographic imbalances, the rate ratio of clinical errors
and procedural failures between interruption conditions were not substantially affected (2.1,
95% CI [1.45, 2.07], p < .001 and 1.2, 95% CI [1.00, 1.33], p = .049, respectively) and none
models. Backwards stepwise regressions conducted independently due to multicollinearity
for age (p = .017), years experience as a registered nurse (p = .007), and years experience in
the current ICU (p = .009) identified all three as statistically significant covariates in the
procedural failures analysis – but there was minimal impact on the rate ratio of procedural
failures committed by nurses across interruption conditions (1.2, 95% CI [1.00, 1.32], p =
.043). The strongest association was in the years experience as a registered nurse, which
showed that procedural failures increased by 1.2% (95% CI [0.0, 2.0%]) with every year
increase in participant nursing experience.
Post-hoc exploratory analyses
When errors that were subsequently corrected were removed from the analysis,
participants who were interrupted 12 times still committed more clinical errors and
procedural failures than participants who were interrupted 3 times (Table 3).
There were no statistically significant differences between conditions in NASA-TLX
scores, or in ratings of TL distraction or annoyance, scenario realism (Mdn = 4, IQR = 3-5) or
immersion (Mdn = 3, IQR = 2-4) on 5-point Likert scales.
Participants who received 12 interruptions had an extra opportunity (interruption #7) to
commit a clinical error compared to participants who received 3 interruptions. It was not
possible to deliver interruption #7 to participants in the 3-interruptions condition because
they only received one interruption per scenario, and it followed logically from the previous
interruption within the same scenario (interruption #6). Because interruption #7 had the
potential to lead to a specific clinical error, participants who received this interruption (i.e.,
all participants who received 12 interruptions) may have had unfairly inflated error rates.
When clinical errors that resulted directly from this interruption were removed, the rate ratio
In a subgroup analysis, procedural failures were sorted into four categories:
documentation errors (e.g., documenting medication administrations incorrectly);
incorrect/omission errors (doing something incorrectly or not at all); labelling errors
(incorrect information written on line/bag/syringe labels); and nonaseptic technique (e.g., not
swabbing the connection port for 15 seconds). Interruption frequency was a significant
predictor only of nonaseptic technique: participants who were interrupted 12 times used
nonaseptic technique more frequently than participants who were interrupted 3 times (Table
3).
The number of tasks completed correctly (i.e., any task that had the potential for an
error but did not contain one) varied across participants, depending on how they did their
work. An error rate was computed for each participant to account for this variation. The
number of tasks performed incorrectly (clinical errors and procedural failures) was totalled
and divided by the total number of tasks performed (correctly and incorrectly). Participants
who were interrupted 12 times had significantly higher error rates than participants who were
interrupted 3 times (Table 3). We also considered whether receiving a high number of
interruptions would result in more opportunities to commit errors (i.e., by requiring the
participant to complete more tasks in general). For example, nurses who received 12
interruptions may have been required to wash their hands more often than nurses who
received 3 interruptions (due to the extra interrupting tasks). However, we found no
difference in the number of tasks done correctly between participants who were interrupted
12 times compared to 3 times.
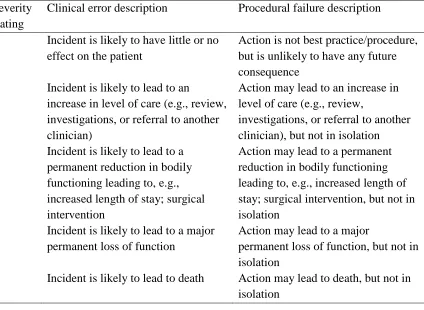
To explore whether an increase in the number of interruptions lead to more severe
clinical errors and/or procedural failures, all clinical errors and procedural failures were
categorized into one of five severity ratings (Table 4). Categories of clinical errors were taken
error categories. All severity ratings were checked and confirmed by the research nurse and
nursing professor. Two independent subject matter experts rated a sample of clinical errors
and procedural failures and the ratings of all errors were adjusted accordingly before
performing the analyses. The average severity of procedural failures did not differ between
interruption conditions; however, clinical errors committed by participants in the
12-interruptions condition were more severe than clinical errors committed by participants in the
Discussion
Summary of findings
Nurses who received a higher number of interruptions during medication preparation
and administration tasks committed more clinical errors and procedural failures than nurses
who received a lower number of interruptions. This study therefore demonstrates a
prospective dose-response relationship between interruptions, clinical errors and procedural
failures.15 The findings provide further evidence to support the hypothesis that there is a
causal relationship between interruptions and errors, and they fill a previously noted gap in
the literature.10 16 Our results strengthen observational research showing an association only7 8
and empirical research that uses quasi-experimental methods or small samples only.12-14
Westbrook et al.’s8 estimated risk data for clinical errors suggest a rate ratio of 1.4
when comparing nurses who received 1 interruption and 4 interruptions per medication – a
rate lower than but comparable to that found in the current study (2.0) when comparing 1
interruption versus 4 interruptions per scenario. The rate ratio may be higher in our study
because the interruptions were designed to be maximally disruptive. When considering only
the most severe errors, Westbrook et al. report a rate ratio of 2.0 when comparing nurses who
received 0 interruptions and 4 interruptions per medication, which is more comparable to our
rate ratio of 1 versus 4 interruptions per scenario.
We used an alternately-allocated parallel groups design for pragmatic reasons, but
compared to randomized designs, they are more susceptible to selection biases and
confounding. The potential for selection biases were minimised by blinded allocation;
participants were scheduled by a senior nurse blinded to both study aims and interruption
condition without the involvement of the research team. In addition, participants were
scheduled to testing sessions at relatively short notice because of unpredictable shift changes
and unit workload, and participants in each condition were equally likely to be tested in the
reduced regression models did not substantively change the conclusions or effect sizes.
Furthermore, residual diagnostics did not show evidence of autocorrelation, suggesting that
participants’ performance did not systematically improve or worsen as the experiment
progressed. Thus, our findings are unlikely to be due to bias or confounding.
The effect of interruptions on clinical errors held even when participants subsequently
corrected some errors. However, the corrections could have been made at any point in the
simulation, so in principle the initial error could have already reached the patient before it
was detected. For example, a participant may start an intravenous infusion without priming
the tubing with fluid, but only realise the error once air has already entered the patient’s
blood stream. The clinical errors observed mostly related to the medication rate and dose.
The effects of interruptions on procedural failure counts was driven by the increase in
violations of aseptic technique with more interruptions. Given that interrupted tasks may be
done faster than uninterrupted tasks,31 interrupted nurses may have performed tasks more
quickly by omitting perceived tedious steps such as hand washing or reducing the time taken
to swab insertion ports. A further procedural failure was forgetting to ask the TL to check
required components of the medication preparation and administration process. This failure
potentially facilitated a clinical error—for example, not asking the TL to check a drug
calculation and then administering the wrong dose.
The total number of tasks that the participants performed correctly did not differ across
conditions. This finding suggests that the interruptions did not increase the number of tasks
completed and therefore were not simply providing more opportunities for mistakes.
Participant age, nursing experience, and ICU experience were associated with a small
increase in the frequency of procedural failures but not clinical errors. A similar effect was
observed in Westbrook et al.’s study,8 with 1% (95% CI [0.6, 1.4%]) higher rate of
in the current study. Although counterintuitive, this effect can be explained by the model of
Dynamic Safety.32 Procedural failures that do not result in overt accidents reinforce the
incorrect action, especially in the long term. Therefore, nurses with many years of experience
may be more likely to commit procedural failures because they have not observed any
consequence for that action.
Participants who were interrupted 12 times committed more severe clinical errors than
participants who were interrupted 3 times. This supports Westbrook et al.’s8 finding that the
risk of committing a major error (rating of 3-5) increases with the number of interruptions
received. However, although we found a difference in the number of procedural failures
across interruption conditions, we did not find a difference in severity ratings of procedural
failures. The most common procedural failure was nonaseptic technique, which was given a
severity rating of 5 out of 5 due to its potential to lead to a blood infection. Thus, the average
procedural failure severity rating was 4 out of 5, revealing a potential ceiling effect that may
have concealed any differences in severity between the two conditions.
Limitations
The research has several limitations that may affect the representativeness of the study
and the generalizability of the findings. First, we did not randomly allocate participants to
each condition. Future studies in this area should ideally be randomized, but in the present
study with alternate-allocation the findings did not appear to be the result of bias or
confounding.
Second, as with all simulation research, participants were aware they were being
watched and recorded. As a result, participants’ behaviour may not reflect their behaviour in
clinical practice. A concern was that participants might feel uncomfortable deferring or
blocking interruptions while being recorded, but our participants’ high rates of accepting the
Third, the frequency of clinical errors and procedural failures may have been artificially
inflated if participants were nervous and/or working in an unfamiliar environment, and we
did not collect baseline error rates with no interruptions. Although the rates of errors and
failures in our study appear high, our findings are consistent with Westbrook et al.’s8
observational data suggesting that baseline error rates are high. Using a similar classification
for errors, they found that 25% of uninterrupted medication administrations contained clinical
errors and 70% of uninterrupted medication administrations contained procedural failures.
Fourth, the simulation room and scenarios contained several unique qualities compared
with the ICU in question. (1) The room was similar to an ‘isolation room’ in the ICU,
whereas most of the ICU bed-spaces are in an open plan where nurses can easily approach
neighbouring nurses. (2) The medication room is not normally so close to the bedspace and is
accessed via swipe card rather than a partition. (3) Efforts were made to include interruptions
that were representative of authentic workplace interruptions, but there were some that we
could not simulate. For example, interruptions often come from the nurse at the adjacent
bedspace but this would have required a larger simulation room and additional actors. (4) We
assessed the impact of interruptions on medication preparation and administration tasks only.
It is not clear whether interruptions would lead to errors during other nursing tasks.
Applications and future directions
Because more interruptions can cause more errors, reducing or eliminating
interruptions could be an effective step towards reducing errors. However, attempts to
enforce zero interruptions have led to unanticipated consequences.20 35 Researchers are
shifting from a viewpoint that all interruptions are inherently undesirable, to acknowledging
that many interruptions are essential for the work system to function.1 22 34 36-38 In our
scenarios, every interruption could be considered necessary. Instead, interruption-reduction
interruptions that facilitate good coordination of the work system should be preserved. One
possibility is to develop nurses’ resilience to interruptions with system-based changes such as
visual timers and cues.13 39 Interruption management strategies could also be used to mitigate
the negative effects of interruptions.37
Our findings reflect ICU environments and other critical care/emergency departments –
whether they are generalizable to other settings with different nurse and patient
Conclusion
This is the first prospective controlled study to test the hypothesis that more
interruptions lead to more clinical errors and procedural failures in a simulated ICU
environment. Our findings point to a dose-response relationship between interruptions and
errors; the prospective nature of the finding increases our confidence in a causal connection.
Reducing the frequency of interruptions may lead to a reduction in errors, but may also result
in unexpected consequences to the wider work system. Researchers could shift their focus to
making necessary interruptions safer by increasing the resilience of the work system, while
Acknowledgements
We thank our research assistant – Felicity Bergmann – for helping to conduct the
simulations. We also thank Anna Hickling for her administrative and rostering help, and
Ismail Mohammed for setting up the technology in the simulation and control room. We
gratefully acknowledge the ICU staff at the Princess Alexandra Hospital: Janine Fitzgerald
for providing backfill and helping with recruitment; Sarah Lepelaar, Krista Wetzig, and Anne
Chandler for providing guidance during the early stages of development; Rodney Hurford for
his technical help; the Nurse Unit Managers, educators, and the nurses who participated in
the study for their support. Finally, we would like to acknowledge our collaborators Professor
Bala Venkatesh, Professor Sidney Dekker, Dr Tobias Grundgeiger, and Dr Tara McCurdie
Conflicts of Interest
References
1. Hopkinson SG, Wiegand DL. The culture contributing to interruptions in the nursing work
environment: An ethnography. Journal of Clinical Nursing 2017;26(23-24):5093-102.
doi: 10.1111/jocn.14052
2. Alvarez G, Coiera E. Interruptive communication patterns in the intensive care unit ward
round. Int J Med Inform 2005;74(10):791-96. doi: 10.1016/j.ijmedinf.2005.03.017
3. Weigl M, Muller A, Vincent C, et al. The association of workflow interruptions and
hospital doctors' workload: a prospective observational study. BMJ Qual Saf
2012;21(5):399-407. doi: 10.1136/bmjqs-2011-000188
4. Grundgeiger T, Sanderson P, MacDougall HG, et al. Interruption Management in the
Intensive Care Unit: Predicting Resumption Times and Assessing Distributed
Support. J Exp Psychol-Appl 2010;16(4):317-34. doi: 10.1037/a0021912
5. Cole G, Stefanus D, Gardner H, et al. The impact of interruptions on the duration of
nursing interventions: a direct observation study in an academic emergency
department. BMJ Qual Saf 2016;25(6):457-65. doi: 10.1136/bmjqs-2014-003683
6. Drews FA. The frequency and impact of task interruptions in the ICU. Proceedings of the
Human Factors and Ergonomics Society Annual Meeting 2007;51(11):683-86. doi:
10.1177/154193120705101117
7. Johnson M, Sanchez P, Langdon R, et al. The impact of interruptions on medication errors
in hospitals: an observational study of nurses. J Nurs Manag 2017;25(7):1-10. doi:
10.1111/jonm.12486
8. Westbrook JI, Woods A, Rob MI, et al. Association of interruptions with an increased risk
and severity of medication administration errors. Arch Intern Med
2010;170(8):683-90. doi: 10.1001/archinternmed.2010.65
9. Wu AW. Medical error: the second victim - The doctor who makes the mistake needs help
10. Hopkinson SG, Jennings BM. Interruptions during nurses' work: A state-of-the-science
review. Res Nurs Health 2013;36(1):38-53. doi: 10.1002/nur.21515
11. Jones J, Wilkins M, Caird J, et al. An experimental study on the impact of clinical
interruptions on simulated trainee performances of central venous catheterization.
Advances in Simulation 2017;2(1):1-7. doi: 10.1186/s41077-017-0038-1
12. Liu D, Grundgeiger T, Sanderson PM, et al. Interruptions and Blood Transfusion Checks:
Lessons from the Simulated Operating Room. Anesth Analg 2009;108(1):219-22. doi:
10.1213/ane.0b013e31818e841a
13. Prakash V, Koczmara C, Savage P, et al. Mitigating errors caused by interruptions during
medication verification and administration: interventions in a simulated ambulatory
chemotherapy setting. BMJ Qual Saf 2014;23(11):884-92. doi:
10.1136/bmjqs-2013-002484
14. Campoe KR, Giuliano KK. Impact of Frequent Interruption on Nurses’
Patient-Controlled Analgesia Programming Performance. Hum Factors 2017;59(8):1204-13.
doi: 10.1177/0018720817732605
15. Poots AJ, Reed JE, Woodcock T, et al. How to attribute causality in quality improvement:
lessons from epidemiology. BMJ Qual Saf 2017;26(11):933-37. doi:
10.1136/bmjqs-2017-006756
16. Grundgeiger T, Sanderson P. Interruptions in healthcare: Theoretical views. Int J Med
Inform 2009;78(5):293-307. doi: 10.1016/j.ijmedinf.2008.10.001
17. Westbrook JI, Li L, Hooper TD, et al. Effectiveness of a ‘Do not interrupt’ bundled
intervention to reduce interruptions during medication administration: a cluster
randomised controlled feasibility study. BMJ Qual Saf 2017;26(9):734-42. doi:
18. Flynn EA, Evanish JQ, Fernald JM, et al. Progressive care nurses improving patient
safety by limiting interruptions during medication administration. Crit Care Nurse
2016;36(4):19-35. doi: 10.4037/ccn2016498
19. Dall'Oglio I, Fiori M, Di Ciommo V, et al. Effectiveness of an improvement programme
to prevent interruptions during medication administration in a paediatric hospital: a
preintervention–postintervention study. BMJ Open 2017;7(1):1-8. doi:
10.1136/bmjopen-2016-013285
20. Tomietto M, Sartor A, Mazzocoli E, et al. Paradoxical effects of a hospital-based,
multi-intervention programme aimed at reducing medication round interruptions. J Nurs
Manag 2012;20(3):335-43. doi: 10.1111/j.1365-2834.2012.01329.x
21. McCurdie T, Sanderson P, Aitken LM, et al. Two sides to every story: The Dual
Perspectives Method for examining interruptions in healthcare. Appl Ergon
2017;58:102-09. doi: 10.1016/j.apergo.2016.05.012
22. McCurdie T, Sanderson P, Aitken LM. Applying social network analysis to the
examination of interruptions in healthcare. Appl Ergon 2018;67:50-60. doi:
10.1016/j.apergo.2017.08.014
23. Hart SG, Staveland LE. Development of NASA-TLX (Task Load Index): Results of
Empirical and Theoretical Research. In: Hancock PA, Meshkati N, eds. Advances in
Psychology: North-Holland 1988:139-83.
24. Rubio S, Díaz E, Martín J, et al. Evaluation of subjective mental workload: A comparison
of SWAT, NASA‐TLX, and workload profile methods. Applied Psychology
2004;53(1):61-86.
25. Altmann EM, Trafton JG, Hambrick DZ. Momentary Interruptions Can Derail the Train
26. Li SYW, Cox AL, Blandford A, et al. Further investigations into post-completion error:
the effects of interruption position and duration. Proceedings of the 28th Annual
Meeting of the Cognitive Science Conference 2006.
27. Monk CA, Trafton JG, Boehm-Davis DA. The Effect of Interruption Duration and
Demand on Resuming Suspended Goals. J Exp Psychol-Appl 2008;14(4):299-313.
doi: 10.1037/a0014402
28. Li SYW, Magrabi F, Coiera E. A systematic review of the psychological literature on
interruption and its patient safety implications. J Am Med Inform Assn
2012;19(1):6-12. doi: 10.1136/amiajnl-2010-000024
29. Hodgetts HM, Jones DM. Interruption of the tower of London task: Support for a
goal-activation approach. J Exp Psychol Gen 2006;135(1):103-15. doi:
10.1037/0096-3445.135.1.103
30. Ratwani RM, Trafton JG. Now, Where Was I? Examining the Perceptual Processes while
Resuming an Interrupted Task. Proceedings of the Annual Meeting of the Cognitive
Science Society 2006; 28.
31. France DJ, Levin S, Hemphill R, et al. Emergency physicians’ behaviors and workload in
the presence of an electronic whiteboard. Int J Med Inform 2005;74(10):827-37. doi:
10.1016/j.ijmedinf.2005.03.015
32. Cook R, Rasmussen J. "Going solid'': a model of system dynamics and consequences for
patient safety. Qual Saf Health Care 2005;14(2):130-34. doi:
10.1136/qshc.2003.009530
33. Ratwani RM, Fong A, Puthumana JS, et al. Emergency physician use of cognitive
strategies to manage interruptions. Ann Emerg Med 2016;70(5):683-87. doi:
34. Walter SR, Raban MZ, Dunsmuir WTM, et al. Emergency doctors' strategies to manage
competing workload demands in an interruptive environment: An observational
workflow time study. Appl Ergon 2017;58:454-60. doi: 10.1016/j.apergo.2016.07.020
35. Myers RA, Parikh PJ. Nurses’ work with interruptions: an objective model for testing
interventions. Health Care Manage Sci 2017 doi: 10.1007/s10729-017-9417-3
[published Online First: 4 September 2017]
36. Gao J, Rae WA, Dekker SWA. Intervening in Interruptions: What Exactly Is the Risk We
Are Trying to Manage? J Patient Saf 2017 doi: 10.1097/PTS.0000000000000429
[published Online First: October 2017]
37. Werner NE, Holden RJ. Interruptions in the wild: Development of a sociotechnical
systems model of interruptions in the emergency department through a systematic
review. Appl Ergon 2015;51:244-54. doi: 10.1016/j.apergo.2015.05.010
38. Rivera AJ. A socio-technical systems approach to studying interruptions: Understanding
the interrupter's perspective. Appl Ergon 2014;45(3):747-56. doi:
10.1016/j.apergo.2013.08.009
39. Grundgeiger T, Sanderson PM, Orihuela CB, et al. Prospective memory in the ICU: the
effect of visual cues on task execution in a representative simulation. Ergonomics
Table 1. Descriptions of each interruption and the associated primary task that was interrupted.
Scenario and Interruption
Medication Interruption description Primary task at time of interruption
Scenario 1
1 Saline fluids TL asks if there is anything she can get participant from the medication room. Expectation: participant requests heparin or TL offers to get heparin
Preparing fluids infusion
2 Insulin infusion Patient complains of discomfort from the central line on his neck. Expectation: participant readjusts position of lines
Consulting insulin infusion rate algorithm
3 Insulin infusion TL asks if patient has had a chest X-ray, and tells participant to call radiology to follow up. Expectation: participant calls radiology
Preparing insulin infusion
4 Insulin infusion Monitor alarms because oxygen saturation drops to 70%. Expectation: participant silences alarm and re-attaches pulse oximeter peg to patient’s finger (TL removed prior when participant was not looking)
Programming insulin infusion pump
Scenario 2
5 Heparin infusion/ bolus
In charge nurse calls to offer an early shift finish and asks how everything is going. Expectation: participant accepts phone call
Consulting heparin policy and calculating infusion rate and bolus dose
6 Heparin infusion/ bolus
TL notifies participant that one of the patient’s blood tests wasn’t collected properly and offers to re-take it as well as a blood gas (for blood sugar level). TL asks participant where the blood collection tubes are. Expectation: participant hands the materials to TL
Scenario and Interruption
Medication Interruption description Primary task at time of interruption
7 Heparin infusion/ bolus
TL calls to inform participant that the patient’s BSL has dropped significantly (results from blood gas). Expectation: participant consults insulin algorithm and reduces infusion rate
Programming heparin infusion pump OR pushing heparin bolus (whichever came first)
8 Heparin infusion/ bolus
Patient cries out in pain. Expectation participant attends to patient and asks follow up questions
Programming heparin infusion pump OR pushing heparin bolus (whichever came second)
Scenario 3
9 Fentanyl PCA TL2 (watching patient while participant is in medication room) peeks into medication room to ask if participant can hand her some paracetamol for patient who is still complaining of pain. Expectation: participant either gives paracetamol to TL2 or has discussion about why they should wait for PCA first
Preparing fentanyl PCA in medication room
10 Fentanyl PCA TL forgot to bring a PCA pump so TL2 offers to retrieve one. Expectation: TL and participant have a conversation as they wait for the pump
Preparing fentanyl PCA
11 Fentanyl PCA TL answers phone call from patient’s daughter and asks participant to speak to her. Expectation: participant speaks to daughter who is very anxious
Programming PCA pump
12 Fentanyl PCA TL receives a call that the patient’s wife is in the waiting room and asks participant if she can bring the wife in. Expectation: participant answers TL’s question
Providing patient education about PCA pump
Table 2. Participant demographics across conditions.
Demographic 3-interruptions (n = 35)
12-interruptions (n = 35)
Age 20-25 years 26-30 31-34 35-40 41-44 45+ 5 11 6 6 3 4 7 6 9 2 5 6
Gender Male Female
13 22
10 25
Education Diploma Bachelor Graduate certificate Graduate diploma Masters (coursework) Masters (research) 2 18 13 1 1 0 3 14 14 0 3 1 Experience (in years)
Registered nurse: median (IQR)
8 (5-11) 9 (6-16)
Current ICU: median (IQR) 3 (1-6) 6 (2-8)
Table 3. Descriptive statistics for primary and secondary outcomes under 3-interruptions and 12-interruptions conditions.
3-interruptions 12-interruptions
Dependent variable Mean 95% CI Mean 95% CI Ratio 95% CI p value
Clinical errors (total) 1.4 [0.99, 1.75] 2.7 [2.19, 3.29] 2.0 [1.41, 2.83] < .001a
With corrected errors removed 1.1 [0.67, 1.45] 1.9 [1.35, 2.42] 1.8 [1.19, 2.67] .005a
With interruption #7 errors removed 1.4 [0.99, 1.75] 2.2 [1.70, 2.70] 1.6 [1.12, 2.30] .010a
Procedural failures (total) 35.3 [31.74, 38.95] 42.5 [38.65, 46.32] 1.2 [1.05, 1.37] .006a
With corrected failures removed 34.0 [30.49, 37.51] 40.7 [37.22, 44.21] 1.2 [1.05, 1.36] .006a
Documentation (5% of total) 1.7 [1.10, 2.27] 2.3 [1.79, 2.78] 1.4 [0.92, 1.99] .121a
Incorrect/omission (9% of total) 3.3 [2.67, 3.96] 3.9 [3.25, 4.58] 1.2 [0.92, 1.52] .190a
Labelling (17% of total) 6.6 [5.60, 7.60] 6.7 [5.70, 7.67] 1.1 [0.83, 1.24] .902a
Nonaseptic (69% of total) 23.7 [20.99, 26.50] 29.6 [26.50, 32.70] 1.3 [1.07, 1.45] .004a
Tasks done correctly 86.3 [82.80, 89.78] 83.7 [79.94, 87.49] - - .313b
Error rate (%)c 29.7 [26.94, 32.35] 35.0 [32.16, 37.81] - - .007b
Severity ratings (out of 5) Mdn IQR Mdn IQR p value
Clinical errors 1.67 1-2 2.00 1-2 - - .031d
Procedural failures 4.00 4-4 4.05 4-4 - - .242d
a = analysed with Poisson regression.
b = analysed with independent samples t-test.
Table 4. Description of clinical error and procedural failure severity ratings.
Severity Rating
Clinical error description Procedural failure description
1 Incident is likely to have little or no effect on the patient
Action is not best practice/procedure, but is unlikely to have any future consequence
2 Incident is likely to lead to an
increase in level of care (e.g., review, investigations, or referral to another clinician)
Action may lead to an increase in level of care (e.g., review,
investigations, or referral to another clinician), but not in isolation 3 Incident is likely to lead to a
permanent reduction in bodily functioning leading to, e.g., increased length of stay; surgical intervention
Action may lead to a permanent reduction in bodily functioning leading to, e.g., increased length of stay; surgical intervention, but not in isolation
4 Incident is likely to lead to a major permanent loss of function
Action may lead to a major
permanent loss of function, but not in isolation