City, University of London Institutional Repository
Citation:
Chen, S., Andrienko, N. ORCID: 0000-0003-3313-1560, Andrienko, G. ORCID:
0000-0002-8574-6295, Adilova, L., Barlet, J, Kindermann, J., Nguyen, P. H., Thonnard, O.
and Turkay, C. ORCID: 0000-0001-6788-251X (2019). LDA Ensembles for Interactive
Exploration and Categorization of Behaviors. IEEE Transactions on Visualization and
Computer Graphics, doi: 10.1109/TVCG.2019.2904069
This is the accepted version of the paper.
This version of the publication may differ from the final published
version.
Permanent repository link:
http://openaccess.city.ac.uk/21875/
Link to published version:
http://dx.doi.org/10.1109/TVCG.2019.2904069
Copyright and reuse: City Research Online aims to make research
outputs of City, University of London available to a wider audience.
Copyright and Moral Rights remain with the author(s) and/or copyright
holders. URLs from City Research Online may be freely distributed and
linked to.
City Research Online:
http://openaccess.city.ac.uk/
[email protected]
LDA Ensembles for Interactive Exploration and
Categorization of Behaviors
Siming Chen, Natalia Andrienko, Gennady Andrienko, Linara Adilova, Jeremie Barlet, J ¨org Kindermann,
Phong H. Nguyen, Olivier Thonnard, and Cagatay Turkay
Abstract—We definebehavioras a set ofactionsperformed by some actor during a period of time. We consider the problem of analyzing a large collection of behaviors by multiple actors, more specifically, identifying typical behaviors and spotting anomalous behaviors. We propose an approach leveraging topic modeling techniques – LDA (Latent Dirichlet Allocation) Ensembles – to represent categories of typical behaviors by topics that are obtained through topic modeling a behavior collection. When such methods are applied to text in natural languages, the quality of the extracted topics are usually judged based on the semantic relatedness of the terms pertinent to the topics. This criterion, however, is not necessarily applicable to topics extracted from non-textual data, such as action sets, since relationships between actions may not be obvious. We have developed a suite of visual and interactive techniques supporting the construction of an appropriate combination of topics based on other criteria, such as distinctiveness and coverage of the behavior set. Two case studies on analyzing operation behaviors in the security management system and visiting behaviors in an amusement park, and the expert evaluation of the first case study demonstrate the effectiveness of our approach.
Index Terms—LDA, Visual Analytics, User Behavior.
F
1
I
NTRODUCTIONW
Euse the termbehavior, orbehavior instance, to refer to a set ofactionsperformed by some actor during a pe-riod of time. With increasing data availability, behavior anal-ysis attracts growing attention in areas such as e-commerce, computer security, health care, social media etc [1], [2]. Behavior patterns are usually complex, ill-defined and di-verse. Categorization, which involves identifying and char-acterizing existing types (categories) of behaviors, is an important task for understanding and predicting behaviors of customers, users, or patients, as well as for spotting atypical (and possibly anomalous) behaviors. To give a simple example, consider the analysis of activity logs from an e-commerce webpage. Here, theactionsmay be “enter a search text”, “push the search button”, “scroll down”, etc., and abehaviorwhere these actions appear together can be categorized as “product search”.Our paper first investigates the suitability of topic mod-eling for identifying behavior types in a large set of activity logs, i.e., recorded sequences of actions performed by some
actors, such as users of a software tool, visitors of a venue,
and players of a game. This investigation was accomplished through a study conducted by an interdisciplinary team consisting of visual analytics researchers and computer security experts working on a dataset of logged sessions recording the usage of a computer application. We then further tested our approach through a synthetic dataset provided for VAST Challenge 2015. In both studies, we aim to answer the following question:
• S. Chen, N. Andrienko, G. Andrienko, L. Adilova, and J. Kindermann are with Fraunhofer Institute IAIS, Germany. S. Chen is also with University of Bonn, Germany. E-mail: [email protected]
• N. Andrienko, G. Andrienko, P.H. Phong, C. Turkay are with City,
University of London, UK.
• O. Thonnard and J. Barlet are with Amadeus, France. Manuscript received April 19, 2005; revised August 26, 2015.
By considering a set of possible actions as a “vocabulary” and action logs as “texts” built from this vocabulary, can “topics” extracted by topic modeling algorithms be considered as representations of behavior types?
Our study allowed us to answer this question positively, but it showed a need in tools for interactive exploration and comparison of extracted “topics” and selection of a sufficient subset of representative “topics”. Thus, in this paper, we develop such tools as shown in Fig. 1. Besides, we address the problem of representing the behavior topics visually in a way that enables judgment of their quality and comparison between them. The problem is explained as follows.
When topic modeling is applied to texts in natural lan-guages, extracted topics may be represented to the analyst as combinations of topic-relevant words. For example, words that have significantly higher probabilities of occurrence in texts associated with these topics than in texts associated with other topics. Since an analyst can interpret the meaning of the words and judge whether the word combinations make sense, the assessment of the topic quality and use-fulness is straightforward. However, when the “words” are action labels, the meaning of combinations of such labels may not be clear to the analyst. Hence, it may be impossible to judge the topic quality (i.e., whether it represents a mean-ingful behavior type) just by looking at the list of actions that have the highest probabilities. For example, when a topic extracted from a set of text documents is represented by keywords “big data, visualization, machine learning, cloud computing”, it can be easily judged as a good topic that concerns computer science and data analysis techniques. However, if a behavior topic contains “search user, open table, close dialog”, it may be hard to judge its quality.
(a)
(b)
(c)
(d)
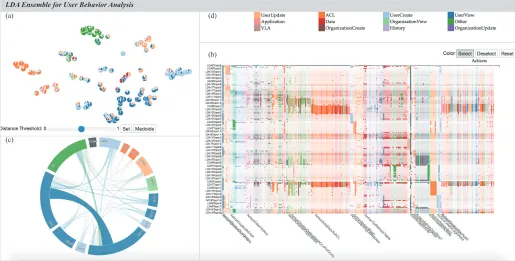
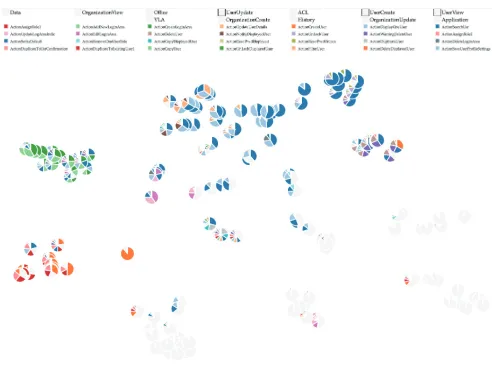
[image:3.612.48.563.47.308.2]LDA Ensemble for User Behavior Analysis
Fig. 1. Visual interface for exploring results of ensembles of topic models. The visualization system includes (a) topic projection view, (b) topic-action matrix, (c) topic chord diagram, and (d) color labels of action classes. We label the topics as “LDA i Topic j” to reflect the LDA run and topic number.
using other criteria such as distinctiveness and coverage.
Distinctivenessmeans clear differentiation between the types
of behaviors represented by the topics. Coverage indicates the proportion of behavior instances that can be affiliated to some behavior types with a high degree of certainty. When the behaviors lacking a clear affiliation with any of the behavior types are few, they can be treated as atypical or possibly anomalous and thus may require a special attention from the analyst. We propose interactive visual tools, namely, a chord diagram and a matrix display (Fig. 1), for visual exploration and comparison of selected topics and assessment of the distinctiveness and coverage of a selected subset of representative topics.
Our contribution can be summarized as follows:
• We investigate and demonstrate the suitability of topic
modeling (as a general class of techniques) for analysis of activity logs with the aim of identifying typical behaviors
• We develop an analytical workflow for behavior anal-ysis and categorization, combining (i) generation of ensembles of models using topic modeling methods and (ii) interactive visual exploration of these models and selection of a subset of topics representing typical behaviors
• We develop a set of visual analytics tools to serve as an example of how the proposed workflow can be supported.
The paper is structured as follows. Section 2 explains the goal and scope of our study and provides the rationale for the choices we made regarding the approaches and methods. Section 3 reviews the related work. After describ-ing the data and introducdescrib-ing the LDA ensemble method in Section 4, we present the visual analytics workflow for identifying behavior categories in Section 5. We demonstrate
the use of the workflow in two case studies (Section 6). Finally, we discuss the limitations and future work (Section 7).
2
R
ESEARCHS
COPEThis section provides justifications for the core decisions made to define the subject and course of our study.
Why use topic modeling for behavior analysis? Topic
modeling is a well-established and widely used class of statistical techniques for obtaining summarized representa-tions of semantics of text documents based on combinarepresenta-tions of words occurring in them [3]. There is a similarity between the task of semantic characterization of text contents and the task of identifying behavior types in action logs. In text writing, the intended topic motivates the choice of words that are used to convey it; hence, the topic can be reconstructed based on the chosen combination of words. Similarly, an actor’s intent motivates the choice of actions that are used to fulfill this intent; hence, the latter can be reconstructed based on the chosen combination of actions. The chosen actions may be indicative not only of the intent but also of the actor’s strategy and preferences; therefore, we use the term“behavior”to refer to a conjunction of factors that motivated an actor to do particular actions.
Topic modeling methods are applied to large collections of documents for identifying common topics that occur in multiple documents. We conjecture that these methods may also be helpful for identifying common types of actors’ behaviors that are realized in multiple action sequences. This is what we test in our paper.
sequences [6], [7]. In topic modeling, texts are represented as “bags of words”, ignoring the sequence in which the words appear. Hence, topic modeling can by no means substitute sequence analysis methods, and this is not what we aim at. What we try to achieve by using topic modeling is capturing the semantics of action logs for understanding actors’ behaviors. From this perspective, which particular actions were taken is more important than the order in which they were performed. Again, there is an analogy with texts: whereas word ordering is important in building sen-tences and ordering of sensen-tences is important for presenting ideas and arguments, the overall content of a document can be sensibly represented by a combination of key words or terms regardless of their ordering in the document.
Topic modeling versus clustering. We also considered
possible use of clustering as another approach to extracting action log semantics. The approach would involve cluster-ing of action logs by similarity, e.g., based on the occurrence frequencies of different actions or their TF-IDF scores [8]. The resulting clusters could be represented by vectors com-posed of statistical summaries of the original attributes, such as the means or medians of the values. This is similar to a result of topic modeling, which consists of vectors of action probabilities. There are several reasons for preferring topic modeling over clustering. First, an acknowledged challenge for clustering is the “curse of dimensionality” [9]. Clustering techniques depend critically on the measure of similarity, or distance, between data points. With the increasing of the number of dimensions, the data become sparse, and the distances between points tend to become relatively uniform, which makes division into clusters quite arbitrary and un-stable regarding slight changes of parameters. Unlike clus-tering, topic modeling techniques are designed to deal with high-dimensional and sparse data, being based on word co-occurrences rather than distances between documents.
While the problem of high dimensionality can be alle-viated by applying dimensionality reduction methods, the reliance of clustering on distances makes this approach not quite suitable when many action logs may contain instances of two or more behavior types. Clustering will not put such action logs together with other action logs where the same behavior types occur alone or in other combinations due to high distances to those action logs. Without a limitation on the required number of clusters, a clustering algorithm would put each combination of behavior types in a sepa-rate cluster. Additional efforts would be required to find commonalities between clusters. As the number of clusters is usually limited, diverse combinations of behavior types may be put in the same cluster, which will be very hard to interpret. In contrast, a basic premise of topic modeling is that any document may concern several topics, possibly, in different proportions; i.e., each document is modeled as a topic mixture. Topics are identified based on term co-occurrences rather than inter-document distances. There-fore, even if there are no documents solely concerned with some topic A but there are documents where A is com-bined with various other topics B, C, D, a topic modeling algorithm is quite likely to find topic A, because the co-occurrence frequencies of the terms pertinent to A will be high while their co-occurrences with the terms specific to B, C, D will be relatively less frequent.
Why LDA?In our study, we wanted to investigate the
general suitability of topic modeling as a class of techniques and even as a concept for identifying and understanding be-havior types. In this regard, the choice of a specific algorithm is largely arbitrary. We chose LDA [10] because it is a highly popular method implemented in multiple open software libraries and known as more general than Latent Semantic Analysis (LSA) [11] and Probabilistic Semantic Analysis (pLSA) [12]. Another quite popular method is nonnegative matrix factorization (NMF) [13], [14]. There are no principal differences between LDA and NMF regarding the inputs and outputs; therefore, NMF could be used for the purpose of behavior analysis in the same way as LDA.
Why ensembles of topic models?Most topic modeling
methods require the user to set the number of topics that need to be extracted. An appropriate topic number may be unknown and hard to guess in advance. Another problem is that many topic modeling algorithms are non-deterministic and produce slightly different results in each run even if the number of topics is the same [15]. Therefore, better understanding of the contents of a text corpus can be gained by examining and comparing results of multiple runs of topic modeling, i.e., an ensemble of topic models.
The comparison needs to be supported by a visual display showing similarities and differences among topics. This can be a projection plot obtained by means of some dimensionality reduction algorithm (MDS, t-SNE, etc.). In a projection, similar topics are located close to each other and dissimilar ones are distant from each other. A clus-ter of spatially close topic indicates the existence of an archetype topic that is discovered by multiple runs of a topic modeling method. In other words, it is the same topic represented slightly differently in different models. The fact that it was found more than once indicates its significance and trustworthiness. Topics that are scattered over a wide area in the plot may be computational artifacts rather than representations of really existing topics. If there are a few topics that are distant from others, the analyst can check their trustworthiness through additional runs of the algorithm with incrementing the topic number in each run. An occurrence of similar topics in the additionally obtained topic models is an evidence of topic significance. Topics that remain far from all others can be ignored. In this iterative and interactive way, the analyst can gain understanding of what and how many topics exist.
Of course, this approach is not scalable to the number of topics and thus cannot be applied to a heterogeneous corpus of documents where the number of topics is very large. However, it can work very well on action logs where the vocabulary (i.e., set of possible actions) is very limited compared to the vocabularies of natural languages.
It may be argued that a suitable number of topics can be determined automatically based on some quality measures [16], [17]. However, what is optimal in terms of statistical indicators in not necessarily the most meaningful and useful to a human. An analyst may gain better under-standing and knowledge of existing behavior types from seeing and exploring a topic space with dense and sparse areas, clusters and outliers.
Why not hierarchical topic modeling? It may seem
removes the need to specify the number of topics in ad-vance and can thus be superior to using ensembles of flat topic models. However, hierarchical topic models have their problems [19], [20], [21]. One problem is that they tend to generate large hierarchies where the overall number of topics is very high. Exploring and understanding such a hierarchy may be challenging. Another problem is that very similar topics may occur in different branches of a topic tree. It is hard to spot these similarities and understand the differences between the topic semantics. It is also question-able whether the idea of topic hierarchy (from more general to more specific topics) is transferable from linguistics to behavior analysis, i.e., whether it is valid to assume the existence of a hierarchy of behavior types. This can make sense in some applications but, possibly, not everywhere, and it may be quite hard to judge whether a computation-ally constructed hierarchy reflects real relationships between behavior types.
Character of the research results. This paper presents an
approach that we developed in the course of the study. We describe a set of techniques that can support the approach; however, this is not a fully operational software system ori-ented to end users. In our study, we evaluated the basic idea and the approach to implementing it but not the utilization of particular software tools.
3
R
ELATEDW
ORKWe discuss works in topic modeling, topic visualization, interactive topic editing, and visual analysis of behaviors.
3.1 Topic modeling
Topic modeling approaches emerged from the information retrieval theory [22]. A predecessor is Latent Semantic Analysis (LSA) [11], which groups documents based on occurrences of common words and simultaneously groups words based on their co-occurrence in same documents. Relationships between words can also be analyzed using word embedding methods [23], which represent words by multidimensional vectors such that the distances between the vectors indicate the word relatedness. LSA was further developed into Probabilistic Semantic Analysis (PLSA) [12], establishing a statistical probabilistic formulation of the technique. Latent Dirichlet Allocation technique (LDA) [10] is a formalism that is closely related to PLSA. The basic idea of LDA is that documents are represented as mixtures of latent topics, where each topic is a distribution over words of a chosen base vocabulary [10]. The distribution of topics, documents and words is modeled using Dirichlet priors (distributions). The PLSA technique can also be modeled as a LDA technique by using special Dirichlet priors. LDA is therefore more general than PLSA. LDA was successfully applied to many different domains, from movement to consumer behavior characterization [24], [25], [26]. In this work, the choice of a specific topic modeling method (LDA or other) is not essential, as explained in Section 2.
There exist many variants of LDA techniques. For ex-ample, Labeled LDA [27] was introduced to find most appropriate tags for text documents among all tags assigned by numerous readers. This gave rise to the idea that topics
might be used as a basis for improving the classification of documents [28]. Dynamic Topic Modeling [29] was pro-posed for applying LDA to time slices of evolving data. There were attempts to integrate human knowledge in the process of topic modeling, for example [30], [31], which can be regarded as human-in-the-loop topic modeling. All of them exploit the ability of humans to judge the correspon-dence of words and documents to particular topics on the basis of textual information. Generally, involvement of a human in the topic modeling process is important for choos-ing appropriate parameters, understandchoos-ing the generated topics, and creating a good set of topics for summarizing the content of given documents. These ideas motivate us to develop an interactive visual analytics process which enables a human analyst to understand, explore, and select good candidates from ensembles of topic models without a prior assumptions of optimal parameter settings.
There are topic modeling algorithms that automate the selection of the topic number, which include hierarchical topic models [18], LDA using KD-divergence measures [16], GSDMM [17], etc. These methods propose their own criteria for determining the suitable number of topics, such as perplexity [18] and divergence measure [16]. All approaches have their advantages and limitations, and there is no single approach suitable for all situations. In Section 2, we provide arguments for enabling a human analyst to explore multiple topic models and select a subset of topics that are the most meaningful and useful from the analyst’s perspective.
3.2 Topic visualization
Topic modeling is a complex process, in which visualization helps the analyst to interpret, understand and explore the process output, i.e., the relationships between documents, topics and words. Representation of a document as a mix-ture of topics, where a topic is a probability distribution over words, makes amatrixa natural representation to visualize the document–topic and topic–word distributions [32], [33]. Interactive matrix visualizations support reordering of rows and/or columns to reveal their hidden relationships. In our work, a matrix is used to visualize the topic–action distribution (Section 5.2) with the topics ordered by sim-ilarity (discussed in Section 5.1) and actions ordered by their probability values for the topics. Such ordering method could help users to understand which topics are similar and why they are similar with regard to the actions involved.
Alternatively, a node-link diagram can be used for the same purpose. R ¨onnqvist et al. [34] map the topic–word distribution to a force-directed graph layout with nodes representing both topics and words. Links connect words and topics with distances proportional to the corresponding probability values. ContextTour [35] superimposes acontour map over a word graph to depict the density distribution of all words. FacetAtlas [36] adds colored curves on top of the map to display different types of relationships be-tween words. For exploring relationships bebe-tween topics, we project them into a 2D space based on the word proba-bilities (Section 5.1) and build chord diagrams showing the topic similarity in terms of shared documents.
topics using the river metaphor [39], mapping the number of documents concerning a topic to the width of the topic flow at every time segment. Beyond changes in topic magnitudes, TextFlow [40] explores relationships between topics over time, focusing on how the topics appear, disappear, split and merge. When the number of topics is large, it is challenging to understand them and their relationships. This can be facilitated by organizing the topics into a hierarchy and supporting its exploration [41], [42]. TopicPanorama [43] supports exploration and comparison of topics discussed in texts from multiple sources. Our support to exploring a large number of topics is a projection display showing topic similarities and interactive tools for selecting and examining representative topics.
Beyond examining topics from a single model, topics from multiple models have also been compared. Alexander and Gleicher [44] compute topic similarity using the word vector representation of a topic and align topics in two different models to show how they match or mismatch. The authors also use the document-topic matrix to cluster docu-ments, allowing them to compare two topic models on how they affect the clustering results. Chuang et al. [45] propose a metric for assessing the topic quality by matching topics against reference concepts defined by domain experts. This approach is hardly generalizable to contexts like ours, where there are no predefined concepts that could be used as ground truth. Another work from Chuang et al. [15] exam-ines the stability of topics from multiple algorithm runs with identical parameters. That paper echoes the motivation of our work regarding the unstable nature of topics produced by probabilistic modeling algorithms. Our paper proposes an ensemble method that combines results from multiple modeling runs and supports comparisons and interactive selection of suitable topics.
3.3 Interactive topic editing
The complex, often stochastic, and parameter-dependent nature of topic models motivated the development of in-teractive methods that enable analysts to intervene in the topic modeling process. Lee et al. [46] utilize results of topic modeling to identify “soft” clusters of documents. Their approach is one of the earliest examples of provid-ing interactive ways to refine topic models by adjustprovid-ing the keywords, filtering the data, and directly manipulating the clusters through operations such as splitting, merging or removing. Hoque and Carenini [47] note that results of topic modeling can be noisy and fail to match users’ information needs. They propose a topic modeling system for asynchronous conversations that revises the model on the fly on the basis of users’ feedback. Pavia et al. [48] devised a method where analysts provide correct labels for misclassified data instances (similar to active learning [49]) to improve classification performance. Choo et al. [50] com-ment on the inconsistency of topic models when they are run multiple times. As a solution to this, they suggest the use of non-negative matrix factorization as a more stable approach and support interactive editing of a topic model through keyword refinement, topic splitting, merging, and creation. Kim et al. [51] present an approach that can be called progressive topic modeling, in which a selected topic
can be refined by applying the topic modeling algorithm to the subset of documents affiliated to this topic.
The specifics of our problem renders the approaches involving interactive improvement of a topic model un-suitable. The analyst may have no preliminary ideas as to what kinds of topics (i.e., behavior types) might exist, and topic goodness cannot be judged just from seeing the most representative action labels, which is different from seeing combinations of well-known words of a natural language.
Alexander and Gleicher [44] extend the set of core tasks in topic modeling from building a single model to com-paring multiple models. The authors propose methods to align and compare topic models computationally, and resort to visualization techniques to communicate the computed similarities and differences. El-Assady et al. [52] introduce a procedure of progressive learning of topic models and their parameters reinforced by analyst’s feedback from topic comparison.
The potential of involving human analysts in topic mod-eling has also been investigated in the machine learning literature. Andrzejewski et al. [53] propose an approach in which domain knowledge is incorporated into topic modeling by specifying “must-link” and “cannot-link” re-lationships between terms, i.e., what terms are likely or unlikely to have high probabilities in the same topics. Hu et al. [54] suggest an enhanced tree-based topic model that can incorporate analysts’ feedback on the quality of topics by re-learning the aspects that analysts find inappropriately represented. The authors argue that such interactive meth-ods lead to richer and better adopted models and discuss the important role of involving human experts into machine learning approaches.
In our work, we build on these studies and draw ideas and inspiration from them. In most of the approaches dis-cussed, the emphasis is on refining a single topic model or on comparison of two models. Our approach differs by generating multiple topic models, which add a new layer of information for analysts to interact with.
3.4 Visual analysis of behaviors
presented to the users as visual summaries of their work, allowing them to reflect on how their day-to-day work routines are organized.
User behavior analysis has also been used for identifying anomalies [63]. Pannell and Ashman [64] demonstrate the potential of using such approaches in the context of cyber se-curity through building user profiles based on features such as keystroke profiles and applications used. Even though this area is growing, the use of visualization to support behavior analysis has not been discussed yet.
Differently from the previous works, our research stud-ies the suitability of the topic modeling concept for identi-fying latent behavior types and defines the visual analytics methods and procedures needed for supporting this task.
4
LDA E
NSEMBLES FORB
EHAVIORD
ATAIn the following, we describe our approach by defining our core terminology and explaining how topic modeling is used. We define a set of domain agnostic analysis tasks for behavior categorization through topic modeling. We illustrate the concepts with an example based on data stem-ming from a Logon and Security Server (LSS) management and control system as gathered in the context of a multi-disciplinary research project.
4.1 Definitions and data description
We define abehavior, or behavior instance, as a combination
ofactionsperformed by some actor during a period of time.
One actor may have one or multiple behavior instances. Actions may belong to specific classes.
Our illustrative example, LSS, is based on logs from a digital application where the user base of an organization is managed through user authentication, access control and sophisticated user rights assigned to individuals and offices. The LSS data set consists of 14,929 sessions performed by system operators; A session consists of multiple actions, for example, “Search User”, “Display One User”, “Create User”, “Create Login Area”, etc. There are 296 distinct actions. These actions can be grouped into classes by do-main experts. For example, the actions for searching and displaying a user can be in “User View” class, while creating a user or a login area can be in “User Create” class.
The existence of action classes is not essential for the idea of behavior modeling with LDA. However, it is difficult to represent a large number of individual actions in visual displays in a comprehensible way. Similarly to Monroe et al. [5], we utilize action classes for creating simpler views. Another example of using action classes can be given based on the IEEE VAST Challenge 2015 story [65], in which visitors of an amusement park attended attractions grouped in 12 classes, such as “thrill rides”, “shopping”, “food”, etc. Here, the actions are the visits of different attractions, and the attraction classes can be treated as action classes.
We support the use of several alternative classifications when available, as this can help to (a) vary the level of detail (bigger/smaller sets of action classes, different levels in a class hierarchy, if it exists) and (b) look at modeling results from different perspectives (different themes).
4.2 LDA for behavior data
The LDA technique was originally proposed by Blei [10] to detect latent topics in a collection of documents, each of which contains a set ofwords. The input to LDA consists of a document-word matrix DW, whereDWij represents
the frequency of word j in document i. LDA produces a set of topicsT, a topic-word matrixT W, and a document-topic matrixDT.T Wkjspecifies the probability of wordj
in topick, whileDTikrepresents the probability of topick
in documenti. The probabilities are numeric values ranging between 0 and 1.
In our approach, we treat theactionsaswordsand each
behaviorcontaining multiple actions as adocument. Thus,
[image:7.612.337.539.346.422.2]we can find latenttopicsof behaviors (Fig. 2), which can be seen as distinct behavior types, or categories.
Fig. 2. The idea of using LDA for behavior analysis: analogously to deriving topics from documents consisting of words, we can derive topics representing behavior categories in terms of actions.
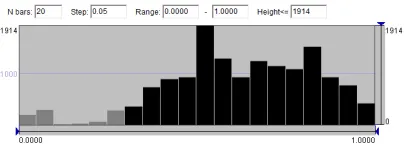
Fig. 3. The use of a histogram of the distribution of the maximal topic probabilities for choosing a suitable value for the behavior-topic asso-ciation threshold. The black bars correspond to the probabilities0.3or higher.
We shall use the terms affiliated and associated for denoting relationships between behaviors and topics. A behavior isaffiliatedto a topic if this topic has the largest probability for this behavior. A behavior isassociatedto a topic if its probability of this topic is larger than a given threshold; hence, one behavior can be associated to zero, one, or multiple topics. A meaningful threshold value can be chosen based on inspecting the shape of the statistical distri-bution of the maximal topic probabilities for all behaviors, so that only a small fraction of behaviors remains not asso-ciated to any topic while the threshold value corresponds to a notable upward turn in the shape of the probability curve. At the same time, the threshold value should not be too low, to avoid many behaviors being associated with two or more topics. In our case, we found0.3to be a good threshold value; see Fig. 3. With this value, 852 behaviors out of 14,929 (i.e., 5.7%) are not associated to any topic. Such behaviors are put in a special group called “other”.
Apart fromαandβ, LDA requires setting of parameter N, which is the number of topics to extract. An appropriate topic number is often not known in advance. To cope with this problem, we propose to use LDA ensembles, where LDA runs multiple times with different values of N. The combined results of such an ensemble provide a set of candidate topics to select from.
4.3 Tasks in behavior categorization with LDA
Due to the lack of explicit semantics associated with behav-iors as discussed earlier, the interpretation of LDA results obtained for behaviors is more challenging than for textual data. For example, the relationship between actions “search office” and “assign role” is not as clear as the semantic relat-edness between words “Germany” and “European”. Hence, we need to provide tools helping analysts to understand, compare, and evaluate behavior topics and on this basis select appropriate topics representing behavior categories. The tools need to support the following tasks:
• T1: See and understand similarities and differences
among topics. Groups of similar topics coming from
different LDA runs are highly likely to represent inher-ently existent behavior types.
• T2: Explore the features of the topics. The features
characterizing the topics include the action probabili-ties for the topics, the sets of affiliated and associated behaviors, and the action frequencies in these sets. By analyzing these features, analysts can gain a deeper understanding of the topic properties.
• T3: Make a selection of representative topics. The
analyst must be able to make informed selection of rep-resentative topics and interactively modify the selection made.
• T4: Evaluate the topic selection.The analyst should be
able to check the suitability of a selected topic subset for categorization of behaviors. The topic subset is evaluated regarding the distinctiveness among the top-ics (i.e., low intersections among the topic-associated groups of behaviors) and the coverage of the behavior set (i.e., low number of behaviors that are not associated with any topic).
5
I
NTERACTIVEV
ISUALA
NALYTICS OFLDA E
N-SEMBLES
To support the defined tasks, we propose a suite of tools (Fig. 1) including topic projection, matrix visualization of topic features, chord diagram for groups of topic-associated behaviors, and multi-level color labels of actions (Fig. 4).
5.1 Projecting multiple ensembles of topics
To reveal similarities and differences among topics (T1), commonly used projection (a.k.a. embedding) methods, such as MDS [67] or t-SNE [68], can be employed for projecting the topics onto a 2D space (Fig. 1a). Such methods proved to be suitable for visualization of topic modeling re-sults [50], [51], [69], [70]. The projection is based on the inter-topic distances derived from the action-in-inter-topic probabili-ties. The distance between two topics is determined by the
accumulated differences of the probabilities of action occur-rences in the topics (accumulated Manhattan distance [71]). In the visual display of the projection results, topics are represented by pie chart glyphs showing the probability distributions of action classes. The segments in each pie chart are drawn in the order of decreasing probabilities of the action classes. The analyst can apply different action classifications to vary the level of detail and/or the themes. From the glyph distribution in the projection space, analysts can assess the similarities and differences among topics and on this basis interactively select representative topics. The visual similarities and differences between the glyphs them-selves provide additional information for judging topic sim-ilarity, so that the analyst does not have to fully rely on the distances in the projection. The commonly acknowledged disadvantages of pie charts (see, e.g., [72]) refer mostly to the accuracy in estimating and comparing numeric values. In our case, the pie charts are intended to be used not for estimating exact values and differences but for noting whether closely located topics appear sufficiently similar. No detailed examination of the pie segments is required; the pies can be perceived as wholes; moreover, clusters of close similar pies can also be perceived holistically (Fig. 1a). The combinations of the colors occurring in different parts of the projection display give a general idea concerning the respective kinds of behaviors.
The projection display serves as an overview, an interac-tive panel, and a representation of the current selection.
5.2 Visualizing features of topics
To gain a detailed understanding of the topic features in terms of the action probabilities (T2), we visualize the data from the topic-action matrices T W (Section 4.2) received from the LDA ensemble by means of a matrix display (Fig. 1b). The columns correspond to the actions and the rows to the topics (all or selected). The colors in the cells encode the action classes. The vertical ordering is based on the similarity of the topics, which is consistent with the topic projection view. The horizontal ordering is done according to the descending action probabilities following the vertical arrangement of the topics. This means that actions with high probabilities for the first topic are put in the beginning, following by not yet included actions with high probabilities for the second topic, and so on. Such an ordering method is intended to facilitate observing the commonalities and differences between similar topics.
To support the identification of the key actions involved in the topics, we encode the action probability by the color opacity. The linear mapping of the probabilities to the opac-ity levels may not work well for probabilopac-ity distributions with high peak values. To mitigate this problem, we propose a mapping involving a thresholdt.
Opacity(x) =
(
0.9∗(x−min)/(t−min), x < t
Multiple Runs of LDA
Action Matrix Chord Diagram
Action Relation Behavior Relation
Different parameters
Topic Projection Behavior Data
Behavior Action
α β
z wN M θ
α β
z wN M θ
α β
z wN M θ
Add subgroups Brush for Details Observe Overlap
Creating Medoids Editing Medoids Removing Medoids
Representative Topics
Understanding of Behavior Features Categorized Data for Analysis and Prediction
Multiple levels of action classification
Interactive Exploring Word / Document Feature Space
Document Word
Data Preprocessing Insight
[image:9.612.52.568.42.201.2]Iterative Verification and Selection Topic Similarity and Distance
Fig. 4. Visual analytics tools enabling interactive extraction and exploration of behavior categories with the use of topic modeling. Analysts can select representative topics and modify the selection after understanding the topic features, their capabilities to differentiate behaviors, and the coverage of the behavior set.
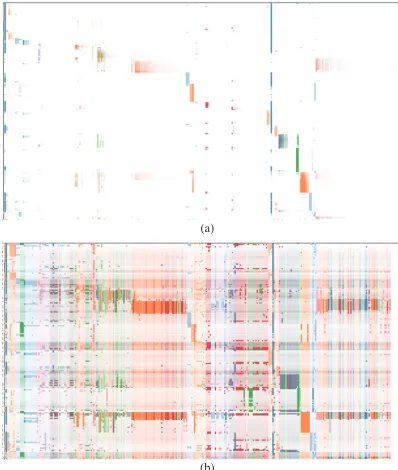
(a)
(b)
Fig. 5. Matrix color opacity scale settings. (a) Highlighting extreme values. (b) Showing details of value distributions.
important details, the threshold can be set based on the outlier definition from Tukey’s fences [73]. The threshold is calculated based on the interquartile range.
t=Q3+k∗(Q3−Q1) (2)
In Fig. 5b, k has been set to 3. One can observe both dominant actions and actions with lower probabilities.
The representativeness of a current topic selection with respect to the behavior set can be judged based on the amount of intersection between the topics, the numbers of the associated behaviors, and the number of behaviors without topic association. To support judgments based on the topic intersections, we propose to use a chord diagram (Fig. 1 c), in which the selected topics are arranged in a circular layout and connected by arcs that express their relationships. The width of an arc represents the amount of intersection between the connected topics, i.e., the number of behaviors associated to both topics. The topics in the diagram are shown in the colors of their dominant actions,
and the same colors are used for the arcs. When an arc connects topics with different colors, it is divided into two parts having the same colors as the topics at the respective arc ends. In response to interactive hovering on an arc representing a topic, the links of this topic and the linked arcs are highlighted and the remaining arcs and links faded. This facilitates observing intersection relationships of any particular topic.
To provide more details for the behaviors, we propose a matrix view of affiliated behaviors, which is similar to the previously described matrix of topics, but here the rows correspond to behaviors rather than topics. Both matrices have consistent ordering of rows and columns. The behavior matrix shows features of the topic-affiliated behaviors in terms of the action frequencies (Fig. 9). High similarity between the topic and behavior matrices indicates good rep-resentativeness of the topic selection. Inconsistencies, such as existence of actions with high frequencies in multiple behavior groups while their probabilities in the respective topics are low, indicate the need of updating the selection by adding topics with high probabilities of these actions.
5.3 Selection of representative topics
The proposed approach to topic selection (T3) is based on interactive grouping of topics by similarity and picking a representative topic from each group. The analyst defines a topic group by interacting in the projection display. The group medoid, i.e., the topic with the minimal distances to all others, is automatically selected as the representative. Currently selected medoids are highlighted in all views by black strokes (Fig. 1). Alternatively, a representative topic could be created by computing the average or median prob-ability values among all candidates. The medoid approach has two advantages. First, the medoid is not affected by extreme values in outliers, in contrast to the average value. Second, the medoid is one of the existing topics with known probabilities for the behaviors whereas constructing a new representative topic requires additional calculation of its probabilities.
5.3.1 Interactive definition of topic groups
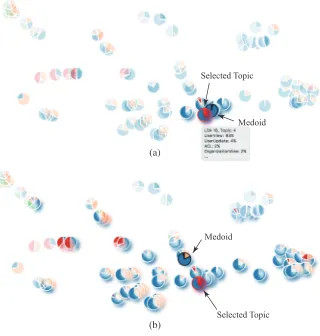
[image:9.612.72.271.247.482.2](a)
(b)
Selected Topic
Selected Topic Medoid
[image:10.612.95.255.51.219.2]Medoid
Fig. 6. When the analyst clicks on a topic of interest, the system selects other topics within the distance less than a given threshold: (a) using a small threshold (0.1), (b) using a large threshold (0.7).
free-form brush for outlining a visually perceived dense cluster of topics in the projection display. In this operation, the analyst considers not only the relative positions of the topics in the projection space but also the visual similarity of the corresponding pie charts. Taking into account that the distances in the projection space may not be proportional to the distances in the high-dimensional feature space, we also enable the second interaction method. The analyst can click on a topic of interest, and the system responds by selecting all topics within a given distance from this topic in the feature space (Fig. 6). The medoid of the group defined in this way may not be the same as the originally selected topic.
5.3.2 Group exploration and editing
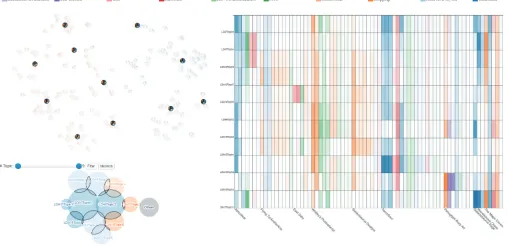
Multiple interaction techniques support the exploration of topic groups (Fig. 7). The action probabilities for selected topics are visualized in the matrix view. For example, Fig. 7c exhibits several subgroups with different combina-tions of dominating accombina-tions. The accombina-tions mostly belong to two classes, ACL (Access Control List) and Applications. The class ACL (orange color) includes “Add data to ACL, Create ACL for role, Filter roles for ACL, Delegate ACL”, etc. The class Application (red color) includes “Display one application, Manage app role, Filter roles for app, Find app in tree”, etc. The columns and rows can be filtered by brushing the axes in either select or unselect mode. Thereby, the analyst can select regions of interest and drill down to a detailed view of the action-based features of the selected topics (Fig. 7d). In this example, the analyst has brushed the group G1 on the Y-axis and deselected the actions with low probabilities by brushing the X-axis. The detailed inspection may suggest a need in subdividing the group into subgroups (G2 and G3), as in Fig. 7b. Group subdivision is done by interacting with the matrix, and the results are reflected in the projection view.
After exploring a group of topics, the analyst may want to expand or shrink it. Groups are edited by direct inter-action in the topic projection. For example, analysts can re-brush on the topic projection to update the groups (Fig. 7a).
The analyst can also dynamically change the threshold that is used for defining groups based on the topic distances to representative topics. It is done by dragging the slider in the control below the topic projection view (Fig. 1a). In the chord diagram, the analyst can observe whether there are large intersections between selected topics, and, if needed, modify the corresponding groups in the topic projection.
5.3.3 Removing a topic from the current selection
The analyst may decide to remove a topic from the current selection if the number of associated behaviors, which is represented in the chord diagram, is too small. Another possible reason for removing a topic from the selection is a high intersection with another selected topic. The analyst can remove a topic by clicking on the topic band in the chord diagram. Since each topic in the selection is a group representative (medoid), topic removal results in destroying the group it represents, i.e., the topics become ungrouped. The analyst can then perform another selection among the unselected topics, to examine a new medoid.
5.4 Progressive categorization of behaviors
We formulate criteria for evaluating a topic selection (T4) and then introduce interactive operations that support the process of progressive definition of behavior categories through iterative assessment and revision of topic selection.
5.4.1 Criteria for evaluating topic selection
The selection of a subset of topics to represent behavior types is guided by the following criteria, whose relative importance may vary depending on the data properties and analysis goals:
• Distinctiveness.Understanding intersections between
topics is needed for deciding if each topic is unique and irreplaceable. This criterion is discussed in more detail below the list.
• Coverage of behaviors. The selected topics should
jointly cover most of the existing behaviors. The amounts of associated behaviors covered by the se-lected topics are shown in the chord diagram (Fig. 1c), and a special group labeled “other” consists of the currently uncovered behaviors.
• Patterns of action probability distributions.The
dis-tribution patterns of the actions, which are visible in the matrix view (Fig. 1b), indicate whether a topic is a general or a specific one.
• Consistency between topic-affiliated behavior
fea-tures and topics’ action feafea-tures. For a good topic
selection, it is expected that the action frequencies in the affiliated behaviors are consistent with the action prob-abilities in the topics. The comparison of the behavior features to the topic features is supported by juxtaposed matrices (Fig. 9). When a mismatch occurs, the analyst can see which features are not correctly captured by the current topic selection.
G1 (ACL & Application)
G2 (ACL)
G3 (Application) G1 (ACL & Application)
G2 (ACL)
G3 (Application)
G1 (ACL & Application)
G1 (ACL & Application) with filtered actions
Interactive Filtering
Sub groups reasoning
(a)
(b) (c) (d)
[image:11.612.55.561.42.204.2]Example representative ACL actions: Add data to ACL, Create ACL for role, Filter roles for ACL, Delegate ACL Example representative Appl actions: Display one application, Manage App Role, Filter roles for App, Find app in Tree
Fig. 7. Matrix exploration and editing of topic groups. (a) A topic group is selected in the topic projection, and (c) three sub-groups (G1, G2 and G3) are identified in the matrix view. By brushing in both axes for filtering, details for Group G1 are selected and shown in (d) matrix visualization and (b) topic projection.
main reason for using topic modeling rather than clustering. Hence, a high amount of shared behaviors between two topics observed in the chord diagram (Fig. 1c) should not be treated as a sign of alarm, but it indicates a need in a detailed inspection of these topics using the projection and matrix views (Fig. 1a,b). If it turns out that the topics are quite similar, it is reasonable to remove one of them or replace this pair of topics by one topic located in the projection view between them and thus likely to be similar to both these topics. If the topics are distinct but almost all behaviors associated with each of them are shared with the other, it is an indication of an excessive specificity of these topics and a high likelihood of the existence of a more generic topic that combines the features of both topics. The topic projection view can help the analyst to find such a unifying topic for replacing the pair of excessively specific topics. If the fraction of the shared behaviors is not very high, both topics can be considered suitable. Hence, the application of the distinctiveness criterion is highly reliant on the analyst’s judgments based on interactive exploration of the topics.
5.4.2 Inspection and revision of topic selection
For selected topics, the analyst can explore the action proba-bility distributions at different levels of detail by interacting in the matrix view. Action classes (Fig. 1d) can be selected or de-selected for considering actions of specific classes in more detail. Other views are updated according to the operation (Fig. 8).
Once the analyst has selected some topics, behaviors that are not associated to these topics (i.e., the probability is less than the threshold) are put into the special group “other”. A good selection should make the “other” group as small as possible, but its size may not reach zero, since behavior outliers may exist. When the analyst clicks on the group “other” in the chord diagram, the yet not grouped topics to which the respective behaviors are associated are highlighted in the topic projection. This suggests the analyst where in the projection space the next group should be made. Blurred shading is applied to already explored topic groups (Fig. 6), informing the analyst of the current state of the process. These hints guide the analyst in exploring groups and adding new groups. Blurring is not applied
Fig. 8. By clicking on the color labels that correspond to action classes, the analyst can select or exclude specific classes of actions for/from the visualization. “User View”, “User Create” and “User Update” classes are selected for investigating detailed distributions.
to group medoids, and their distribution in the projection space indicates how diverse they are.
The analyst may select representative topics for in-specting the action frequency distributions in the affiliated behaviors (Fig. 9). The matrix view of action frequencies shows how representative each topic is and whether not yet captured behavior patterns exist. For example, Fig. 9b reveals that there are combinations of actions from classes “User view” (blue) and “Office” (green) that are not repre-sented by any of the selected topics. This indicates a need in adding a new topic. The analyst can find suitable topics with high probabilities of the underrepresented actions and create a new group, the representative (medoid) of which will be added to the current topic selection (Fig. 9c). The action frequencies view is updated reflecting the behaviors affiliated to the topic added (Fig. 9d).
5.5 Rationale for the visualization design choices
[image:11.612.315.561.246.436.2](a) (b)
(c) (d)
Topics Behaviors
Behaviors Topics
Actions Actions
[image:12.612.49.301.43.253.2]Actions Actions
Fig. 9. Iterative exploration and revision of topic selection. (a) Action probabilities for the topics. (b) Action frequencies in the behaviors affil-iated to the topics of (a). (c) For a group of poorly represented actions, the analyst adds a new topic to the selection. (d) The action frequency view is updated according to the modified topic selection in (c).
5.5.1 Visualization of inter-topics similarities
Visualization of inter-topic similarities is necessary for sup-porting taskT1(Section 4.3). We do this using the technique of dimensionality reduction, which is a common approach to supporting detection of clusters (i.e., groups of similar items) in multidimensional data, in particular, LDA out-puts [74]. This technique creates a two-dimensional arrange-ment of topics, where we use pie chart glyphs to represent the probabilities of action classes for the topics (Fig. 1a) in order to provide additional information for assessing the similarities among neighboring topics in the projection. The need in such additional information exists because the distances in the projection space may not accurately reflect the distances in the multidimensional space. Glyph components are ordered consistently for all topics, which facilitates comparisons. The use of the glyphs in the topic projection has been explained and discussed in Section 5.1. In addition, it can be noted that the common practice to rep-resent topics by several most significant words [50], [51] is less suitable in our case, where the “words” are action labels. As we explained earlier (in Introduction and Section 4.3), semantic relatedness of actions may be hard to judge from their labels. Another problem is that action labels may be quite long, and putting them in the projection display may introduce much clutter. Instead, topic details, including the significant actions and their probabilities, are shown upon mouse hovering on the topic glyphs. TaskT3(Section 4.3) is supported by interactive topic grouping operations in the projection view.
5.5.2 Visualization of action probabilities distributions
Visualization of action probabilities distribution is necessary for supporting taskT2(Section 4.3). A matrix visualization is naturally suitable for this purpose since action probabili-ties for the topics exist in the form of topic-action matrices in LDA outputs. For consistency, the same visualization is used
to show the action frequencies in topic-affiliated behaviors (Fig. 9). Topic comparison and selection are supported by interactive operations.
5.5.3 Visualization of topic intersections
Detecting overlapping topics is one of the main subtasks in the evaluation task T4 (Section 4.3). During the design process, we considered three candidate visualizations: Venn diagram, matrix, and chord diagram. A Venn diagram is good for showing set intersections when at most three sets overlap but does not scale to complex cases. Matrix visu-alization represents topics with rows and columns; hence, each intersection is shown twice, which is space-inefficient and can lead to confusion. Showing only half of the matrix removes the duplication of information but leaves space unused, and this issue is more noticeable with increasing number of selected topics, which also increases the size of the matrix. In contrast, a chord diagram has a constant size irrespective of the number of selected topics. In this display, the amounts of topic-associated behaviors are represented by the sizes of the arcs that make the outer circle, and topic intersections are shown by links inside the circle. A potential drawback is visual clutter due to link intersections. How-ever, such cases indicate a need to improve topic selection; hence, the disadvantage transforms into an advantage for the analysis process.
6
C
ASES
TUDIESThe main question we investigate here is: Can topic mod-eling produce results that can be treated as representations of
meaningful behavior types? To answer this, we performed a
case study in a particular application area (cyber security) and consulted domain experts to judge the results of the analysis. The answer was positive, which also means that the combination of tools and the procedure we used for performing the analysis worked well.
To test the generality of the approach, we conducted an additional experiment with synthetic data concerning customers’ behaviors provided for the IEEE VAST Challenge 2015 [65]. In both use cases, we used an ensemble of 18 LDA runs with the parameter N (topic number) ranging from 2 to 19, producing 189 candidate topics. Generally, the chosen upper limit forN should be slightly larger than the expected maximal number of distinct behavior types in a given domain.
6.1 User behaviors in LSS
As introduced in Section 4.1, this dataset contains 14,929 sessions (behaviors) with 296 distinct types of actions per-formed over a period of 30 days. These actions have been organized into 12 classes by domain experts. The number of performed actions in a single behavior ranges from 1 to 893, whereas a majority of the behaviors consist of 6 to 14 actions. The motivation for the analysis was to understand what behaviors are typical, with an outlook to use this information for detecting anomalies.
are not considered. This eventually leads to inaccuracies and high numbers of false positives, leaving the experts in need of improving the model. One viable strategy is to investigate how the model performs for different behavior types in terms of action combinations. However, the behavior types are not known and need to be defined – the problem which our LDA-based approach is designed for. The analysis reported below was performed by the tool developers in cooperation with the domain experts, who provided their feedback on the results and set further questions that guided the analysis process.
6.1.1 Interactive exploration process
In a projection view of the results of the LDA ensemble run, we observe several dense groups of topics represented by similar glyphs (Fig. 1a). From these dense groups, we select representative topics, such as the topic “LDA6Topic4” with dominating actions from the class “Office” (Search Office, Display Office, etc.). However, not all topic groups are homogeneous, which is indicated by differences in the dominating colors. We brush the orange and pink topic regions (ACL and Application-related actions, respectively) (Fig. 7). By drilling down to the details, we find out that there are three distinct subgroups, G1 focusing on ACL and Application, G2 focusing on ACL, and G3 focusing on Application. Since the number of behaviors covered by the whole group is not large, we choose to select the medoid within G1 and thus avoid making several small behavior categories. The result represents the behaviors related to both ACL and Application actions.
In the regions in the projection space where the topics are not dense, we define groups by clicking on topics having more neighbors than others and using the function of automated selection of similar topics, for which we set a small distance threshold of 0.1 (Fig. 6a). As already consid-ered groups are shaded by blurred colors, it is easy to see which parts of the projection space are not explored yet. We find that the remaining topics are mostly dominated by three classes of actions, “User View”, “User Create” and “User Update”. We focus on these action classes by unselecting the others for a detailed examination of the probabilities of the actions from these classes. This facilitates seeing the differences among the remaining topics in terms of the probabilities of the individual actions from these classes and helps us divide the topics into subgroups, whose representatives (medoids) are added to the topic selection. For example, seeing that the action “User Display” is often accompanied by “User Unlock”, we make a subgroup of topics where this pair dominates.
6.1.2 Analysis and modeling result
With the progressive exploration process, we come to a selection of 13 topics from different LDA runs, with the minimal number of 238 and maximal number of 3,445 affiliated behaviors per topic. The topics have been inter-actively examined and evaluated with regard to the criteria introduced in Section 5.4.1 using the corresponding tools. The selected topics are treated as representations of behavior types and make together a behavioral topic model. This model can be used for determining the types of existing and new behaviors in the following way. For each session,
the model determines the probability of each topic. If there is a single topic with a high probability while all others are low, this session is an instance of the respective behavior type. This means that the behavior is typical, i.e., normal. The highest topic probability value can thus be treated as a measure of behavior typicality, or normality. When all topic probabilities are low, it may mean an atypical, strange behavior, which may require detailed examination. When two or a few topics have relatively high probabilities compared to the others, the behavior may be a mixture of the corresponding behavior types. How normal this mixture is, can be judged from the amount of intersection between the topics, i.e., the number of shared associated behaviors in the historical data.
6.1.3 Representation of behaviors for expert evaluation
In the analysis, the relationships between the topics, actions, and behaviors were inspected using the matrix displays. However, this representation is not well suited for commu-nicating analysis results to the domain experts. For them, it is more convenient to see only the essential (highly probable) actions of each topic and only the actions with sufficiently high frequencies in behavior groups, whereas the matrix displays include lots of irrelevant details. For experts’ convenience, we chose a different visual representa-tion of behaviors. We created a two-dimensional projecrepresenta-tion of the set of actions based on the median pairwise distances between the action occurrences in the sessions. The actions that often occur together in a session tend to appear close in this “action space”. Each session can be represented as a trajectory in this action space. Multiple sessions can be aggregated into a flow map [75], in which actions are linked by arcs, as in Fig. 10, or by half-arrows, as in Fig. 11, with the widths proportional to the number of times when one action is immediately followed by the other. The probabilities or frequencies of the actions can be represented by sizes of dot symbols drawn at the actions’ locations. Actions with near-zero probabilities or frequencies can be hidden to reduce the display clutter and show only essential information. The flow map technique can be applied, in particular, to the sets of topic-affiliated behaviors. The resulting “maps” can serve as visual representations of the topics (Fig. 10). The flow map technique can also be used for representing a single session (Fig. 11) or a set of sessions performed by a user. The representation of behaviors and groups of behaviors as trajectories and flows in an artificial space leverages our previous experience on semantic representation of mobility behaviors [76].
6.1.4 Expert verification and feedback
For checking the validity of the behavioral topic model, the domain experts were asked to assess the model and its results and provide their feedback in respect to the following questions:
1) whether the selected topics can be treated as represen-tations of sensible categories of normal behaviors of the LSS system operators;
2) whether high typicality values can be indicative of behaviors being normal;
Fig. 10. Examples of topics represented by flow maps. A: Update user data; B: Check organization data; C: Create users and assign roles; D: Update application.
Validity of extracted behavior types
We assigned meaningful labels to the 13 topics selected based on the most typical actions in the topic-affiliated sessions. The labels are: Create login area, Edit login area, Create users and assign roles, Remove a role of a user, Duplicate a user, Check user data, Update user data, Unlock user and reset password, Update application, Assign ACL, and Check
organization data.. The topics were presented to the experts
in the form of flow maps, as in Fig. 10. The experts agreed that 12 of the 13 topics can be seen as representing sensible behavior types. Selected examples of sessions affiliated to the topics were judged as normal behaviors. One exception was the topic “Update application”. In the expert’s opin-ion, this topic mixes application-focused and ACL-focused operations and should rather be replaced by two distinct topics. This suggestion was later fulfilled using the tools for editing topic groups (Section 5.3.2). Essentially, the experts’ feedback suggests the positive answer to the question 1.
Assessment of typical and atypical behavior instances
Examples of typical and atypical behaviors were presented to the experts in the form of flow maps. In general, the experts gave positive feedback noting that our approach to behavior modeling provided new investigating perspectives for them.
All examples of behaviors with high typicality values were judged as normal sessions by the experts, which gives a positive answer to question 2 and confirms the possibility to use the behavioral topic model for behavior type recog-nition. There were several examples with high typicality according to the topic model but also high anomaly scores assigned by the currently used model. The experts agreed that these behaviors are quite typical in terms of the actions performed and commented that the high anomaly scores could be false alarms of the current model or could be assigned based on other features of the sessions, such as the IP address or user information.
[image:14.612.55.294.43.205.2]For obtaining an answer to question 3, the experts were shown examples of sessions with very low typicality values. These included sessions that received high and low anomaly scores from the current model. A few sessions are shown in Fig. 11. Out of 10 example sessions with high anomaly scores, 5 were judged as somewhat strange and others as rather normal despite of the high scores. Likewise, out of
Fig. 11. Flow maps represent examples of sessions with high (A) and low (B) anomaly scores both having low typicality by the topic model.
8 examples with low anomaly scores, 4 were assessed as slightly abnormal. The experts noted that all sessions that received low typicality values from the behavioral topic model included actions that are specific for different LSS system’s functions dealing with users, offices, organizations, etc. Generally, such behaviors are not necessarily suspicious and indicating potential fraud. Still, behaviors mixing di-verse functions may deserve a detailed examination.
The behavioral topic model also assigned low typicality scores to sessions that consisted of a single action repeated many times, e.g., “Search User”. These sessions had low anomaly scores by the current model. The experts acknowl-edged that, since such behaviors happened relatively rare, their current model might not be trained to treat them as abnormal. Hence, the new approach to session analysis made the experts aware of the existence of such behaviors.
User-level behavior analysis
The domain experts were highly interested in a possibility to categorize the LSS system users based on their behaviors in the sessions. The behavioral topic model allows charac-terizing the users based on the following criteria:
• whether a user has one or a few usual (repeatedly oc-curring) behavior types or has diverse behavior types;
• which specific behavior types are usual for a user; • whether a user has occasional occurrences of behaviors
of types that not usual for this user;
• whether a user has behavior instances with low
typical-ity values and how frequent such instances are. User profiles based on these criteria can be used for as-sessing new sessions with respect to their expectedness. The experts agreed that this may be a good approach to enhancing the security checks.
By considering the examples provided, the experts agreed that such behavior summaries can be a useful addi-tion to the currently existing user profiles that are used in the security monitoring system. The users practicing one or two behavior types were judged as having routine behaviors. Regarding occasional occurrences of other behavior types among the sessions of such routine users, the experts said that such occurrences are not necessarily suspicious since they may correspond to functions that need to be performed only once in a while. Hence, the overall frequencies of behavior types need to be taken into account in deciding whether a user-unspecific activity may be suspicious.