This is a repository copy of A Multi-Scale Piecewise-Linear Feature Detector for
Spectrogram Tracks.
White Rose Research Online URL for this paper:
http://eprints.whiterose.ac.uk/67984/
Version: Accepted Version
Proceedings Paper:
Lampert, Thomas, Pears, Nick orcid.org/0000-0001-9513-5634 and O'Keefe, Simon
orcid.org/0000-0001-5957-2474 (2009) A Multi-Scale Piecewise-Linear Feature Detector
for Spectrogram Tracks. In: AVSS: 2009 6TH IEEE INTERNATIONAL CONFERENCE ON
ADVANCED VIDEO AND SIGNAL BASED SURVEILLANCE. 6th IEEE International
Conference on Advanced Video and Signal Based Surveillance, 2009, 02-04 Sep 2009
IEEE , ITA , pp. 330-335.
https://doi.org/10.1109/AVSS.2009.84
[email protected] https://eprints.whiterose.ac.uk/ Reuse
Items deposited in White Rose Research Online are protected by copyright, with all rights reserved unless indicated otherwise. They may be downloaded and/or printed for private study, or other acts as permitted by national copyright laws. The publisher or other rights holders may allow further reproduction and re-use of the full text version. This is indicated by the licence information on the White Rose Research Online record for the item.
Takedown
If you consider content in White Rose Research Online to be in breach of UK law, please notify us by
Thomas A. Lampert
Department of Computer Science
University of York, U.K.
[email protected]Nick E. Pears
Department of Computer Science
University of York, U.K.
Simon E. M. O’Keefe
Department of Computer Science
University of York, U.K.
[email protected]Abstract
Reliable feature detection is a prerequisite to higher level decisions regarding image content. In the domain of spec-trogram track detection and classification, the detection problem is compounded by low signal-to-noise ratios and high variation in track appearance. Evaluation of standard feature detection methods in the literature is essential to determine their strengths and weaknesses in this domain. With this knowledge, improved detection strategies can be developed. This paper presents a comparison of line detec-tors and a novel, multi-scale, linear feature detector able to detect tracks of varying gradients. We outline improve-ments to the multi-scale search strategies which reduce run-time costs. It is shown that the Equal Error Rates of exist-ing methods are high, highlightexist-ing the need for research into novel detectors. Results demonstrate that the proposed method offers an improvement in detection rates when com-pared to other, state of the art, methods whilst keeping false positive rates low. It is also shown that a multi-scale im-plementation offers an improvement over fixed scale imple-mentations.
1. Introduction
Typically, acoustic data received via passive sonar sys-tems is transformed from the time domain to the frequency domain using the Fast Fourier Transform (FFT). This allows for the construction of a spectrogram image, in which time and frequency are are variables along orthogonal axes and intensity represents the power received at a particular time and frequency. It follows from this that, if a source which emits narrowband energy is present during some consecu-tive time frames then a track, which is often linear, will be
present within the spectrogram. The problem of detecting these tracks is an ongoing area of research with contribu-tions from a variety of backgrounds ranging from statistical modelling [13] and image processing [7, 1, 9] to expert sys-tems [8]. This problem is a critical stage in the detection and classification of sources in passive sonar systems and the analysis of vibration data. Applications are wide rang-ing and include identifyrang-ing and trackrang-ing marine mammals via their calls [11, 10], identifying ships, torpedoes or sub-marines via the noise radiated by their mechanics [15, 2], distinguishing underwater events such as ice cracking [4] and earth quakes [6] from different types of source, meteor detection and speech formant tracking [14].
The key step in all of these applications and systems is the detection of the low-level, linear features. Tradi-tional detection methods perform poorly when applied to low SNR images, such as those tested in this paper. There-fore, it is valuable to conduct an evaluation of the standard line detection methods to measure performance, determine weaknesses and strengths which will give insight into the development of novel detection methods for application to this area. We also evaluate the performance of two novel feature detectors, the proposed and a Principal Component Analysis (PCA) supervised learning detector [7].
The problem is compounded not only by the low Signal-to-Noise Ratio (SNR) in spectrogram images but also the variability of the structure of tracks. Structure can vary greatly, including vertical straight tracks, sloped straight tracks, sinusoidal type tracks and relatively random tracks. A good detection strategy should be able to detect all of these.
A variety of standard line detectors have been pro-posed in image analysis literature, e.g. the Hough transform, Laplacian filter and convolution. There are methods from
Frequency (Hz)
Time (s)
130 260 390 520 650 780 910 1040
50 100 150 200 250 300 350
Frequency (Hz)
Time (s)
130 260 390 520 650 780 910 1040
50 100 150 200 250 300 350
Frequency (Hz)
Time (s)
130 260 390 520 650 780 910 1040
[image:3.595.129.464.70.273.2]50 100 150 200 250 300 350
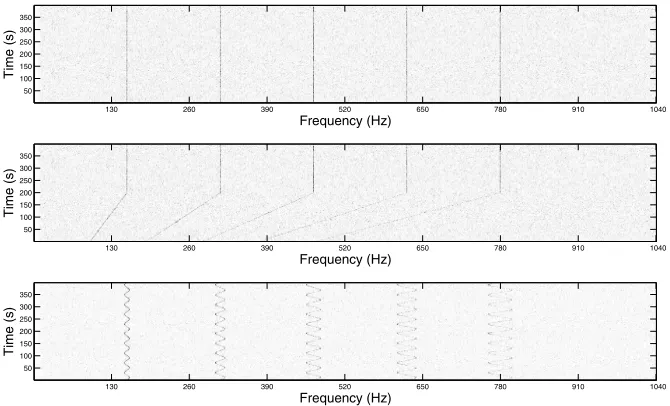
Figure 1. Examples of synthetic spectrogram images exhibiting a variety of feature complexities at a SNR of 16 dB.
statistical modelling such as MaximumA Posteriori(MAP).
Nayaret al. [12] describe a more recent parametric
detec-tor, proposing that a feature manifold can be constructed us-ing a model-derived trainus-ing set (in this case a line model) which has been projected into a lower dimensional subspace through PCA. The closest point on this manifold is used to detect a feature’s presence within a windowed test image.
This paper is structured as follows: in Section 2 we present the detection methods which have been evaluated with respect to spectrogram images and outline a novel de-tector. In Section 3, the results of these feature detectors applied to spectrogram images are presented and discussed. Finally, we present our conclusions in Section 4.
2. Method
Three examples of synthetic spectrogram images are pre-sented in Fig. 1, these illustrate the sort of images to which
we apply the feature detection methods. The following
methods from the literature are applied: the Hough Trans-form applied to the original grey-scale spectrogram image, the Hough transform applied to a Sobel edge detected im-age, Laplacian line detection [5], parametric feature
detec-tion [12], pixel value thresholding [5], MaximumA
Poste-riori(MAP) detection [3] and convolution of line detection masks [5]. Together with these we also test two novel meth-ods; a detector utilising a bar operator, presented below, and PCA based feature learning which is described in [7]. The parametric feature detection implementation in Matlab was found to be computationally expensive, taking 1.8 hr to per-form the detection in one spectrogram. The cause of this was found to be the fine resolution of the parameter vari-ations proposed by the authors to form the manifold. We found it necessary to restrict the manifold to model only
orientation variations which resulted in a large reduction in execution time.
2.1. Bar Operator
Here we describe a simple line detection method which is able to detect linear features at a variety of orientations, translations and scales (width and length) within an image. We propose that this method will also detect linear struc-ture within 2D non uniform grid data, and, can easily be extended to detect structure within 3D point clouds. It can also be easily extended to detect a variety of shapes, curves, or even disjoint regions using different operators.
Initially we outline the detection of an underlying line’s angle and subsequently determine its length and
width. We define a rotating bar of length l and width
w, which is pivoted at one end to a pixel, g = (xg, yg)
where xg ∈ {l, . . . , N − 1} and yg ∈ {0, . . . , M −
l − 1}, in a spectrogram image, S= [sij]M×N (see
Fig. 2). The values of the pixels which lie under the bar,
F ={p= (j, i)|Pl(p, θ, l)∧Pw(p, θ, w)}, where
Pl(p, θ, l) ⇐⇒ 0≤[cos(θ),sin(θ)][p−g]T < l
Pw(p, θ, w) ⇐⇒
[−sin(θ),cos(θ)][p−g]T
< w2 (1)
are summed, such that
B(θ, l, w) = 1
|F|
(j,i)∈F
sij (2)
whereθis the angle of the bar with respect to thexaxis.
To reduce the computational load of this
calcu-lation, p= (j, i) in Eq. (1) can be restricted to
l
w
θ
T
ime (s)
Frequency (Hz)
F
[image:4.595.58.283.70.206.2]g
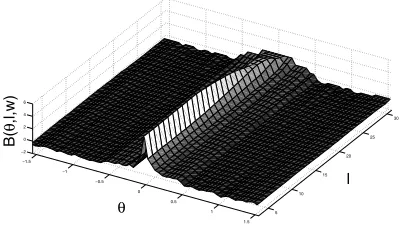
Figure 2. The bar operator with widthw, lengthland angleθ.
(l−1)(assuming the origin is in the bottom left of the
spec-trogram) instead of determiningPw(p, θ, l)andPl(p, θ, l)
for every point in the spectrogram. Also, a set of masks
which represent each combination of the parametersθ,land
wcan be derived and stored prior to runtime to be convolved
with the spectrogram.
To detect the presence and angle of any underlying line the bar is rotated through 180° with a fixed width,
calcu-latingB(θ, l, w)at increasing lengths. Normalising the
re-sult forms a brightness invariant response,B¯(θ, l, w)[12],
which is also normalised with respect to the background noise, such that
¯
B(θ, l, w) = 1
σ(B)[B(θ, l, w)−µ(B)] (3)
whereµ(B)andσ(B)are the mean and standard deviation
ofB(θ, l, w).
Statistics regarding the variation ofB(θ, l, w)can be
cal-culated to enable the estimation of an underlying line’s
an-gle,θˆ, which passes through the pivoted pixelg. For
exam-ple, the maximum response can be used, such as
ˆ
θ= arg max
θ
1
L
L
n=0 ¯
B(θ, lmin+n∆l, w) (4)
where θ∈ {−π
2,− π
2+ ∆θ,− π
2 + 2∆θ, . . . , π
2}, L =
⌊(lmax−lmin)/∆l⌋,∆land∆θcontrol the length and
an-gle search resolutions and w = 1. A recursive arg max
can be implemented for the detection of multiple lines. As-suming that noise present in the local neighbourhood of a spectrogram image is random the resulting responses will be relatively low. Conversely, if a line is present, the re-sponses will exhibit a peak in one configuration, as shown in Fig. 3. Comparing the response at the detected angle
¯
B(ˆθ, l, w)with a threshold t allows the differentiation of these cases, preventing the search for a line’s length and width parameters at each pixel if none exists. The threshold will be chosen such that it represents the response obtained when the bar is not fully aligned with a line.
−1.5 −1
−0.5 0
0.5 1
1.5 5
10 15
20 25
30
−2 0 2 4 6
l
θ
B(
θ
,l,w)
Figure 3. The mean response of the bar operator when it is cen-tred upon a vertical line 21 pixels in length (of varying SNRs) and rotated. The bar operator is varied in length between 3 and 31 pixels.
Once the line’s angle, θˆ, has been determined and iff
¯
B(ˆθ, l, w) ≥ twe can proceed to analyseB¯(ˆθ, l, w)as l
andw are varied, such thatlmin ≤ l ≤ lmax andwmin ≤
w ≤ wmax, to estimate the underlying line’s length and
width. The response of B¯ is dependent on these
param-eters, as their values increase, and extend past the correct line parameters, it follows that the peak in the response will decrease, illustrated for the length parameter in Fig. 3. An
estimate of the length,ˆl, and width,wˆ, of the line can
there-fore be obtained by determining the maximum bar length and width in which the response remains above a threshold value, so that
(ˆl,wˆ) = max(Lp) (5)
wheremax(Lp)is defined asmax(u, v) = (maxu,maxv)
where(u, v)∈Lpand
Lp={(l, w)|B¯(ˆθ, l, w)>
3
4max( ¯B(ˆθ, l, w))} (6)
where l ∈ {lmin, lmin+ ∆l, lmin + 2∆l, . . . , lmin +L∆l},
w∈ {wmin, wmin+ ∆w, wmin+ 2∆w, . . . , wmin+W∆w},
∆wcontrols the width search resolution andW =⌊(wmax−
wmin)/∆w⌋.The threshold is taken to be equal to3/4of the
maximum response found inB¯(ˆθ, l, w)but could instead be equal tot.
2.1.1 Length and Width Search
[image:4.595.325.525.83.199.2]Frequency (Hz)
Time (s)
100 200 300 400 500 600 700 800 50
100 150 200 250 300 350
Time (s)
Frequency (Hz)
100 200 300 400 500 600 700 800 50
[image:5.595.76.511.70.193.2]100 150 200 250 300 350
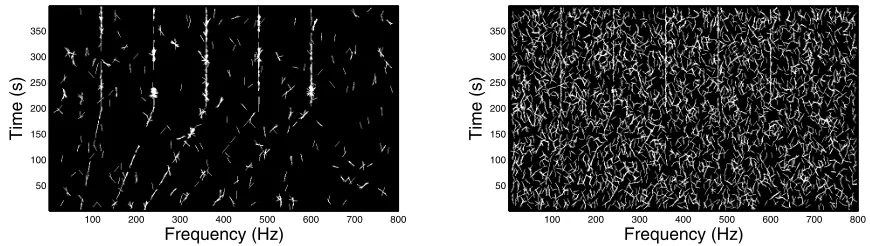
Figure 4. Spectrogram detections (2.18 dB SNR in the frequency domain) using the proposed method (left) and the parametric manifold detection (right).
Algorithm 1Line parameter binary search.
Input:lmin&lmax, the minimum & maximum length to search for,
wmin&wmax, the minimum & maximum width to search for,Δl
andΔwthe length and width search resolutions,t, the detection
threshold,θˆ, the line’s orientation,S, a spectrogram image.
Output:ˆl&wˆ, the length and width of an underlying line. 1: whilelmax−lmin>Δl∨wmax−wmin>Δwdo
2: l← ⌊lmin+lmax
2 ⌋ 3: w← ⌊wmin+wmax
2 ⌋ 4: ifB(ˆ¯ θ, l, w)≥tthen
5: lmin←l
6: wmin←w
7: else{the line’s length & width have been exceeded} 8: ifB(ˆ¯ θ, l, wmin)≥tthen
9: lmin←l
10: else{the line’s length has been exceeded} 11: lmax←l
12: end if
13: ifB(ˆ¯ θ, lmin, w)≥tthen
14: wmin←w
15: else{the line’s width has been exceeded} 16: wmax←w
17: end if
18: end if
19: end while
20: ˆl←lmin
21: wˆ←wmin
22: return ˆl,wˆ
3. Experimental Results
In this section we present a description of the test data and the results obtained during the experiments.
3.1. Data
The methods were tested on a set of 730 spectrograms generated from synthetic signals 200 seconds in length with a sampling rate of 4 kHz (examples of which were presented in Fig. 1). The spectrogram resolution was taken to be 1 sec with 0.5 sec overlap and 1 Hz per FFT bin. These exhibited
SNRs (frequency domain) ranging from -3.5 to 9.5 dB and a variety of track appearances, ranging from constant fre-quencies (vertical lines), ramp up frefre-quencies (non-vertical lines) (with a gradient range of 1 to 16 Hz/sec at 1 kHz) to sinusoidal (with periods ranging from 10, 15 & 20 sec-onds and amplitudes ranging from 1–5% of the centre fre-quency). The test set was scaled to have a maximum value of 255 using the maximum value found within a training set (except when applying the PCA detector as the original spectrogram values were used).
The ground truth data was created semi automatically by thresholding (where possible) high SNR versions of the spectrograms. Spurious detections were then eliminated and gaps filled in manually.
3.2. Nayar Parametric Detection
First we use the feature detector proposed by Nayar
et al. as a comparison method. This, like the method pro-posed, is a model based feature detector. The primary dif-ference between the two is that Nayaret al. propose to con-struct a sampled manifold in a feature space derived through PCA. Detection is achieved by calculating the closest point on the manifold to a sample taken from an image and thresh-olding the distance if necessary. The proposed method per-forms the detection without the construction of the mani-fold, instead, the image sample’s responses as the model is varied are analysed and the best fit is found from these. This avoids the loss of information that is an effect of dimension-ality reduction.
detec-0 0.1 0.2 0.3 0.4 0.5 0.6 0.7 0.8 0.9 1 0
0.1 0.2 0.3 0.4 0.5 0.6 0.7 0.8 0.9
False Positive Rate
True Positive Rate
[image:6.595.154.440.70.250.2]Threshold Convolution Laplacian Random Guess Hough−Sobel Hough−Grey Bar Fixed−Scale Bar Multi−Scale PCA
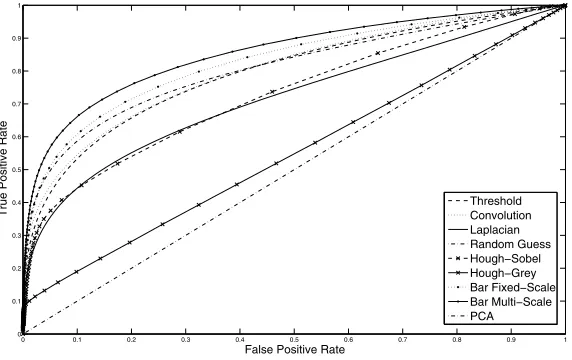
Figure 5. Receiver Operator Curves of the evaluated detection methods.
tions can be seen in Fig. 4. The threshold for each method which resulted in a True Positive Rate (TPR) of 0.7 was found to allow an equivalent False Positive Rate (FPR) to be compared. The comparison method resulted in an FPR of 0.1626 and the proposed method an FPR of 0.0251.
3.3. Results
Here we compare the proposed method to the remaining line detectors using the following parameters. The Lapla-cian and convolution filter sizes were 3×3 pixels. The threshold parameters for the Laplacian, bar, convolution and pixel thresholding were varied between 0 and 255 in steps of 0.2. Using a window size of3×21pixels the PCA thresh-old ranged from 0 to 1 in increments of 0.001. The bar op-erator’s parameters were set towmin =wmax = 1,lmin = 6 andlmax = 20. The class probability distributions for the MAP were estimated using a gamma pdf for the signal class and a exponential pdf for the noise class. The PCA method was trained using examples of straight line tracks and noise. The Receiver Operator Curves (ROC) were generated by varying a threshold parameter which operated on the out-put of each method - pixel values above the threshold were classified as signal and otherwise noise. The ROC curves for the Hough transforms were calculated by varying the pa-rameter space peak detection threshold. The TPR and FPR were calculated using the number of correctly/incorrectly detected signal and noise pixels.
3.3.1 Existing Methods
The MAP detector highlights the problem of high class dis-tribution overlap and variability; achieving a TPR of 0.0510 and a FPR of less than 0.0002. This rises to a TPR of 0.2829 and a FPR of 0.0162 when the likelihood is evalu-ated within a3×3pixel neighbourhood (as no thresholding
is performed ROCs for these methods are not presented). It can be seen in Fig. 5 that the threshold and convolu-tion methods achieve almost identical performance over the test set, with the Laplacian and Hough on Sobel line detec-tion strategies achieving considerably less and the Hough on grey scale image performing the worst. We think that the Hough on edge transform outperformed the Hough on grey scale due to the reduction in noise occurring from the application of an edge detection operator. However, both of these performed considerably less well than the other methods due to their limitation of detecting straight lines. The PCA supervised learning method proved more effective than all of these, exceeding the performance of the closest two (thresholding and convolution) indicating that the learn-ing method is capturlearn-ing the correct type of information. As previously mentioned, the PCA method was trained using vertical, straight track examples only, limiting its sinusoidal and gradient track detection abilities. We think that with extended training, this method could improve further.
3.3.2 Fixed-Scale Bar Operator
Preliminary tests were performed using a fixed length detec-tor. The maximum of the operator’s response, B¯(ˆθ, l, w), where θˆis defined by Eq. (4) andlmin = lmax = 21, was taken as the pixel’s value and thresholded to perform the detection. It can be seen in Fig. 5 that the proposed de-tecor with a fixed-scale bar operator outperforms the meth-ods from the literature.
3.3.3 Multi-Scale Bar Operator
methods than the fixed length implementation, and thus it achieves much higher TPRs and lower FPRs. Taking an example TPR of 0.7 the best detectors are, from worst to best; Convolution (FPR: 0.246), PCA (FPR: 0.215), Bar Fixed-Scale (FPR: 0.181) and Bar Multi-Scale (FPR: 0.133). These results show that the combination of intensity and structural information, rather than relying on intensity information alone, increases detector reliability.
4. Conclusions
This paper has presented a performance comparison of line detection methods present in the literature applied to spectrogram track detection. We have also presented and evaluated a novel line detector. The results show an im-provement upon results obtained without multi-scale detec-tion and also upon standard line detecdetec-tion methods when applied to this problem. Thresholding is found to be very effective and it is believed that this so because spectro-grams with a SNR of 3 dB or more constitute 70% of the test database, circumstances which are ideal for a simple method such as thresholding. However, when lower SNRs are encountered it is believed that thresholding will fall be-hind more sophisticated methods. Also, thresholding only provides a set of disjoint pixels and therefore a line detec-tion stage is still required. It is noted that the PCA method was trained using examples of straight tracks but was eval-uated upon a data set containing a large number of tracks with sinusoidal appearance, reducing its effectiveness but still allowing it to surpass the other existing methods.
When compared to the detection method proposed by Nayer et al. the proposed method offers a significant im-provement in FPRs when comparable TPRs are achieved in low SNR conditions. This performance improvement is achieved at the expense of a slight increase in execution time. Conducting orientation detection through a multi-scale strategy could possibly reduce this difference.
The evaluation of standard feature detection methods has highlighted the need to develop improved methods for spec-trogram track detection. These should be more resilient to low SNR, invariant to non stationary noise and allow for the detection of varying, unknown, feature appearances.
Improving first stage detection methods reduces the computational burden and improves the detection perfor-mance of higher level detection/tracking frameworks such as those presented in [7, 13]. A detection method may not outperform others alone, however, it may have desirable properties for the framework in which it is used and there-fore, in this case, provide good detection rates.
Acknowledgements
This research has been supported by the Defence Science and Technology Laboratory (DSTL)1 and QinetiQ Ltd.2,
with special thanks to Duncan Williams1for guiding the ob-jectives and Jim Nicholson2for guiding the objectives and also providing the synthetic data.
References
[1] J. S. Abel, H. J. Lee, and A. P. Lowell. An image
process-ing approach to frequency trackprocess-ing. In Proc. of the IEEE
Int. Conference on Acoustics, Speech and Signal Processing, volume 2, pages 561–564, March 1992.
[2] C.-H. Chen, J.-D. Lee, and M.-C. Lin. Classification of
un-derwater signals using neural networks. Tamkang J. of
Sci-ence and Engineering, 3(1):31–48, 2000.
[3] R. O. Duda, P. E. Hart, and D. G. Stork. Pattern
Classifica-tion. Wiley-Interscience Publication, 2000.
[4] J. Ghosh, K. Turner, S. Beck, and L. Deuser. Integration
of neural classifiers for passive sonar signals. Control and
Dynamic Systems - Advances in Theory and Applications, 77:301–338, 1996.
[5] R. C. Gonzalez and R. E. Woods. Digital Image Processing
(3rd Edition). Prentice-Hall, Inc., Upper Saddle River, NJ, USA, 2006.
[6] B. P. Howell, S. Wood, and S. Koksal. Passive sonar
recog-nition and analysis using hybrid neural networks. InProc. of
OCEANS ’03, volume 4, pages 1917–1924, September 2003. [7] T. A. Lampert and S. E. M. O’Keefe. Active contour
de-tection of linear patterns in spectrogram images. InProc. of
ICPR’08, pages 1–4, December 2008.
[8] M. Lu, M. Li, and W. Mao. The detection and tracking of weak frequency line based on double-detection algorithm. In Int. Symposium on Microwave, Antenna, Propagation and EMC Technologies for Wireless Communications, pages 1195–1198, August 2007.
[9] J.-C. D. Martino and S. Tabbone. An approach to detect
lo-far lines. Pattern Recognition Letters, 17(1):37–46, January
1996.
[10] D. K. Mellinger, S. L. Nieukirk, H. Matsumoto, S. L. Heim-lich, R. P. Dziak, J. Haxel, M. Fowler, C. Meinig, and H. V. Miller. Seasonal occurrence of north atlantic right whale (Eubalaena glacialis) vocalizations at two sites on the
sco-tian shelf. Marine Mammal Science, 23:856–867, October
2007.
[11] R. P. Morrissey, J. Ward, N. DiMarzio, S. Jarvis, and D. J.
Moretti. Passive acoustic detection and localisation of
sperm whales (Physeter Macrocephalus) in the tongue of
the ocean. Applied Acoustics, 67:1091–1105,
November-December 2006.
[12] S. Nayar, S. Baker, and H. Murase. Parametric feature
detec-tion.Int. J. of Computer Vision, 27:471–477, 1998.
[13] S. Paris and C. Jauffret. A new tracker for multiple frequency
line. InProc. of the IEEE Conference for Aerospace,
vol-ume 4, pages 1771–1782. IEEE, March 2001.
[14] Y. Shi and E. Chang. Spectrogram-based formant tracking
via particle filters. InProc. of IEEE ICASSP, volume 1, pages
I–168–I–171, April 2003.
[15] S. Yang, Z. Li, and X. Wang. Ship recognition via its radiated
sound: The fractal based approaches. J. Acoust. Soc. Am.,