P. S. Meier: Polarized drinking patterns and alcohol deregulation. Trends in alcohol consumption, harms and policy: United Kingdom 1990 – 2010
This paper sets out to chart key trends in alcohol consumption and harm, and of related policy activity in the UK between 1990 and 2010. As a journal paper cannot provide a comprehensive picture, the focus will be on England as the most populous region, with comments on salient developments in the other regions where these are different. The paper draws on a variety of data sources, especially general population surveys, government reports, industry figures, National Statistics products, and recent reviews of data trends. It is structured around the themes: 1) trends in volume and patterns of consumption in adults and children; 2) trends in major alcohol-related harms; 3) changes in the affordability and availability of alcohol; 4) influences of major players including policy makers, media and industry and 5) the current (mid-2010) status of policy efforts. The reviewed data show that the UK has seen significant changes in the patterns and contexts of consumption during the 1990s and 2000s. Major consumption changes include falling per capita consumption, a rise in heavy episodic drinking, increasing preference of higher alcohol content beverages and a polarisation of the distribution of consumption in the population where heavy drinkers consume even higher
A B S T R A C T
Polarized drinking
patterns and alcohol
deregulation
Trends in alcohol consumption, harms and policy:
United Kingdom 1990 – 2010
Acknowledgements
The author would like to thank a number of UK policy makers for informal discussions, and Norman Giesbrecht, Robin Pursehouse and Ben Baumberg for valuable comments on draft manu-scripts. All views expressed are solely those of the author.
Declaration of interest
The author’s salary is paid by the University of Sheffield and no separate funding was obtained for the preparation of this manuscript.
submitted 28. 05. 2010
initial review completed 01. 10. 2010 final version accepted 04. 10. 2010
Introduction
volumes whilst moderate drinkers appearing to decrease their average intake. Context changes include rising availability and affordability of alcohol, with few alcohol control policy efforts, and a switch from predominantly on-trade to off-trade drinking. Such trends help explain the current rapid increase in alcohol-related admissions and other heavy end consequences in the context of falling per capita consumption.
■ KEYWORDS alcohol consumption, alcohol-related harm, policy, UK
own statistics and surveys, which often have incompatible sampling strategies and consumption and harm definitions. The paper draws on a variety of data sources, especially general population surveys, government reports, industry figures, National Statistics products, and a recent review of data trends (Smith & Foxcroft 2009). Interpretations are based on the author’s observations, background reading and discussions with researchers and policy makers over the past few years. The paper is structured around the follow-ing themes: trends in volume and patterns of consumption in adults and children; trends in some of the major alcohol-related harms; changes in the affordability and availabil-ity of alcohol; influences of major players including policy makers, media and industry and the current (mid-2010) sta-tus of policy efforts.
Trends and patterns in alcohol
consumption
■ Trends in lifetime drinking and adult per capita drinking volume
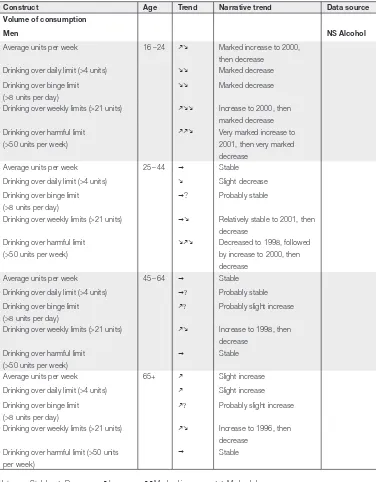
According to survey data, the balance between adult drink-ers vdrink-ersus abstaindrink-ers has remained stable for the past two decades, with about 55–60% of women and 70–75% of men drinking at least weekly, and 10–15% of both men and women not drinking at all in the past year (National Statistics 2003a; 2004a; 2005a; 2006a; 2007a; 2008a; 2009a; 2010a). Between 2004 and 2009, past-week drinking in women under the age of 25 declined. Whilst abstention rates saw no change, drinkers showed a strong increase in consumption until 2003/4 (for an overview of adult consumption trends see Table 1). When con-sidering trends, it is important to bear in mind the limitations of survey data. Survey data underestimates true alcohol consumption (covering about 60% of alcohol clearances in 2006), and it has been suggested that decreasing response rates may mean that coverage could have decreased over time, making any observed trends less reliable.
Construct Age Trend Narrative trend Data source Volume of consumption
Men NS Alcohol
Average units per week 16 –24 km Marked increase to 2000, then decrease
Drinking over daily limit (>4 units) mm Marked decrease Drinking over binge limit
(>8 units per day)
mm Marked decrease
Drinking over weekly limits (>21 units) kmm Increase to 2000, then marked decrease Drinking over harmful limit
(>50 units per week)
kkm Very marked increase to 2001, then very marked decrease
Average units per week 25– 44 g Stable Drinking over daily limit (>4 units) m Slight decrease Drinking over binge limit
(>8 units per day)
g? Probably stable
Drinking over weekly limits (>21 units) gm Relatively stable to 2001, then decrease
Drinking over harmful limit (>50 units per week)
mkm Decreased to 1998, followed by increase to 2000, then decrease
Average units per week 45– 64 g Stable Drinking over daily limit (>4 units) g? Probably stable Drinking over binge limit
(>8 units per day)
k? Probably slight increase
Drinking over weekly limits (>21 units) km Increase to 1998, then decrease
Drinking over harmful limit (>50 units per week)
g Stable
Average units per week 65+ k Slight increase Drinking over daily limit (>4 units) k Slight increase Drinking over binge limit
(>8 units per day)
k? Probably slight increase
Drinking over weekly limits (>21 units) km Increase to 1996, then decrease
Drinking over harmful limit (>50 units per week)
g Stable
Note. g Stable m Decrease k Increase kk Marked increase mm Marked decrease
1 Data Sources: NS Alcohol (National Statistics 2003a, 2004a, 2005a, 2006a, 2007a, 2008a, 2009a, 2010a). Average weekly consumption data since 1992, average daily consumption and binge drinking data since 1998. Refers to past week drinking. Change in recording 2006, which affects wine drinking most.
HMRC (2010). Alcohol Fact Sheets reporting UK data since 1990.
[image:3.507.90.467.80.562.2]Average units per week 16–24 kkm Marked increase to 2005, then decrease
Drinking over daily limit (>3 units) m? Probable decrease Drinking over binge limit (>6 units per day) m Moderate decrease Drinking over weekly limits (>14 units) kkmm Very marked increase to
2000, stability till 2002, then marked decrease
Drinking over harmful limit (>35 units per week)
kkmm Very marked increase to 2000, then marked decrease Average units per week 25–44 k Increase
Drinking over daily limit (>3 units) ? Unclear Drinking over binge limit
(>6 units per day)
k Probable increase
Drinking over weekly limits (>14 units) km Increase to 2002, then proba-bly decrease
Drinking over harmful limit (>35 units per week)
km Slight increase to 2000, then probably slight decrease Average units per week 45–64 k Increase
Drinking over daily limit (>3 units) g? Probably stable Drinking over binge limit
(>6 units per day)
k Probably increase
Drinking over weekly limits (>14 units) km Increase to 1998, then slow decrease
Drinking over harmful limit (>35 units per week)
g Stable
Average units per week 65+ k Increase
Drinking over daily limit (>3 units) g? Probably stable Drinking over binge limit
(>6 units per day)
g? Probably stable
Drinking over weekly limits (>14 units) g Stable
Drinking over harmful limit (>35 units per week)
g Stable
Consumption patterns (Men and Women)
Average per capita volume (ages 16+) – total
km Increase to 2004, recently stable or decrease
HMRC
Average per capita volume (ages 16+) – beer
mm Marked decrease
Average per capita volume (ages 16+) – wine
kk Marked increase
Average per capita volume (ages 16+) – spirits
g Stable
Average per capita volume (ages 16+) – cider
k Increase
Off-trade % of beer sales k Increase DEFRA
Off-trade volume beer sales km Increase to 2006, modest decrease since
Survey results from England show that in 2006, 45% of alcohol was consumed by the heaviest 10% of drinkers, 66% by the heaviest 20% and 79% by the heavi-est 30%. At the other end of the spectrum, the lightest 40% of drinkers accounted for only 2% of consumption (Meier et al. 2010).
Surveys make % abv (alcohol-by-vol-ume) assumptions when coding the unit content of beverage types (a UK unit cor-responds to 8 gms/10 ml of pure alcohol). For all government surveys, these assump-tions were adjusted in 2006/2007 to cor-rect for increasing beverage strength and serving sizes, and thus increasing under-estimation of true consumption in the preceding years. Wine is more affected than other types of drinks, and thus there
is some uncertainty about survey-based trends for female and older drinkers.
[image:5.507.89.422.371.606.2]Average weekly consumption trends among different population groups vary substantially (National Statistics 2003a; 2004a; 2005a; 2006a; 2007a; 2008a; 2009a; 2010a). Women of all ages have been in-creasing their consumption steadily, or in the case of young women, very rapidly. This increase still continues in the over-25s, but young women have recently start-ed to decrease their drinking. By 2008, the average amount consumed by women of all ages (except 65+) was very similar. In contrast, drinking levels in men have been fairly stable, with only young men <25 showing a marked increase in drinking during the 1990s followed by a decrease during the 2000s.
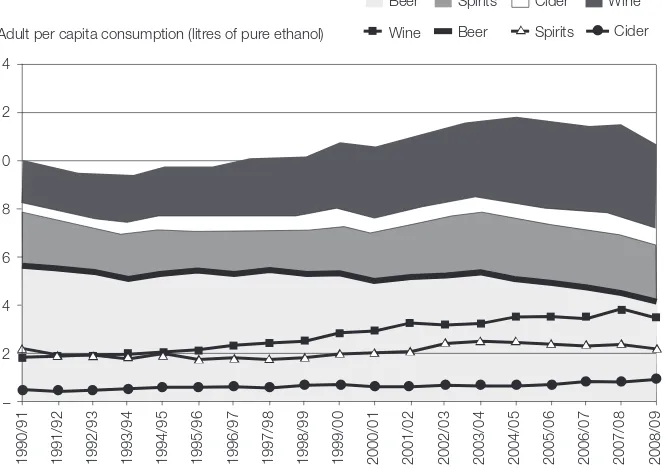
Figure 1. Beverage volumes cleared for sales by customs between 1990/1 and 2008/9, by bewerage type (lines) and cumulative (shaded areas) (https://www.uktradeinfo.com/index. cfm?task=factalcohol&hasFlashPlayer=true).
14
12
10
8
6
4
2
–
1990/91 1991/92 1992/93 1993/94 1994/95 1995/96 1996/97 1997/98 1998/99 1999/00 2000/01 2001/02 2002/03 2003/04 2004/05 2005/06 2006/07 2007/08 2008/09
Adult per capita consumption (litres of pure ethanol)
▲ ▲ ▲ ▲ ▲ ▲ ▲ ▲ ▲ ▲ ▲ ▲ ▲ ▲ ▲ ▲ ▲ ▲ ▲
Beer
Wine
Spirits
Beer Spirits Cider
Cider Wine
■ Shifting drinking preferences
Traditionally a beer drinking country, the UK’s preference is gradually changing in favour of wine (see Figure 1 and Table 1). Between 1990 and 2008, beer clearances decreased to account for 39% of alcohol cleared for sale, wine clearances rose by 80% to account for 32%, spirit clearances decreased by 10% to represent 21% of the market, and cider clearances doubled to ac-count for the remaining 8%. Note that these figures do not take into account cross-bor-der purchases and smuggling, both likely to be more relevant for higher-value less bulky products. Not reported separately in clearance data are RTDs (ready-to-drink beverages, aka alcopops). Available survey data on off-trade household expenditure on different products shows that RTDs did not feature before 1996, and consumption increased only slowly between 1996 and 1999. Between 1999 and 2002, there was a four-fold increase in RTD beverage volume bought for home consumption, but popu-larity has decreased almost as rapidly from 2004. In 2009, RTD consumption account-ed for only 3% of total alcohol consumaccount-ed and is largely confined to young women (National Statistics 2010). It is noteworthy that the average strength of wine increased considerably from c. 11.7% abv in 1997 to c. 12.9% abv in 2008 whilst the aver-age strength of beer consumed in the UK has increased only mildly from c. 4% to c. 4.2% abv (Public Health Commission 2008).
The UK retains a stronger on-trade cul-ture compared to many other EU coun-tries, with the much-loved social institu-tion of “the local” (ie. the neighbourhood pub). However, there is a strong increase in home consumption, likely to be driven
by the increasing discrepancy between on- and off-trade prices (discussed be-low). For example, on-trade beer sales de-creased year-on-year in both absolute vol-ume terms and expressed as share of the beer market. Whilst in 1990, 80% of all beer was sold in the on-trade sector, this had dropped to 54% by 2008. At the same time, off-trade volume sales continued to increase until 2006 and have been declin-ing only very modestly since then. Ex-penditure data confirm the shift between on- and off-trade for all beverage types (DEFRA 2010). Alcohol is bought less fre-quently in restaurants and only a small proportion of respondents regularly used off-licenses (“bottle shops”) (National Sta-tistics 2010e). Studies note the increasing importance of preloading, where young drinkers start drinking cheaper alcohol at home, and continue drinking in the on-trade once they are already quite inebri-ated (Hughes et al. 2008).
■ Problem drinking
National Statistics commonly use the fol-lowing thresholds for men and women: lower risk drinkers (≤4/3 units per day or ≤21/14 units per week), increasing-risk drinkers (more than these limits but <50/35 units per week), high-risk or harm-ful drinkers (>50/35 units per week) and binge drinking (>8/6 units per day). Trend data on heavy and harmful drinking is available 1992 to 2008, binge drinking data to 1998 to 2008. The latter refers to the proportion of respondents who had one or more binges in the past week (Nation-al Statistics 2003a; 2004a; 2005a; 2006a; 2007a; 2008a; 2009a; 2010a).
women, although the gap has been nar-rowing since the early 1990s. In men, the proportion of binge, hazardous, and harmful drinkers in the adult population has been relatively stable at around 21%, 27% and 7%, respectively, and did not appear to be influenced much by the re-cording change in 2006. Because of their wine preference, women are more af-fected by both increasing underrecording and the sudden correction in 2006. Binge drinking rates increased from 9% to 15%, hazardous drinking varying between 11% and 19% and harmful drinking increasing from 2% to 4%. Much of the increases ap-pear as step changes in 2006.
During much of the 1990s and early 2000s, binge, heavy and harmful drinking was far more prevalent in younger drink-ers than older drinkdrink-ers. Since then, rates in younger drinkers have decreased and those in older drinkers have remained stable or increased, possibly indicating that the heaviest drinking cohorts have now reached middle-age without decreas-ing their consumption levels. In men, it is now those aged 45–64 who are most likely to drink at heavy and harmful lev-els, whereas in women, age differences be-tween those aged 16 to 64 have virtually disappeared.
■ Underage drinking
There is no legal age limit to drinking al-cohol, but the minimum legal purchasing age is 18 and it is illegal to provide alco-hol to someone under the age of 18 (or 16 when accompanied by a responsible adult and drinking with a meal in the on-trade). Underage drinking remains very common in the UK. However, after a long period of steadily increasing alcohol consumption
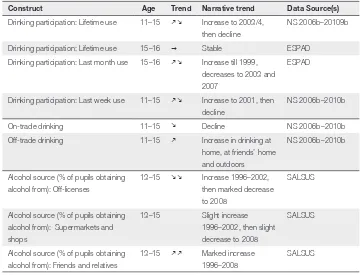
lasting until 2003/4, English school sur-veys now suggest a decline in the preva-lence of lifetime and weekly drinking (see Table 2), with 52% of 11–15 year olds re-porting lifetime drinking in 2008, down from peak levels of 65% in 1994; and weekly drinking decreasing from 26% in 2001 to 18% in 2008. Recent trends on vol-ume consvol-umed are somewhat difficult to interpret due to the 2006 change in record-ing, however, it appears that the average volume of drinking amongst those who do drink may have been increasing. In 2008, there were also high levels of intentional intoxication: Around half of 15-year-old drinkers report drinking with the inten-tion of getting drunk, with 63% having been drunk at least once. Prevalence, pat-terns and trends are very similar for boys and girls (National Statistics 2003a; 2004a; 2005a; 2006a; 2007a; 2008a; 2009a; 2010a; National Statistics 2006b; 2007b; 2008b; 2009b; 2010b).
As in adults, on-trade drinking is declin-ing, with pupils in Scotland (where these data are collected) increasingly choosing to drink at home or someone else’s home, at parties and outdoors, thus reinforcing the importance of parental monitoring and enforcement of the minimum legal pur-chasing age in the off-trade.
Trends in alcohol-
related harm
■ Health
Alcohol-attributable hospital admissions The key health indicator used by UK policy makers is the rate of hospital admissions for alcohol-related harm per 100,000 popula-tion (currently the only napopula-tional perform-ance indicator related to alcohol). Hospitals are required to report to an online data por-tal used by the UK National Health Service to collect and share performance informa-tion, aggregate data and statutory returns, these data are then used by the Department of Health to estimate the number of
per-sons with one or more admissions for an alcohol-attributable disease. In recent year, alcohol-attributable admissions have been increasing at a rate of 11% year-on-year, with an estimated 945,000 alcohol-attrib-utable admissions in England in 2008/09 (around 7% of total admissions) (Health Select Committee 2010). The number of hospital admissions of under-16s with a primary or secondary alcohol-related di-agnosis increased from 3,870 in 1995/6 to 5,280 in 2005/6 (National Statistics 2007a). It is unclear whether media attention in lat-Table 2. Underage consumption
Construct Age Trend Narrative trend Data Source(s)
Drinking participation: Lifetime use 11–15 km Increase to 2003/4, then decline
NS 2006b–20109b
Drinking participation: Lifetime use 15–16 g Stable ESPAD
Drinking participation: Last month use 15–16 km Increase till 1999, decreases to 2003 and 2007
ESPAD
Drinking participation: Last week use 11–15 km Increase to 2001, then decline
NS 2006b–2010b
On-trade drinking 11–15 m Decline NS 2006b–2010b
Off-trade drinking 11–15 k Increase in drinking at home, at friends’ home and outdoors
NS 2006b–2010b
Alcohol source (% of pupils obtaining alcohol from): Off-licenses
13–15 mm Increase 1996–2002, then marked decrease to 2008
SALSUS
Alcohol source (% of pupils obtaining alcohol from): Supermarkets and shops
13–15 Slight increase 1996–2002, then slight decrease to 2008
SALSUS
Alcohol source (% of pupils obtaining alcohol from): Friends and relatives
13–15 kk Marked increase 1996–2008
SALSUS
Note. g Stable m Decrease k Increase kk Marked increase mm Marked decrease
Due to the similarity of trends and patterns, not reported separately for girls and boys.
[image:8.507.60.420.97.372.2]er years might have led to improved record-ing of alcohol-related diagnoses.
Alcohol-specific mortality
National Statistics report on alcohol-spe-cific (100% attributable) rather than alco-hol-attributable deaths (National Statistics 2009c; 2009d; 2010d). Against a backdrop of falling overall mortality rates, there have been stark increases in mortality from alcohol-specific causes, with a continued but slowed increase following very rapid increases since the early 1990s. In 2008, the death rate for UK men was 18.7 per 100,000 (9.1 in 1991) and 8.7 per 100,000 for UK women (5.0 in 1991). During the 1990s, the rapidly increasing death rate of the 35–54 age group overtook that of those aged 75+. In both men and women, the highest death rates are found in those aged 55–74 (45.8/100,000 and 21.5/100,000 in 2008, respectively). Minor changes in cod-ing have not lead to major changes in over-all death rates.
The age-standardised death rate per mil-lion population for liver disease increased from 76 for men and 49 for women in 1991 to 164 and 86 in 2008 (National Statistics 2009c). Whilst in 1991 alcoholic liver dis-ease accounted for around 37% of liver disease mortality in those aged 50+, in 2005 this had risen to 55 % (National Sta-tistics 2010d).
Drinking during pregnancy
The proportion of mothers who drink re-peatedly during pregnancy is high but de-creased from 66% in 1995 to 54% in 2005, whilst the proportion of mothers giving up drinking during pregnancy increased from 24% to 34% (National Statistics Alcohol 2008a).
■ Crime
Trends in all crime and alcohol- related violent crime
The British Crime Survey, an annual gen-eral household survey, is the data source most commonly used to longitudinally track crime in England and Wales (Walker et al. 2009). This survey is not affected by the discontinuities that police crime sta-tistics have seen, with repeated changes to recording rules during the 2000s. Re-spondents are asked about their experi-ences of crime in the past year. Crime rates for all types of crime, with the exception of theft from the person, follow the same long-term trends: rates rose steadily dur-ing the 1980s and early 1990s and peaked in 1995. Crime then fell substantially until 2004/05 after which time crime rates re-duced only slightly.
The indicator used to estimate alcohol-related crime is the question whether the victim of crime believes that the offender had been under the influence of alcohol at the time of the offence. In 1995, from when the data are available, victims be-lieved that 41% of violent offenders were under the influence of alcohol, a propor-tion that rose to 51% in 2003/4, and sta-bilised at around 47% since 2005/6. For 2008/9, it was estimated that 973,000 vio-lent offences were committed under the influence of alcohol (Walker et al. 2009).
cautions for drunk and disorderly behav-iour since the 1980s (BBPA 2009).
Drink driving
Yearly drink driving traffic casualties, in line with all traffic casualties, have de-creased markedly since 1990 (all casual-ties: 20,400 to 13,000; fatalicasual-ties: 760 to 430 in 2007). However, the proportion of accidents involving illegal alcohol levels fluctuates between 5 and 7% (DfT 2009). Breath tests were carried out for less than 30% of drivers involved in injury acci-dents until 1996, at which point new po-lice regulations encouraged breath testing at the scene, increasing the proportion of drivers tested to around 55% (BBPA 09). The proportion of positive breath tests has been stable since 1990 at around 2–2.5%.
Some proximal contributors to
these changes: Availability of
alcohol and social attitudes
Availability is likely to be an important contributor to trends, as are wider “drink-ing culture” factors. This section provides an overview of development in the “three As” of availability – physical availability, describing trends in the number and types of outlets and hours of sale, economic availability, looking at trends in alcohol affordability compared to inflation and average income, and “cognitive” availabil-ity via advertising, as well as changed at-titudes.■ Physical availability
Physical availability to adults
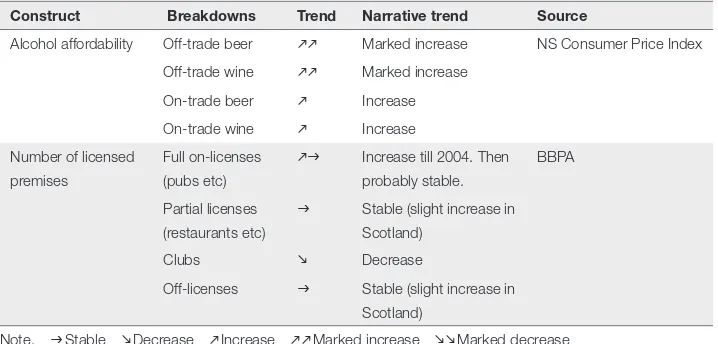
Number and types of outlets: The total number of licensed premises in England and Wales seems to have been fairly sta-Table 3. Alcohol availability
Construct Breakdowns Trend Narrative trend Source
Alcohol affordability Off-trade beer kk Marked increase NS Consumer Price Index
Off-trade wine kk Marked increase On-trade beer k Increase On-trade wine k Increase Number of licensed
premises
Full on-licenses (pubs etc)
kg Increase till 2004. Then probably stable.
BBPA
Partial licenses (restaurants etc)
g Stable (slight increase in Scotland)
Clubs m Decrease
Off-licenses g Stable (slight increase in Scotland)
Note. g Stable m Decrease k Increase kk Marked increase mm Marked decrease
Data Sources: Licensing law. BBPA Statistical Handbooks 2007, 2009 (reporting data from Home Office and DCMS from 1990. Recoding change in England and Wales in 2004/5).
[image:10.507.64.423.98.270.2]ble during the 1990s and 2000s at around 200,000. The number of off-licensed premises was stable at around 55,000 up to 2004. The number of full on-licenses is reported to have increased from around 83,000 in 1990 to 91,000 in 2004 (Home Office, DCMS and Nielsen data, reported in BBPA 2009). Data relating to 2007 to 2009 are not directly comparable be-cause of a recording change. These again show relatively stable numbers at around 124,000 on-licenses (some of which are also licensed to sell for home consump-tion) and 47,000 off-licenses (DCMS 2009). More disaggregated data on outlet type or capacity is not available. The develop-ments seen here do not appear to match the observed shift from on- to off-trade consumption, nor the marked shift from off-license to supermarket purchasing.
Licensing: A key change concerning
alcohol licensing in England and Wales was the Licensing Act 2003 (which came into force in November 2005). Licensing laws prior to 2005 allowed alcohol to be sold until 11pm from Monday to Satur-day, and 10:30pm on a SunSatur-day, in both on-trade and off-trade sector (off-trade Sunday trading was restricted until 1995, when all-day Sunday trading was first introduced). Since 2005, the four licens-ing objectives in England have been the prevention of crime and disorder, public safety, prevention of public nuisance, and the protection of children from harm, with no provision for public health considera-tions. Fixed licensing hours were aban-doned, with the explicit aim to favour a more continental drinking culture, to pre-vent the last-minute consumption surge just before 11pm and to reduce crime by avoiding drunk patrons all leaving
premis-es at the same time. Maybe unexpectedly, only a minority of on-license premises opted for a 24-hour license, and most ap-pear to have increased their usual opening times by less than an hour per day (Hough et al. 2008). Information on alcohol sales times in the off-trade, for which the licens-ing hour changes also apply, is not avail-able. In Scotland, policy changed with the Licensing (Scotland) Act 2005, which replaced the previous legislation in Sep-tember 2009. The law has an objective to protect public health and there are some attempts to control irresponsible on-trade promotions such as happy hours and buy-one-get-one free offers. A visible differ-ence to England and Wales is that alcohol must be displayed in separate areas within shops and supermarkets, rather than be-ing strategically places at the end of aisles, and off-license sales are permitted only between 10am and 10pm. Compared to the rest of the UK, Northern Ireland has historically been a low use area because of religious and cultural norms. It has tradi-tionally had far stricter licensing laws, and whilst licensing liberalization has been discussed it has not implemented. A new on- or off-license is only granted if another is being surrendered at the same time, and if the court is satisfied that there is not al-ready adequate provision, thus providing a strict control on outlet density.
Physical availability to children
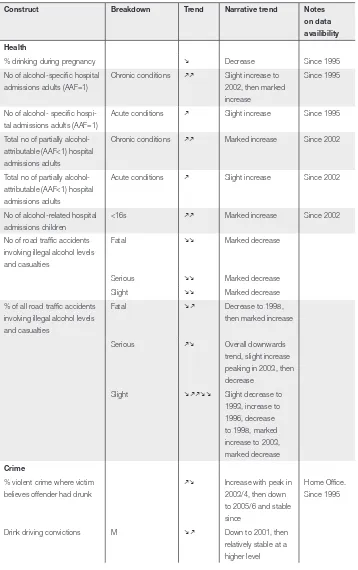
Table 4. Alcohol-related harm
Construct Breakdown Trend Narrative trend Notes on data availibility Health
% drinking during pregnancy m Decrease Since 1995
No of alcohol-specific hospital admissions adults (AAF=1)
Chronic conditions kk Slight increase to 2002, then marked increase
Since 1995
No of alcohol- specific hospi-tal admissions adults (AAF=1)
Acute conditions k Slight increase Since 1995
Total no of partially alcohol-attributable (AAF<1) hospital admissions adults
Chronic conditions kk Marked increase Since 2002
Total no of partially alcohol-attributable (AAF<1) hospital admissions adults
Acute conditions k Slight increase Since 2002
No of alcohol-related hospital admissions children
<16s kk Marked increase Since 2002
No of road traffic accidents involving illegal alcohol levels and casualties
Fatal mm Marked decrease
Serious mm Marked decrease
Slight mm Marked decrease
% of all road traffic accidents involving illegal alcohol levels and casualties
Fatal m k Decrease to 1998, then marked increase
Serious km Overall downwards trend, slight increase peaking in 2003, then decrease
Slight m kkmm Slight decrease to 1993, increase to 1996, decrease to 1998, marked increase to 2003, marked decrease
Crime
% violent crime where victim believes offender had drunk
km Increase with peak in 2003/4, then down to 2005/6 and stable since
Home Office. Since 1995
F kk Marked increase % of drivers breath tested
after injury RTA
kk Step increase when police introduced more widespread testing in 1996, increase to 1999, decrease to 2002/3, then increase % of positive breath tests (of
all drivers involved in injury RTAs)
g Stable
Cautions and convictions for drunkenness (rate per 10,000)
M mm Marked decrease England,
Wales, Scotland
F mkm Decrease to 1995,
increase to 2003, then decrease
Sources: Unless otherwise stated: National Statistics 2003a to 20010a. Data available from 1990 unless otherwise stated. Home Office 2009. British Crime Survey Report, data from 1995.
under the age of 21. The publicity around this may have contributed to a consistent decline in pupils attempting to buy from off-licenses, although buying from other shops and supermarkets has remained rel-atively stable (National Statistics 2008a; SALSUS 2009).
Underage children’s’ experiences of how easy it is to obtain alcohol have not changed over the last two decades. 14% of 11-year-olds and 69% of 15-year olds in a survey had obtained alcohol in the past week (National Statistics 2008a). How-ever, there has been a shift in sources of alcohol, with parents and friends now the dominant source. Buying or attempting to buy alcohol in the on-or off-licensed sector is less common and has been de-creasing. In 2008, asked about past-week purchasing, 10% of Scottish 13-year-olds and 17% of 15-year-olds said they had at-tempted to buy alcohol in the off-trade. In
both age groups, 70% of off-trade purchase attempts were successful. 4% of 13-year-olds and 12% of 15-year-13-year-olds said they had attempted to buy alcohol in the on-trade, 75% of purchase attempts of 13-year-olds and 83% of purchase attempts by 15-year-olds were successful (SALSUS 2009).
Affordability
the degree to which tax increases have been passed through to the consumer is unclear. There is a wide gap between the on-trade and the off-trade sectors, with the affordability of wines and beers increasing by 49% and 39% respectively in the on-trade but by 129% and 153%, respectively, in the off-trade (analysis using data from National Statistics 2010c). At least in the on-trade, the driving force is not alcohol price per se, which has been rising, but that the prices of many consumer goods, including alcohol, have not kept up with increases in disposable income.
■ Advertising and marketing
There is a mixture between voluntary and statutory regulation for advertising. Ofcom is a statutory regulator of the UK commu-nications industries, with responsibilities for television, radio, telecommunications and wireless communications services. Ofcom was established in December 2003 and replaced separate statutory organiza-tions responsible for television, radio, broadcasting standards, telecommunica-tions. The Advertising Standards Author-ity (ASA) is a self-regulatory body estab-lished in 1962 by the marketing industry to ensure that non-broadcast advertisements comply with the British Code of Advertis-ing, Sales Promotion and Direct Market-ing. In November 2004, after a period of review and consultation, Ofcom decided that a co-regulatory approach to broadcast advertising regulation would be preferable to the existing fragmented statutory sys-tem and delegated day-to-day responsibil-ity for broadcast advertising to the ASA. At the same time, responsibility for the TV and Radio Advertising Standards Codes themselves was delegated to the Broadcast
Committee of Advertising Practice (BCAP), an industry rule-making body, comprising advertisers, agencies and broadcast media. Since late 2005, codes for both broadcast and non-broadcast media include a clause that alcohol advertisements ’must not be likely to appeal strongly to people under 18’. ASA runs an annual compliance sur-vey, which regularly finds very few ads (<1%) in breach of rules, although a sur-vey with young people before and after the 2005 code change showed that children continue to find alcohol adverts attractive (Ofcom/ASA 2007). Product placements (paid-for brand-specific product portray-als embedded in TV, cinema, or radio pro-grammes or internet games) are permitted in UK productions from this year, how-ever, after some debate, alcohol product placements remain prohibited.
■ Attitudes towards alcohol and alcohol policy
Interestingly, recent data show that chil-dren are becoming less tolerant of drink-ing and drunkenness among their peers. Between 2003 and 2008, the proportion of 11–15 year olds agreeing that it was OK for someone of their age to drink once a week fell from 46% to 36%, and the proportion who thought it OK for someone of their age to get drunk once a week from 20% to 12% (National Statistics 2006b; 2007b; 2008b; 2009b; 2010b). It is possible that this is a first indication of shifting social norms – similar as that seen for tobacco several years earlier. This might have been linked to media attention that is increas-ingly focused on the negative effects of un-derage drinking, and fewer pro-drinking role models in the friendship network due to increasing abstention rates.
Major distal influences: The role
of national and international
politics, the alcohol industry
and the media
This penultimate section will investigate the development of the political, industrial and media landscape during the 1990s and 2000s, to provide information on the politi-cal and societal context in which consump-tion and harm changes could occur. Read-ers should note that this section, more than others, is based on the author’s and inform-ants’ interpretations of the situation.
■ Political developments
There was little in the way of cross-govern-mental alcohol policy until 1999. In 1999, a Green Paper committed Government to the development of a strategy by 2000 (UK Government 1999) and set out aims to en-courage people who drink to do so sensi-bly to avoid alcohol-related problems, to
protect individuals and communities from anti-social and criminal behaviour and to provide specialist treatment services. This first paper set the tone for all strategy de-velopments since then, by announcing the intention to work in partnership with the alcohol industry. The first alcohol strategy, Alcohol Harm Reduction Strategy for Eng-land (AHRSE), published in 2004 and up-dated (Safe.Sensible.Social) in 2007 (Cabi-net Office 2004; Department of Health et al. 2007), and has been described as an example of how a policy document can be weakened during a lengthy consultation process with strong industry input (Room 2004; Harkins 2010). A line in the strategy reads: “There is no direct correlation be-tween drinking behaviour and the harm experienced or caused by individuals” and the final strategy does not refer to the testi-monies from 17 independent experts who provided evidence and who highlighted the need for action on alcohol pricing and availability (Harkins 2010). Instead, the only alcohol expert group mentioned in the final strategy was the industry-funded Portman Group (see section 4.2). A com-mon verdict in scientific circles has been that the strategy is dominated by policies that are high profile, cheap and ineffective, with none of the policies that are interna-tionally considered effective in reducing alcohol consumption (Drummond 2004; Plant 2004; Room 2004).
and Home Office in 2007. A discussion of the most recent developments follows be-low in the final section.
■ Changes in the political landscape: The role of devolved governments, EU and WHO
In 1997/8, the UK devolution process saw the introduction of governments in Scot-land, Wales, and Northern Ireland (tem-porarily suspended in NI 2002–07, but reinstated in 2006). On the whole, this has increased UK attention to alcohol, and ef-fective alcohol policies, with the devolved administrations often taking a more proac-tive approach to public health, including controlling alcohol related harm. Several newspaper reports suggest that where no devolved powers exist, as for example with taxation, Scottish and Welsh politi-cians have tried to influence the Westmin-ster government to take action. Some ex-amples of policy differences are provided below when discussing pricing and avail-ability policies.
Until recently, the main international influence relating to alcohol were EU trade liberalisation, leading to general food and drink trade growth, subsidy of the wine-making industry as part of the Common Agricultural Policy, and encouragement for private cross-border purchasing. EU trade policies are starting to present chlenges for UK policies in the areas of al-cohol pricing control and product label-ling. EU and WHO alcohol policies have influenced UK policy to only a limited degree, but the influence is likely to in-crease in the future. The first EU alcohol strategy was introduced in 2007 and has a strong focus on voluntary social respon-sibility agreements as primary responses. The one more stringent recommendation,
to set the BAC limit for drivers at 0.5g/L, has so far not been adopted by UK policy makers. There is however a strengthening EU role in the development and dissemi-nation of evidence for policy, with com-parisons between countries now regularly used in public debate. Similarly, WHO tends to serve mainly as a reference point for policy effectiveness evidence. This role should increase further with the new Global Alcohol Strategy. While WHO does not propose policies for particular coun-tries, this may make it harder to dismiss evidence-based policies in future. Finally in late 2010, the new Tory Health Secre-tary has annouced a key role for the food and drinks industry in influencing public health policy via so-called responsibility clear networks.
■ Industry influences
indica-tive of close relations between (some sec-tors of) government and industry.
One of the main lobbying groups is the industry-funded Portman Group, estab-lished in 1989 with the “purpose of pro-moting sensible drinking, helping to pre-vent alcohol misuse and abuse, and to help generate a better understanding of alcohol-related issues”. It was heavily criticised for paying academics to anonymously attack a review of alcohol policy effectiveness for the WHO in 1994 (Harkins 2010). Despite this, it took on the role of industry watch-dog in 1996, launching a Voluntary Code of Practice on the Naming, Packaging and Merchandising of Alcoholic Drinks. The Portman Group continues to shape govern-ment strategy with calls for educational interventions, to avoid punishing the ‘vast majority of sensible drinkers’, to recognise individual responsibility for harm, and by rejecting influences of pricing and advertis-ing on consumption (Harkin 2010).
In 2007, the Drinkaware Trust – an in-dustry-funded but independent charity with trustees drawn from academia and social organisations – was launched with the objective of positively changing pub-lic behaviour and the national drinking culture, probably in part as a response to increased concern about rising rates of alcohol-related health harm and antisocial behaviour in downtown areas. It took over all educational activities from the Port-man Group and its weblink now appears together with the recommended drinking message and “enjoy responsibly” on all beverages carrying labels.
Other key lobbying organisations are the Wine and Spirit Trade Association, the British Beer and Pub Association, and the Scottish Whisky Association. These
players regularly respond to (and in some instances dominate) Government and NHS consultation exercises. Examples are recent consultations on minimum pric-ing, promotion restrictions, advertising restrictions and the recently published NICE public health guidelines on alcohol prevention (National Institute for Health and (Clinical Excellence 2010). Finally, in late 2010, the new Torn Health Secre-tary has announced a key role for the food and drinks industry in influencing public-health policy via so-called ‘responsibility deal’ networks.
■ Media and public discourse
There has been little formal UK research on factual media reporting on alcohol, drinking practices, alcohol policy,and al-cohol-related problems (Hansen & Gunter 2007). It appears that media portrayals of alcohol have rarely reflected a balanced view of alcohol use, or of the range of drinking contexts. They tend to link al-cohol dependence to deprivation and homelessness, and binge drinking, espe-cially amongst young women, to deviance. However, at the same time, drinking to in-toxication is regularly portrayed as normal youth behaviour rather than the exception (see Measham & Brain 2005), alongside a view that excessive drinking increas-ingly pervades the society, with negative consequences in terms of anti-social and nuisance behaviour. Where surveys find increases in consumption or harms this seems to receive far more coverage than when trends are stabilising.
the off-trade, and a young people’s rather than a population-wide problem. This has to a degree translated into governmental responses – for example, there is a 2008 youth alcohol strategy and most policies that have been implemented or discussed are more concerned with tackling on-trade drinking. Finally, there is regular empha-sis in public and political debates on how alcohol is part of our culture, and that this is something that it would be difficult, and possibly undesirable, to change.
The current situation:
policy initiatives
There has been much political interest in alcohol during the past five years, and this final section provides an overview of the current (May 2010) state of policy initia-tives.
■ Policies on availability and price
There has been mounting external pressure on government to act on price and avail-ability. The parliamentary health select committee released a report on its alcohol inquiry in early 2010 calling for action (Health Select Committee 2010). A pow-erful statutory health body, the National Institute for Health and Clinical Excel-lence, has backed pricing and availability restrictions (National Institute for Health and Clinical Excellence 2010). There are regular calls for action from the medical profession, including the Government’s outgoing Chief Medical Officer, the Royal College of Physicians and the BMA; from most major health charities and also the Association of Chief Policy Officers. The industry is divided, with some elements favouring action on price, especially in the on-trade sector, which finds that it cannot
compete with supermarket pricing. How-ever, in the written response to the health select committee report (UK Government 2010), the then Labour Government con-firmed that it was not planning to follow recommendations to implement advertis-ing controls, availability restrictions (ex-cept targeting underage drinking), tax by beverage strength or minimum pricing. The industry-friendly new Conservative-Liberal coalition government places a clear emphasis on individual responsibil-ity, treatment and local solutions includ-ing increased local licensinclud-ing powers rather than national policy action.
Taxation: Government has repeatedly
and motivation to absorb tax rises and to continue to use cheap alcohol to draw cus-tomers into the store.
Minimum pricing: The general election brought in a new Conservative-Liberal Democrat coalition government in May 2010. In England, one of the ruling par-ties, the Liberal Democrats, had backed the policy before the general election, but the policy is now not mentioned in their new coalition agreement with the Conservatives. Both Scotland and Wales were actively considering minimum pric-ing, with a Scottish bill setting the mini-mum price of alcohol to 45p per 10ml unit (among other policies around licensing and a social responsibility levy). However, the minority SNP government failed to se-cure support from the opposition parties and the final alcohol bill does not include minimum pricing.
Banning price promotions: In Scotland,
new licensing legislation came into force in September 2009 and bans irresponsible on-trade drinks promotions and in super-markets, alcohol must be located in sepa-rate areas. A bill outlawing off-trade quan-tity discounts was passed by parliament in November 2010. In England, a mandatory retail code came into force in April 2010 to stop the most irresponsible promotions in the on-trade sector (e.g. “all you can drink” offers). However, strong opposition from the drinks industry, supported by the business secretary, meant that proposed sections on outlawing happy-hour promo-tions were dropped at the last minute.
Banning below cost selling: A sales prac-tice that is widely criticised is that of selling alcohol below cost (i.e. a negative gross mar-gin). According to self-reports by the main supermarket chains, 6 out of 7 had sold
al-cohol below cost in the past year, with up to 3% of retailers’ total revenue coming from such loss leaders (Competition Commission 2008). Activity clustered around public holidays and sports events, which are times of fierce competition between retailers. The new government’s coalition agreement con-tained a pledge to ban loss-leading and to consider other price policy options, howev-er, a more recent announcement stated that no action would be taken until 2012 and then only ‘if necessary’.
Availability: The Minimum Legal Pur-chasing Age is 18, or 16 when accompanied by a responsible adult and drinking with a meal. In 2008, the Chief Medical Officer rec-ommended an alcohol-free childhood until age 15, sparking controversy in the media and amongst parents. Whilst not explicitly designed as an availability policy, the Po-licing & Crime Act 2009 (England) created the legislative framework that allowed the introduction of a new mandatory code of practice with new powers to confiscate al-cohol from underage drinkers. Also, small-er measures of besmall-ers, wine and spirits must be made available from October 2010. The new Scottish legislation means that licens-ing boards there are encouraged to consider “overprovision”. Some global retail chains have recently been prevented from expand-ing store space to sell alcohol. This could lead to costly court actions and it remains to be seen whether licensing bodies’ deci-sions are upheld at appeal. A further licens-ing review is belicens-ing undertaken by the new Government.
■ Screening and brief interventions (SCBI)
gener-ally less contentious if they are fully with-in the remit of one government department and there is no industry involvement. A major trial of SCBI in primary care and emergency settings has been funded, with promising early results. Considerable fi-nancial incentives were introduced in 2008 for primary care physicians to screen new patients at registration, a scheme due to run until March 2011. Medical, nursing and midwifery degree providers are now required to cover smoking, drinking and drug use in the curriculum and e-learning modules for brief advice have been cre-ated for existing primary care and hos-pital staff. In 2008, a new campaign was launched by the Ministry of Justice to en-courage staff to provide SCBI for offenders whose alcohol consumption contributes to their offending.
However, these changes appear to be too recent to be reflected in patient experience or GP training levels. In 2009, only 10% of male drinkers, and even fewer female drinkers, had discussed alcohol with a medical professional, unchanged since 2000 (National Statistics 2010d). On aver-age, GPs had received no more postgradu-ate training by 2009 than they had in 1999 (<4 hours in total), but they rated alcohol and other lifestyle behaviours as more of a priority and they were also more prepared to provide interventions (Lock et al. 2010).
■Primary care and specialist treatment
In 2006, treatment and referral guidelines for specialist alcohol treatment were re-vised after studies reported that only be-tween 5 and 10% of alcohol dependent people accessed treatment services and retention was generally poor. From 2008, this has been supported by routine data
collection on alcohol treatment provision, as well as the appointment of regional al-cohol managers who monitor local com-missioning and service delivery. Survey estimates have put the number of depend-ent alcohol users in the UK at 1.1m (with a further 7m drinking above recommended limits), with about 100,000 users in treat-ment at any one time in 2009 (NDEC, 2010).
■ Education and information
them and only a minority of less than 15% of those aware of the unit system said they attempted to keep track of the number of units consumed.
In May 2007, the government negotiated a new voluntary agreement with industry on the introduction of labels on bottles and cans by the end of 2008. Two studies in 2008 showed that large parts of industry failed to comply, and government threat-ened that they were considering the legal and practical feasibility of a mandatory code. A follow-up study in 2009 showed only minor improvements, with 85% of products still not labelled correctly. The industry appeared largely unconcerned with the findings, with the largest grocery chain admitting they had not introduced full labelling even on own-brand products. Again, the Labour Government’s response was that they would consider taking man-datory action “if necessary”.
■Policies tackling drink-driving
The UK has one of the highest drink driv-ing limits in Europe, a blood alcohol con-centration of 80mg per 100ml blood with no special limit for young drivers after a prolonged consultation exercise about a reduction to 50mg during 1998–2000. Random breath testing is not carried out and there is no routine breath testing at the scenes of accidents. If found guilty of drink-driving, penalties are significant, with a license suspension for at least one year and causing death whilst intoxicated punishable with up to 14 years imprison-ment. Two media campaigns per year are run by the Department for Transport. Giv-en downward trGiv-ends in road deaths there is limited public concern or political inter-est in the topic.
Discussion
The UK has seen significant changes in the patterns of consumption during the 1990s and early 2000s, which go some way to explain the rapid increase in al-cohol related admissions and other heavy end consequences in the context of falling per capita consumption. These include a rise in heavy episodic drinking, increas-ing preference of higher alcohol content beverages and a polarisation of the distri-bution of consumption in the population where heavy drinkers drink even higher volumes whilst moderate drinkers appear to have decreased their average intake. To-gether with a lagged effect on harm these may all play a role in driving the continu-ing increase in alcohol related morbidity and mortality, despite a recent downturn in population level consumption.
There is no consensus about why av-erage consumption levels have been de-creasing since about 2004, a trend espe-cially pronounced in children and young adults under the age of 25. Whilst many alcohol-related trends changed direction between 2003 and 2006, several data re-cording mechanisms also changed dur-ing this time (e.g. all government surveys measuring consumption, counting of premise licenses, crime counting rules), making interpretation of trends more diffi-cult. However, a similar rise-and-fall trend is consistently observed across individual and aggregate-level data sources and in different cuts of the population, thus it is unlikely to be explained by changes in methods or recording practices.
effects of the Act appear to have been small with only minor changes to actual availability (Hough et al. 2008). In some instances, changed trajectories precede the Licensing Act, and quite often, simi-lar trends are observed in Scotland, where licensing reforms did not come into force until 2009. No rigorous scientific evalua-tions, for example using interrupted time series methods with Scotland as a compar-ison jurisdiction, were commissioned pri-or to the introduction but there have been several attempts to retrospectively quan-tify potential impacts. There were no con-sistent changes in assault trends, harass-ment offences or criminal damage (Babb 2007; Hough et al. 2008), although there have been potential increases in alcohol-related emergency admissions (Newton et al. 2008).
Except for public education campaigns, no other major alcohol policies were in-troduced during 2003–2007. Availability appears to have remained fairly stable, and affordability continued to increase. Of course it is not possible to say whether consumption decreases would have been more pronounced had affordability de-creased, but there were no sharp price ris-es or availability rris-estrictions that explain the trend change in consumption.
A relevant policy may have been the ban of smoking in public places that came into force in Scotland in March 2006, Wales and Northern Ireland in April 2007 and England in July 2007, with wide media coverage before implementation. Nielsen (2007), an independent market research company, reported that in the year after the introduction of the Scottish smok-ing ban, on-trade alcohol sales volume in Scotland decreased by 5% more compared
to England. However, whilst beer sales dropped, wine sales continued to rise. In English surveys (SOS 2009), most pub drinkers said that the ban had had little effect on their drinking. However, women and young drinkers tended to increase and men and older drinkers to reduce their vis-its to pubs. Recent trends show a sharp de-crease in smoking in younger age groups, and this young non-smoking generation may well prefer the new smoke-free en-vironment. This suggests that smoking bans may have contributed to a shift in the type of consumers frequenting the on-trade. Even before the smoking bans, since 1997, increasing proportions of smokers have stopped smoking in front of children and non-smoking parents do no longer allow smoking in their home. Children’s smoking rates and acceptance of smoking dropped over the same period. Given the strong relationship between youth smok-ing and drinksmok-ing, this might have contrib-uted to the decreased alcohol participa-tion and less favourable attitudes towards alcohol observed in under-25s.
However, studies on other problem be-haviours among adolescents have gener-ally observed that increases in emotional and behavioural problems as well as rates of cannabis use in the last quarter of the twentieth century did not continue in the new millennium (Maughan et al. 2008; National Statistics 2010b). This may indi-cate that more wide-ranging social change has contributed to the current reversal of trends in alcohol consumption, but the ex-act mechanisms are as yet poorly under-stood.
inter-est in the past three years. Since a recent change in the national government and the increasing focus on the economic situ-ation, it appears that some of the momen-tum for policy change, especially on pric-ing, promotion and availability, may have been lost.
Petra Sylvia Meier, professor School of Health and Related Research (ScHARR)
University of Sheffield, UK E-mail: [email protected]
REFERENCES
Babb, P. (2007): Violent crime disorder and criminal damage since the introduction of the Licensing Act 2003, Home Office Report 16/07. Available from http://rds. homeoffice.gov.uk/rds/pdfs07/rdsolr1607. pdf (last accessed 1 Oct 2010)
BBPA/British Beer and Pub Association 2007, 2009. A compilation of drinks industry statistics. Statistical Handbooks Cabinet Office (2004). Alcohol Harm
Reduc-tion Strategy for England. Available from http://www.cabinetoffice.gov.uk/media/ cabinetoffice/strategy/assets/caboffce%20 alcoholhar.pdf (last accessed 1 Oct 2010) BMA Board of Science (2008): Alcohol
mis-use: tackling the UK epidemic. http://www. bma.org.uk/images/Alcoholmisuse_tcm41-147192.pdf (last accessed 1 Oct 2010) Competition Commission (2008): Groceries
Market Investigation. Final Report. Appen-dix 5.6. Below-cost selling. Available from http://www.competition-commission.org. uk/rep_pub/reports/2008/fulltext/538_5_6. pdf (last accessed 1 Oct 2010)
DCMS (2009): Alcohol, Entertainment and Late Night Refreshment Licensing, England and Wales. Available from http://data.gov. uk/dataset/alcohol_entertainment_and_ late_night_refreshment_licensing (last accessed 1 Oct 2010)
DEFRA (2010): Family Food Datasets. Depart-ment for EnvironDepart-ment, Food and Rural Affairs. Available from http://www.defra. gov.uk/evidence/statistics/foodfarm/food/
familyfood/documents/index.htm (last ac-(last ac-cessed 1 Oct 2010)
DfT (2009): Reported Road Casualties in Great Britain: 2008 provisional estimates for accidents involving illegal alcohol levels. Available from Department for Transport http://webarchive.nationalar-chives.gov.uk/+/http://www.dft.gov.uk/ adobepdf/162469/221412/221549/399405/ rcgb08drinkdrive.pdf (last accessed 1 Oct 2010)
Department of Health, Home Office, Depart-ment for Education and Skills, DepartDepart-ment for Culture, Media and Sport (2007): Safe. Sensible. Social. The next steps in the National Alcohol Strategy
Drummond, C. (2004): An alcohol strategy for England: the good, the bad and the ugly. Alcohol and Alcoholism 39: 377–379 ESPAD European School Survey Project on
Alcohol and Other Drugs. Online key results generator. Available from http:// www.espad.org/keyresult-generator. (last accessed 1 Oct 2010)
Eurobarometer 2010. EU citizens’ attitudes to-wards alcohol. EB72.3 (No 331). Available from: http://ec.europa.eu/public_opinion/ archives/eb_special_en.htm (last accessed 1 Oct 2010)
Health Select Committee (2010): Alcohol. First Report of Session 2009–10. Volume 1. Available from http://www.publications. parliament.uk/pa/cm200910/cmselect/ cmhealth/151/151i.pdf (last accessed 1 October 2010)
HMRC (2010): Alcohol Factsheet March 2010. Available from: https://www.uktradeinfo. com/index.cfm?task=factalcohol&hasFlash Player=true (last accessed 1 Oct 2010) Home Office Statistical Bulletin (2009): Crime
in England and Wales 2008/09. Volume 1. Findings from the British Crime Survey and police recorded crime. Available from http://www.homeoffice.gov.uk/rds/pdfs09/ hosb1109vol1.pdf (last accessed 1 Oct 2010)
Hough, M. & Hunter, G. & Jacobson, J. & Cos-salter, S. (2008): The impact of the Licens-ing Act 2003 on levels of crime and disor-der: an evaluation. Home Office Research Report 04. London: Home Office
Hughes, K. & Anderson, Z. & Morleo, M. & Bellis, M.A. (2008): Alcohol, nightlife and violence: the relative, contributions of drinking before and during nights out to negative health and criminal justice out-comes. Addiction 103: 60–65
Lock, D. & Wilson, G. & Kaner, E. & Cassidy, P. & Christie, M.M. & Heather, N. (2010): A survey of general practitioners’ knowledge, attitudes and practices regarding the pre-vention and management of alcohol-related problems: an update of a World Health Organisation survey ten years on. Available from http://www.aerc.org.uk/documents/ pdfs/finalReports/AERC_FinalReport_0058. pdf (last accessed 1 Oct 2010)
Maughan, B. & Collishaw, S. & Meltzer, H. & Goodman, R. (2008): Recent trends in UK child and adolescent mental health. Soc Psychiatry Psychiatr Epidemiol 43 (4): 305–310
Measham, F. & Brain, K. (2005): ‘Binge’ drink-ing, British alcohol policy and the new cul-ture of intoxication. Crime Media Culcul-ture 1: 262–283
Meier, P. & Brennan, A. & Purshouse, P. (2010): Policy options for alcohol price regulation: the importance of modelling population heterogeneity. Addiction 105: 383–393
National Statistics: Alcohol (2003a): Statistics on Alcohol, England. Published by the NHS Information Centre for Health and Social Care, Leeds
National Statistics: Alcohol (2004a): Statistics on Alcohol, England. Published by the NHS Information Centre for Health and Social Care, Leeds
National Statistics: Alcohol (2005a): Statistics on Alcohol, England. Published by the NHS Information Centre for Health and Social Care, Leeds
National Statistics: Alcohol (2006a): Statistics on Alcohol, England. Published by the NHS Information Centre for Health and Social Care, Leeds
National Statistics (2006b): Smoking, drink-ing and drug use among young people in England. Edited by Fuller, E. Published by the NHS Information Centre for Health and Social Care, Leeds
National Statistics: Alcohol (2007a): Statistics on Alcohol, England. Published by the NHS Information Centre for Health and Social Care, Leeds
National Statistics (2007b): Smoking, drink-ing and drug use among young people in England. Edited by Fuller, E. Published by the NHS Information Centre for Health and Social Care, Leeds. (Annual Reports). Avail-able from http://www.ic.nhs.uk/statistics- and-data-collections/health-and-lifestyles- related-surveys/smoking-drinking-and-drug-use-among-young-people-in-england National Statistics: Alcohol (2008a): Statistics
on Alcohol, England. Published by the NHS Information Centre for Health and Social Care, Leeds
National Statistics (2008b): Smoking, drink-ing and drug use among young people in England. Edited by Fuller, E. Published by the NHS Information Centre for Health and Social Care, Leeds. (Annual Reports). Avail-able from http://www.ic.nhs.uk/statistics- and-data-collections/health-and-lifestyles- related-surveys/smoking-drinking-and-drug-use-among-young-people-in-england National Statistics: Alcohol (2009a): Statistics
National Statistics (2009b): Smoking, drink-ing and drug use among young people in England. Edited by Fuller, E. Published by the NHS Information Centre for Health and Social Care, Leeds. (Annual Reports). Avail-able from http://www.ic.nhs.uk/statistics- and-data-collections/health-and-lifestyles- related-surveys/smoking-drinking-and-drug-use-among-young-people-in-england National Statistics (2009c): Mortality.
Refer-ence Table 6.3. Deaths: Selected Causes and Sex, England and Wales. Accessed 10 May on http://www.statistics.gov.uk/STAT-BASE/Product.asp?vlnk=15354
National Statistics (2009d): Mortality. Age-standardised alcohol-related death rates (with 95 per cent confidence limits) by sex and age group in the United Kingdom, 1991–2008. Data based on Office for Na-tional Statistics, General Register Office for Scotland, Northern Ireland Statistics and Research Agency
National Statistics (2010a): Statistics on Alco-hol, England. Published by the NHS Infor-mation Centre for Health and Social Care National Statistics (2010b): Smoking, drink-ing and drug use among young people in England. Edited by Fuller, E. Published by the NHS Information Centre for Health and Social Care, Leeds. (Annual Reports). Avail-able from http://www.ic.nhs.uk/statistics- and-data-collections/health-and-lifestyles- related-surveys/smoking-drinking-and-drug-use-among-young-people-in-england National Statistics (2010c): Consumer Price
Data. Alcohol Price and Retail Prices (all items) Indices derived from the publica-tion “Focus on Consumer Price Indices”, available from http://www.statistics.gov. uk/StatBase/Product.asp?vlnk=867 (last accessed 1 October 2010)
National Statistics (2010d): Mortality. Quan-tifying the contribution of leading causes of death to mortality decline among older people. Health Statistics Quarterly 45 Spring 2010National Statistics (2010e): Opinion Survey Drinking: adults’ behav-iour and knowledge in 2009 http://www. statistics.gov.uk/downloads/theme_health/ drink2009.pdf (last accessed 1 October 2010)
NDEC (2010): Alcohol Treatment Performance Reports. Available from http://www.ndtms. net/alcohol.aspx?level=England (last ac-cessed 1 October 2010)
Newton, A. & Sarker, J. & Pahal, G. & van den Bergh, E. & Young, C. (2007): Impact of the new UK licensing law on emergency hospi-tal attendances: a cohort study. Emergency Medicine Journal 24: 535–538
National Institute for Health and Clinical Excellence (2010): NICE public health guidance 24: Alcohol-use disorders: preventing harmful drinking. Available from http://www.nice.org.uk/nicemedia/ live/13001/48984/48984.pdf (last accessed 1 October 2010)
Nielsen (2007): Notable Decline in Scottish On Trade Alcohol Sales Since Smoking Ban. Accessed 1 May 2010 on uk.nielsen.com/ news/SmokingBan.shtml (last accessed 1 October 2010)
Ofcom/ASA (2007): Young People and Al-cohol Advertising – An investigation of alcohol advertising prior to the Advertising Code changes. Available from http://www. asa.org.uk/Resource-Centre/Reports-and-surveys.aspx (last accessed 1 October 2010) Plant, M. (2004): The alcohol harm reduction
strategy for England. BMJ 328: 905 –906 Public Health Commission (2008): Briefing
notes for a meeting. Downloaded 10th April
2010 from http://www.publichealthcom- mission.co.uk/pdfs/PHCMeetings/P&PoS-Pre-reading1.pdf (last accessed 1 October 2010)
Room, R. (2004): Disabling the public interest: Alcohol strategies and policies for England. Addiction 99: 1083–1089
SALSUS (Scottish Schools Adolescent Life-style and Substance Use Survey) (2009): National Report: Smoking, Drinking and Drug Use among 13 and 15 year olds in Scotland. Published by ISD Scotland, NHS Scotland and National Statistics
Smith, L.A. & Foxcroft, D.R. (2009): Drinking in the UK: an exploration of trends. Joseph Rowntree Foundation: York, UK
UK Government (1999): Our Healthier Nation. Green Paper
response to the health select committee report on alcohol. http://www.official-doc-uments.gov.uk/document/cm78/7832/7832. pdf (last accessed 1 October 2010)
Walker, A. & Flatley, J. & Kershaw, C. & Moon, D. (2009): Crime in England and Wales