Transit Signal Priority: Proposing a Novel Algorithm to
Decrease Delay and Environmental Impacts in BRT Route
Intersections
Mohammad Tamannaei1, Majid Fazeli2, Amir Chamani Foomani Dana3, Hadi Mansourianfar4
Received: 09.09.2018 Accepted: 10.02.2019
Abstract
Intersections are considered as the most critical parts of the Bus Rapid Transit (BRT) system. Transit signal priority is one of the efficient solutions to reduce BRT fleet delays at intersections. The aim of this study is to propose a new algorithm to decrease the BRT fleet delays at actuated intersections, while reducing the negative impacts on different approaches. The adaptive strategy is applied in this study. In the proposed algorithm, named TSPAT (Transit Signal Priority for Actuated Timing), intersection phasing is rescheduled, based on traffic conditions such as phase conditions at the time of bus arrival, the queue length of other approaches, and prioritization record in a specific time length. To assess the merits of the proposed algorithm, a before-after study is executed by applying VISSIM traffic simulation software for an actuated intersection in Isfahan city, Iran. The simulation results show that by applying the algorithm, the average delay of BRT fleets is declined by 21 % and 51% in peak and off-peak hours, respectively. Furthermore, the average speed of BRT fleets is increased by 26% and 78%, during peak and off-peak hours, respectively. The utilization of TSPAT algorithm can improve the desirability of the public transportation system along the BRT routes.
Keywords: Transit signal priority, actuated timing, intersection, bus rapid transit, algorithm.
Corresponding author E-mail: [email protected]
1Assistant Professor, Department of Transportation Engineering, Isfahan University of Technology, Iran 2 MSc. Grad., Department of Civil Engineering, Isfahan University of Technology, Iran
3 MSc. Grad., Department of Transportation Engineering, Isfahan University of Technology, Iran
4 Ph.D. Student, School of Civil and Environmental Engineering, University of New South Wales, Sydney,
1. Introduction
Intersections are the most critical parts of the BRT systems. The mixed operation of BRT fleets and other vehicles at intersections may lead to an increase in delay of public transportation and consequently a decrease in its desirability to such an extent that casts doubts on the establishment of BRT routes (Deng & Nelson, 2013; Levinson et al. 2003). Therefore, finding ways in order to decrease transit delay can have a vital effect on the serviceability and justification of BRT system [Deng & Nelson, 2013]. Transit signal priority (TSP) is one of the principal methods to reduce the BRT delays, which leads to a decrease or elimination of the stops experienced by the BRT fleet. Transit signal priority is recognized as an efficiency index of BRTs all around the world [Hensher & Golob, 2008]. The technologies such as Automatic Vehicle Location (AVL) and advanced control systems help to improve the transit signal priority [Hounsell & Shrestha, 2005]. The delay of vehicles at intersection originates the aggregation of several parameters such as: breaking time before intersection, stopping time at intersection, and accelerating after intersection [Roess, Prassas and McShane, 2011]. These parameters are mentioned in Figure 1.
The aim of the present study is to propose a TSP-based algorithm to reduce the delay of BRT fleet at actuated intersections, as well as to decrease the negative impacts on other approaches of the intersection. The rest of the article is structured as follows: In part 2, previous studies associated to the transit signal priority are introduced. In part 3, the proposed algorithm to prioritize BRT fleets in actuated signals is presented. In part 4, the algorithm is assessed through VISSIM traffic simulation software. Finally, the conclusion remarks are presented.
2. Background
Passive, active, and adaptive strategies are the three strategies for BRT fleet prioritization at intersections [Chen, Yu, Zhu, Yuand Guo, 2008; Ma & Yang, 2007], considered as main strategies of Transit Signal Priority (TSP). In passive strategies, there exist no detections for the signal priority; so, the system works based on a pre-defined schedule. This system can be implemented for any route in which transit operation is predictable. In active strategies, the system works responsive and there exist detections of the transit vehicles. Adaptive strategies consider delay of both BRT fleet and overall traffic and use real-time detection [Yang, Wang, Wang, Hanand Society, 2013]. Additionally, there are some methods to prioritize the BRT fleets at intersections, such as: Green Extension Method, Early Green Method, Red Interruption, Queue jumping, and Phase Splitting. In the following, some studies associated to the field of transit signal priority are presented:
Figure 1. Delay of vehicles at intersection [Roess et al. 2011].
extension method. The INTEGRATION Traffic Simulator software was accommodated to assess the widespread effects of the public transport priority systems. The results show 23% reduction in delay of the intersection’s crossing buses. Ma and Yang (2007) developed a relationship between distribution of BRT lines, signal cycle lengths and number of Decision Support Systems (DSSs). Based on their results achieved by VISSIM software simulation, both bus delays and headway dispersion were reduced after implementing their proposed algorithm. G. Zhou, Gan, and Shen (2007) presented a strategy to prioritize BRT fleet based on a parallel genetic algorithm, in order to optimize the phasing plan for all users (including public and private transportation systems). The results of the simulation in VISSIM environment indicate the ability of the algorithm to reduce delays of both BRT fleet and passenger cars. Xu, Sun, and Zheng (2010) investigated the effects of an active strategy prioritization on an isolated intersection. The results demonstrate considerable financial benefits after implementing the algorithm. Abdy and Hellinga (2010) developed a model to recognize the effects of both green time extension and red time reduction methods on delay. They applied the VISSIM software to simulate the model in an isolated intersection. Christofa and Skabardonis (2011) proposed an algorithm to improve the performance of intersections with BRT prioritization at intersections with two or more BRT routes. They assessed their algorithm by simulating an isolated intersection located in Greece. The results show a significant reduction in delays for intersection users. Zlatkovic, Stevanovic, Martin, and Tasic (2012) tried to find the best way to prioritize the BRT fleets for the future of Utah transportation network. To achieve this aim, they modeled different priority situations on BRT fleet. The results illustrate that two priority strategies including phase rotation and prioritization method have the best
performance in the future of Utah network. J. Li et al. (2012) attempted to prioritize public transportation system at an isolated intersection with fixed timing signals. This study was carried out using the VISSIM traffic simulator to examine the potential effects of their developed method. The results show that designing an algorithm to predict the arrival time of a bus is the key of success in prediction systems of public transportation. Ding, Yang, Wang, Xu, and Bao (2015) focused on optimization of bus stopping time prediction at stations using simulation in VISSIM. The results indicate a reduction in intersection delays, stopping rates and the pollution generated by fleet. Bagherian, Mesbah, and Ferreira (2015) presented a new solution to evaluate the BRT priority at intersections of the transportation network. They developed a function in which important parameters such as traffic flow rate and signal type are included. The results can appropriately model the existing traffic conditions. R. Li, Zheng, and Li (2016) developed an optimization model of transit signal priority control, in order to minimize passengers’ delay at intersections. The results of their before-after study indicate 12% decrease in passengers’ delay in comparison with no-prioritization conditions. Wolput, Christofa, and Tampère (2016) attempted to find optimal time cycle at intersections, by applying a method of increasing the green time and reducing the red time and phase rotation. Their results lead to reduction of delays at intersections for the bus fleet.
Al-Deek, Sandt, Alomari, and Hussain (2017) assessed two different conditional TSP strategies including TSP for buses 3 minutes or more behind schedule and TSP for buses 5 minutes or more behind schedule. Conditional TSP 3 Minutes behind improved travel times (17 – 26%), average speed (30 – 39%), and average total delay per vehicle (11 – 32%) for the main through movements compared with the base scenario.
Ye and Xu (2017) proposed a decision model that addresses any conflict between two opposing BRT requests. This model favors more delayed BRT and takes into account interactions between BRTs and infrastructures. Akasi et al. (2018), proposed a new algorithm to reduce the effect of the intersections on BRT fleet delays. The results of their study showed that the proposed algorithm could reduce the delays of BRT fleet but employing their algorithm could increase the delay in other approaches.
In previous studies, different strategies and methods of transit signal priority (TSP) have been developed which lead to positive effects on delay of BRT fleet at intersections. However, there is a lack of enough research on prioritization of BRT fleet to reduce negative impacts of TSP on opposing approaches. In fact, few studies have focused on TSP to reduce BRT delays, together with reduction of the impacts on other approaches. In this study, we propose a novel algorithm for transit signal priority, in order to prioritize BRT fleet based on an adaptive strategy at actuated intersections. This algorithm applies Green Extension and Early Green methods, as well as consideration of traffic conditions on both BRT opposite and approaches of the intersection.
3. Proposed Algorithm: TSPAT
Algorithm Pseudo-code: Transit Signal Priority for Actuated Time intersection (TSPAT)
The algorithm proposed in this study is named TSPAT. The main function of this algorithm is
to reschedule the intersection phasing based on traffic conditions such as phase conditions at the time of bus arrival, the queue length of other intersection approaches, and prioritization record in a specific time length. The BRT approach which needs prioritization is named “considered approach” in this study. All other approaches are named “opposing approaches”. The terms used for current study are mentioned below:
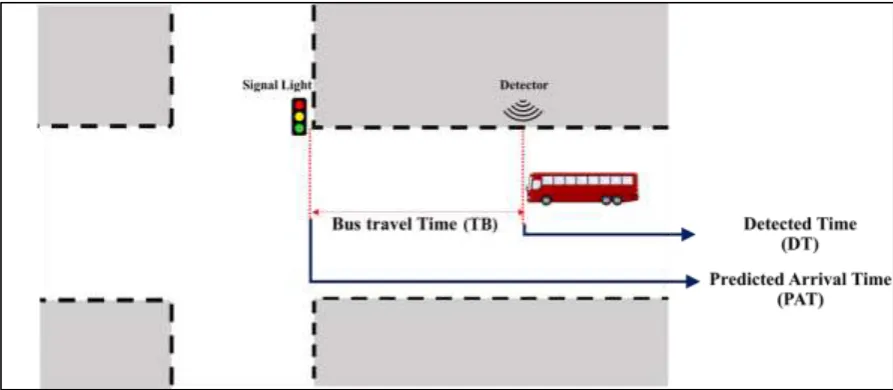
In the proposed algorithm, 𝑇𝐵 represents the predicted duration required for the bus to pass the distance between detection point and the intersection. 𝑃𝐴𝑇 stands for predicted arrival time of BRT. All of parameters are summarized in
Table 1. Note that 𝑇𝐵 depends on the distance of detectors from the intersection, BRT speed, deceleration and acceleration rates, and dwell time. Parameters 𝐴𝑇 and 𝑅𝑇 are applied in green extension (GE) and early green (EG) methods, respectively. 𝑁𝑘 is the maximum
allowable number of prioritization during last five minutes, at interval 𝑘. This parameter is applied in the algorithm to restrict number of prioritization. The logic behind this parameter is that assigning too many prioritizations in a specific approach of the intersection may cause too much increase of the delays incurred to the other approaches. Three important parameters of the algorithm, 𝑃𝐴𝑇, 𝐷𝑇 and 𝑇𝐵 parameters are illustrated in Figure 2.
Considerations:
Contrary to the passive and active strategies (which focus on BRT fleet only), the adaptive strategy can regard both BRT fleet and vehicles in opposing approaches. In this study, the proposed TSPAT takes three considerations into account, in order to evaluate the conditions of the opposing approaches and make appropriate decisions:
Consideration 1: Number of accepted requests for TSP in each approach
approaches, which can increase the global level of dissatisfaction. Hence, in the proposed algorithm, the number of prioritization in last five-minute period is restricted to 𝑁𝑘. This parameter depends on the traffic condition and the day intervals. We assume 𝑁𝑘 = 2 for morning peak hours, 𝑁𝑘 = 3 for night peak hours, and 𝑁𝑘 = 5 for off-peak hours of the day. If the number of prioritization in five-minutes period exceeds 𝑁𝑘, no prioritization is performed for the considered approach. Consideration 2: Queue lengths in opposing approaches
Negligence from the queue lengths of the opposing approaches can lead to intersection spill-back conditions, which has negative impacts on both intersection capacity and safety. The parameter 𝑄𝑖𝑀𝑎𝑥 is defined as
the maximum queue length in opposing approach i, whose green time is allowed to be reduced. So, if 𝑄𝑖 > 𝑄𝑖𝑀𝑎𝑥, then the algorithm is not allowed to reduce the green phase duration of opposing approach i.
Consideration 3: BRT presence in opposite approach
Assume a case in which a BRT vehicle is detected in the considered approach, and another BRT vehicle is detected in opposing approach i at the same time. In such a case, the algorithm is not allowed to reduce the green phase duration of approach i. The reasoning behind this consideration is that the extra delay imposed to the BRT fleet in the opposing approach can basically cast doubts on the TSP purposes.
Table 1. The parameters applied in this study Input
parameters Definition
𝑇𝐵
TB Predicted duration required for the bus to pass the distance between detection point and the intersection 𝑃𝐴𝑇 Predicted Arrival Time of BRT fleet to the intersection
𝑁𝑘 Maximum allowable number of prioritization during last five minutes, at interval 𝑘 𝐴𝑇 Value of green time extension for considered (BRT) approach
𝐺𝑖 Green phase duration for approach i
𝑅𝑇 Value which can be reduced from green phase duration of each opposing approach
𝑄𝑖 Queue length in opposing approach i
𝑄𝑖𝑀𝑎𝑥 Maximum queue length in opposing approach corresponding green time i, for which it is allowed to reduce the 𝐺𝑖𝑀𝑎𝑥 Maximum green time, which can be assigned to approach i
𝑡 Time passed from start of a cycle
𝐷𝑇 Time passed from start of a cycle when the BRT fleet is detected
International Journal of Transportation Engineering, 158
Figure 2. Time concepts associated to the proposed algorithm
Conceptual Model of TSPAT
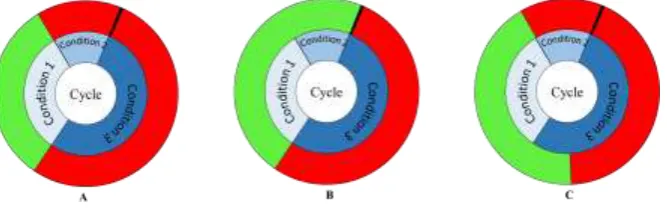
The conceptual model of the proposed algorithm (TSPAT) is simply illustrated in Figure 3. According to this figure, when BRT fleet -detected in the considered approach- arrives to the intersection, three cases may occur, which are based on three different conditions. 𝐶𝑜𝑛𝑑𝑖𝑡𝑖𝑜𝑛1 is the green duration in regular timing (without prioritization). The total red time duration of the considered approach is divided into two periods: 𝐶𝑜𝑛𝑑𝑖𝑡𝑖𝑜𝑛2 and 𝐶𝑜𝑛𝑑𝑖𝑡𝑖𝑜𝑛3. 𝐶𝑜𝑛𝑑𝑖𝑡𝑖𝑜𝑛2 is a part of the red time duration in which the green phase can be extended (GE method can be applied). The length of 𝐶𝑜𝑛𝑑𝑖𝑡𝑖𝑜𝑛2 is equal to 𝐴𝑇 (value of green time extension). 𝐶𝑜𝑛𝑑𝑖𝑡𝑖𝑜𝑛 3 is a part of red time duration in which the early green (EG) method can be applied, while GEmethod cannot be applied. It is clear that the length of 𝐶𝑜𝑛𝑑𝑖𝑡𝑖𝑜𝑛3 is the difference between the total red time and 𝐴𝑇. The Proposed Algorithm (TSPAT)
The pseudo code of the proposed algorithm (TSPAT) is presented as follows.
The operation of the algorithm in different conditions are as follows:
A) PAT ∈ Condition1: in this case, BRT fleet arrives in green time and crosses the intersectionwithout any stop.
B) PAT ∈ Condition2: in this case, BRT fleet arrives at most AT seconds after the green phase is finished. If the opposing approaches meet the three mentioned considerations, then the algorithm is allowed to extend the green time, in order to pass the BRT fleet through the intersection without any stop.
Figure 3. BRT prioritization method in the proposed TSPAT algorithm
A:BRT arrives in green time, B: BRT arrives at most AT seconds after the end of the greenphase,
C: BRT fleet arrives in red time
Algorithm Pseudo-code: Transit Signal Priority for Actuated Time intersection (TSPAT) Input: parameters presented in Table 1
Output: the intersection retiming through TSPAT
1. detect the BRT fleet
2. If any BRT fleet is detected in each route 3. 𝑡 ← 𝑡 + 𝑇𝐵
4. If the phase of considered approach (approach i) is not green 5. If number of previous prioritizations does not exceed 𝑁𝑘 6. 𝑡 ← 𝑡 + 𝐴𝑇
7. If the phase of approach i is green 8. 𝐺𝑖← 𝐺𝑖+ 𝐴𝑇
9. Else
10. While 𝑃𝑁 > 0
11. 𝑖 ← 𝑖 + 1, 𝑃𝑁 ← 𝑃𝑁 − 1 12. If 𝑄𝑖 is less than 𝑄 𝑖 𝑚𝑎𝑥
13. If there is no detected BRT fleet in approach i
14. 𝐺𝑖𝑚𝑎𝑥 ← 𝐺𝑖𝑚𝑎𝑥− 𝑅𝑇 15. End If
16. End If 17. End While 18. End If
19. End If
20. End If 21. End
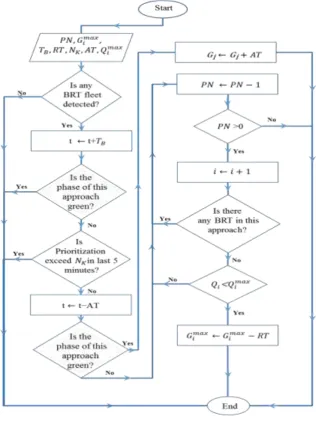
As mentioned in the pseudo code, both green extension and red reduction methods are utilized in the proposed TSPAT algorithm. The flowchart of the algorithm is presented in
4. Assessment of the Proposed
TSPAT Algorithm
To assess the merits of the proposed algorithm, a before-after study is executed for an actuated intersection. Accordingly, VISSIM simulation software and its actuation programming module called VISVAP are applied. The proposed algorithm TSPAT is implemented in VISVAP software and then, the code is exported to the software as a signal timing method.
Case Study
The case study is “Freiburg intersection” in Isfahan city, Iran. This name is referred to the fact that Isfahan is twinned with Freiburg, Germany, since 2000. The reasons why this intersection is selected are mainly due to the BRT route passing through, as well as the BRT station close to the intersection. Freiburg intersection is one of the main intersections of Isfahan, in which the SCATS software is applied for its signal timing. The timing method applied is based on prediction of the cycle length, according to the last three recorded cycles.
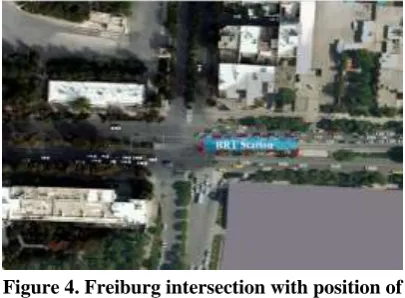
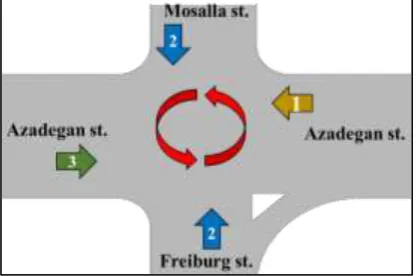
Geometric Features of the Intersection Freiburg intersection is located at the southern district of Isfahan city, at the intersecting point of Azadegan, Freiburg and Mosalla streets. The BRT route passing the intersection is at the line 1 of Isfahan BRT network. The BRT station of Freiburg intersection is illustrated in Figure 4.
Figure 4. Freiburg intersection with position of BRT station
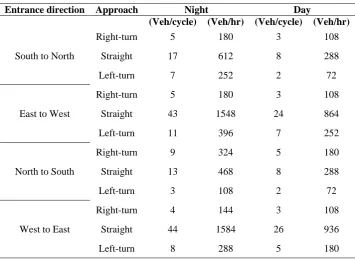
In the east-bound of the intersection, Azadegan Street has two lanes for crossing passenger cars and one lane for BRT fleets. This street is widened to three lanes for passenger cars, for a length of 75 meters along the street from the physical area of the intersection. The north-bound has two lanes for passenger cars, with no BRT lane. The west-bound has three lanes for passenger cars, as well as one extra BRT lane. The south-bound has three passenger car lanes, with no BRT route. The geometry of Freiburg intersection is depicted in Figure 5. To collect the input data required for simulation, two field surveys were carried out from Freiburg intersection. The surveys were done in 30th January of 2017, at 7:30 to 8:30, and 19:00 to 20:30, for day and night hours, respectively. All of the traffic volumes passed through different approaches of the considered intersection were counted by two persons, for the 5-minute periods. The average traffic data per cycle are shown in
Figure 5. Freiburg intersection in Isfahan city
Table 2. Average entering traffic data per cycle
Entrance direction Approach Night Day
(Veh/cycle) (Veh/hr) (Veh/cycle) (Veh/hr)
South to North
Right-turn 5 180 3 108
Straight 17 612 8 288
Left-turn 7 252 2 72
East to West
Right-turn 5 180 3 108
Straight 43 1548 24 864
Left-turn 11 396 7 252
North to South
Right-turn 9 324 5 180
Straight 13 468 8 288
Left-turn 3 108 2 72
West to East
Right-turn 4 144 3 108
Straight 44 1584 26 936
Left-turn 8 288 5 180
Characteristics of BRT Fleets
The average values of BRT headways in Azadegan Street are 2 and 4 minutes, for peak and off-peak hours, respectively. The average time of the fleet boarding and alighting of the BRT passengers is 8.6 seconds, with a standard deviation of 3.98 seconds. The Freiburg intersection has a three-phase plan which operates in actuated timing. For each one of the east-bound and west-bound approaches, a
separate phase is assigned; while another phase is jointly allotted to both north-to-south and south-to-north approaches. The phase sequences in Freiburg intersection are illustrated in
Figure 6. Phasing and rotation of phases at Freiburg intersection
ratio of served vehicles in queue passing in a cycle are presented in
Table 3. Parameters of TSPAT algorithm applied for Freiburg intersection are shown in Table 4.
Figure 6. Phasing and rotation of phases at Freiburg intersection
Table 3. Signal data collected in Freiburg intersection
Entrance direction Passed percentage Average green phase time (in seconds)
Phase 1 East to West 60.84% 39
Phase 2 South to North 59.46% 16 North to South 37.5%
Phase 3 West to East 122.92% 33
Table 4. Parameters of TSPAT algorithm used for Freiburg intersection Input
parameters Value
𝑁𝑘 2, in morning peak hours, 3 in night peak hours, 5 in off-peak hours 𝐴𝑇 10 seconds.
𝑅𝑇 8 seconds
𝑄𝑖𝑀𝑎𝑥 70 meters for each approach
𝑃𝑁 3
Model Calibration
The calibration is referred to any process, aiming to decrease the simulation ambiguities and increase the validity, such that both model and reality act the same (Group, 2013). VISSIM simulation software comprises several input
behavior logic of urban areas in simulation software. These three parameters change saturation flow rate of traffic in the shade of safety factors. Saturation flow rate is the number of vehicles that can pass a link freely. The criterion of the calibration is the equality of the saturation flow rates in both field and simulated model, so that the delays experienced by vehicles would approximate to the reality. Therefore, in order to calibrate the simulated intersection, traffic volumes entering the simulated environment in a specific time have been considered as the input which equals the real intersection traffic input. Subsequently, the output of simulated intersection has been counted using data collection detectors and finally the results have been approximated to the real traffic output of the intersection by changing calibration parameters manually. It should be noted that traffic composition used in the simulation equals the real data collected from the field. These parameters are calibrated by comparison of the results of virtual detectors in VISSIM software, and the data collected from field surveys. Moreover, lane change distance is calibrated. This factor is the minimum distance allowed to the vehicles to change lanes before reaching the intersection. 5. Results and Discussion
To evaluate prioritization of BRT fleet at intersections, the proposed algorithm is modeled in two types of intersection timings: without and with applying TSPAT algorithm. Each one of these two types are considered for peak and off-peak hours.
Intersection Delay
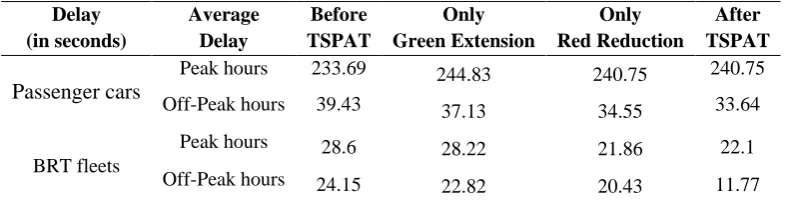
The BRT delays at intersection include braking time before intersection, stopping time at intersection, and accelerating after intersection deceleration delay, the boarding and alighting delays, and acceleration delay (Chen, Hellinga, Changand Fu, 2015). The intersection delays including the passenger cars and BRT fleets for both peak and off-peak hours are presented in Table 5. According to this table, four different methods are compared: no change in signal timing (before TSPAT), only applying Green Extension method, only applying Red Reduction method, and applying the proposed algorithm (After TSPAT). As shown in Table 5, implementing the proposed TSPAT algorithm leads to 0.03% increase and 14.6% decrease in the intersection passenger cars delays for peak and off-peak hours, respectively. It implies the capability of the proposed algorithm to reduce the delays suffered by all approaches of the intersection, even the opposing approaches. Also, by applying TSPAT, BRT delays are decreased by 21.2% and 51.26% in peak and off-peak hours, respectively. The results indicated that in off-peak hours, the application of TSPAT outperforms all other methods. The difference in some constraining input parameters for peak and off-peak hours (like queue length, maximum allowable prioritization numbers, etc) leads to the difference in delay reductions at peak and off-peak hours.
Table 5. Intersection delays before and after applying TSPAT Delay
(in seconds)
Average Delay
Before TSPAT
Only Green Extension
Only Red Reduction
After TSPAT Passenger cars
Peak hours 233.69 244.83 240.75 240.75
Off-Peak hours 39.43 37.13 34.55 33.64
BRT fleets
Peak hours 28.6 28.22 21.86 22.1
It should be noted that while developing “Only Red Reduction” algorithm in VISVAP module environment, all stated considerations have been maintained and only the Green Extension part of the TSPAT algorithm has been eliminated. Additionally, “Only Green Extension” algorithm is similarly created by merely omitting the red reduction part of TSPAT algorithm. Therefore, preserving different considerations (such as opposite queue lengths and number of prioritization) in both “Only Red Reduction” and “Only Green Extension” algorithms would have improved the quality of these algorithms, such that a slight advantage for “Only Red Reduction” algorithm is observed during peak hours. It is noteworthy that in off-peak hours, TSPAT algorithm shows the best results, which means that it has considerable efficiency in many hours of daily operation.
Average speed
The average speed of BRT fleet is calculated by the ratio of distance between two specified
points, and the time duration for BRT to cross this distance with consideration of all the decelerating obstacles between two points, including the stations, intersections and left-turning movements. The results of intersection modelling for four different methods are presented in
Table 6.
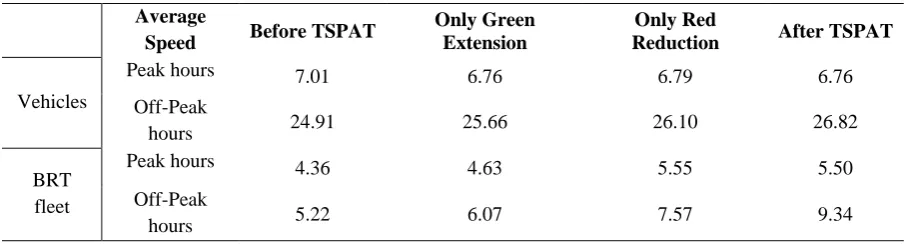
The average speed of BRT at the intersection has an increase of 26% and 78% in peak hours and off-peak hours, respectively. This difference is mainly due to the opposing approaches circumstances in adaptive strategy. In peak hours, the average speed of passenger cars has a reduction of 3.5%. This parameter is augmented by 7.6% during off-peak hours. Average speed of all intersection users at peak hour is decreased, due to the reduction of permissive number of prioritization at peak hours and the emergence of queue conditions in opposing approaches. In this situation, TSPAT algorithm reduces the number of prioritization by preventing deterioration of traffic conditions in opposing approaches.
Table 6. The average speed of intersection vehicles (km/h) Average
Speed Before TSPAT
Only Green Extension
Only Red
Reduction After TSPAT
Vehicles
Peak hours 7.01 6.76 6.79 6.76
Off-Peak
hours 24.91 25.66 26.10 26.82
BRT fleet
Peak hours 4.36 4.63 5.55 5.50
Off-Peak
hours 5.22 6.07 7.57 9.34
Table 7. Pollution generated by intersection users (gram/hour)
Pollution VOC CO NOx
Only Red Reduction 8617.80 37184.70 7234.00
After TSPAT 8630.00 37238.00 7245.00
Off-Peak hours
Before TSPAT 2004.00 8647.00 1682.00
Only Green Extension 1856.48 8010.00 1558.00
Only Red Reduction 1908.00 8236.00 1602.40
After TSPAT 1864.00 8042.00 1565.00
Generated Pollution
One of the simulation outputs in this study is the amount of pollution generated by intersection users before and after prioritizing the BRT fleet at the intersection. Vehicle trajectories of the simulated environment which show separate vehicles speeds and accelerations is crucial for emission calculation. This feature can be activated in VISSIM software by using node evaluation tools. Pollutants included in the simulation involves volatile organic compounds abbreviated as VOC, carbon monoxide and nitrogen oxides. Amounts of these pollutants have been calculated in grams per hour of simulation run and consider vehicles in queues and movements according to their speeds, acceleration and deceleration maneuvers. It is noteworthy to mention that vehicle types used in the simulation are typical vehicles observed in the field considering their size and fuel consumption. Consequently, calculated pollutants and fuel consumptions are meaningful and applicable. Values in Table 7
shows the amount of these pollutants for four different methods
The results of this simulation show an average increase of 2% for pollutants at peak hours and a decrease of 6.9% for pollutants during off-peak hours.
Fuel Consumption
Fuel consumption is calculated based on simulated vehicles characteristics, such as their stops, accelerations and speeds and their different fuel consumption levels based on their models. Fuel consumption and air pollutants are calculated in applied simulation software separately. Table 8 shows the fuel consumption of intersection users for four different methods. According to the results, the application of TSPAT leads to an increase of 2.9% in fuel consumption in peak hours, but a decrease of 6.5% in off-peak hours. The fuel consumption increase in peak hours can be originated from the queue phenomenon formed in opposing approaches. This phenomenon can be prevented by decreasing the level of priority assigned to BRT fleet during peak hours. Of course, this should not be overlooked that due to the limited peak hours per day, the entire systems pollution will be ameliorated.
Cost-Benefit Analysis
servers. AVL (automatic vehicle location) is a system of determining geographical location of a vehicle using GPS technology. The costs are
determined for four peak hours and eleven off-peak hours in a work day, regarding both BRT fleet users and other intersection users. . Table 8. Fuel consumption of intersection users before and after TSPAT (liter/hour)
Fuel Consumption
Before TSPAT
Only Green Extension
Only Red Reduction
After TSPAT
Peak hours 1960.84 2019.14 2013.76 2017.62
Off-Peak hours 465.60 439.11 446.07 435.30
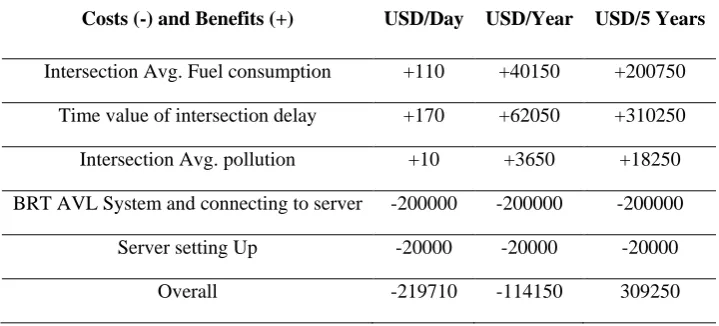
Table 9. Estimation of costs and benefits of employing TSPAT algorithm at one intersection Costs (-) and Benefits (+) USD/Day USD/Year USD/5 Years
Intersection Avg. Fuel consumption +110 +40150 +200750
Time value of intersection delay +170 +62050 +310250
Intersection Avg. pollution +10 +3650 +18250
BRT AVL System and connecting to server -200000 -200000 -200000
Server setting Up -20000 -20000 -20000
Overall -219710 -114150 309250
The time value for each passenger is considered based on comprehensive transportation studies of Isfahan metropolitan area (Ranjbar Falah & Bahoush Keyvani, 2013). The average vehicle occupation in Isfahan is 1.5 for passenger cars, and 50 and 30 for buses in peak and off-peak hours, respectively.
The unit costs and benefits applied in our study are presented in Table 9. These costs and benefits are estimated separately for one day, one year and five years. This table shows that application of TSPAT algorithm at intersections is considered beneficial for the urban transportation system
6. Conclusions
simulation results after applying TSPAT, the total intersection delay increases by 0.03% in peak hours and decreases by 14.60% in off-peak hours. The average speed of BRT fleets would increase by 26% and 78% in peak and off-peak hours, respectively. The reduction of delay through applying TSPAT is an important issue for BRT fleet, since the increase in delay of BRT fleet and consequently the decrease in its desirability can cast doubts on the
establishment of BRT route. Also, the
application of the algorithm increases the air pollutants by 2.9% in peak hours; whereas it leads to a decrease of 6.9% in air pollutants in off-peak hours. Average fuel consumption is increased by 2% for peak hours and is decreased by 6.5% in off-peak hours. According to the results, the investment costs of applying TSPAT (specially for hardware equipment) cannot be compensated in one year; so, in the first year after application of TSPAT, the benefits are less than the costs. However, after five years, the benefits of TSPAT exceed the costs, which shows the economic justification of the proposed algorithm. Comparison between TSPAT and other algorithms such as “Only Green Extension” and “Only Red Reduction” is also conclusive. The “Only Green Extension” algorithm appears to be less practical compared to TSPAT algorithm. However, preserving different considerations such as opposite queue lengths and number of prioritization in “Only Red Reduction” algorithm would yield to a slight advantage for this algorithm during peak hours, in comparison with TSPAT. It is noteworthy that TSPAT algorithm shows the best results in off-peak hours, which means that it has considerable efficiency in several hours of the daily operation. Nevertheless, for a better serviceability of BRT fleet, it is recommended to use a combination of “Only Red Reduction” in peak hours and TSPAT in off-peak hours during the day.
The results of this research indicate that utilization of the proposed TSPAT algorithm at intersections is affordable for the urban transportation system.
7. Acknowledgements
We would like to represent our gratitude to the Isfahan’s Municipality, Bus Service Organization, and Isfahan Traffic Control Center experts, for sharing their pearls of wisdom with us during the course of this research. This study is funded by Isfahan’s Municipality according to the research project entitled “Signalization Retiming at Urban Intersections for Transit Priority, Case Study: Route 1 of BRT System in Isfahan City”, Project code: 121/95/1800.
8. References
-Abdy, Z. R. and Hellinga, B. R. (2010) "Analytical method for estimating the impact of transit signal priority on vehicle delay", Journal of Transportation Engineering, Vol. 137, No. 8, pp. 589-600.
-Al-Deek, H., Sandt, A., Alomari, A. and Hussain, O. J. J. o. I. T. S. (2017) "A technical note on evaluating the effectiveness of bus rapid transit with transit signal priority", Vol. 21, No. 3, pp. 227-238.
-Bagherian, M., Mesbah, M. and Ferreira, L. (2015) "Using delay functions to evaluate transit priority at signals. Public Transport", Vol. 7, No. 1, pp. 61-75.
-Christofa, E. and Skabardonis, A. (2011) "Traffic signal optimization with application of transit signal priority to an isolated intersection", Transportation Research Record: Journal of the Transportation Research Board, No. 2259, pp.192-201.
-Deng, T. and Nelson, J. D. (2013) "Bus Rapid Transit implementation in Beijing: An evaluation of performance and impacts", Research in Transportation Economics, Vol. 39. No. 1, pp. 108-113.
-Ding, J., Yang, M., Wang, W., Xu, C. and Bao, Y. (2015) "Strategy for multiobjective transit signal priority with prediction of bus dwell time at stops", Transportation Research Record: Journal of the Transportation Research Board, No. 2488, pp.10-19.
-Group, P. (2013) "PTV Vissim 7 User Manual. PTV AG, 240".
-Hensher, D. A. and Golob, T. F. (2008) "Bus rapid transit systems: a comparative assessment", Transportation, Vol. 35, No. 4, pp. 501-518.
-Hounsell, N. and Shrestha, B. (2005) "AVL based bus priority at traffic signals: a review of architectures and case study", European Journal of Transport and Infrastructure Research, No. 5 (EPFL-ARTICLE-158663), pp.13-29.
-Levinson, H., Zimmerman, S., Clinger, J., Rutherford, S., Smith, R. L., Cracknell, J. and Soberman, R. (2003) "Bus rapid transit", Transit Cooperative Research Program Report, 90.
-Li, J., Wang, W., van Zuylen, H., Sze, N., Chen, X. and Wang, H. (2012) "Predictive strategy for transit signal priority at fixed-time signalized intersections: Case study in Nanjing, China", Transportation Research Record: Journal of the Transportation Research Board , No. 2311, pp.124-131.
-Li, R., Zheng, C. and Li, W. (2016) "Optimization model of transit signal priority control for intersection and downstream bus stop", Mathematical Problems in Engineering, Vol. 2016, Article ID: 9487190, 8 pages. -Ma, W. and Yang, X. (2007) "A passive transit signal priority approach for bus rapid transit
system", Paper presented at the Intelligent Transportation Systems Conference, 2007. ITSC 2007. IEEE.
-Rakha, H. A., Ahn, K. and Collura, J. (2006) "Evaluation of green extension transit signal priority strategies using portable GPS receivers", Paper presented at the Transportation Research Board 85th Annual Meeting.
-Ranjbar Falah, M. R. and Bahoush Keyvani, S. (2013) "Estimating economic costs due to pollutant gases emission (NOx, SO2, CO2) on Iranian gross domestic product", Journal of Science and Environmental Engineering, Vol. 55, pp.57-69.
-Roess, R. P., Prassas, E. S. and McShane, W. R. (2011) "Traffic engineering", London: Prentice Hall, 816 pages.
-Wolput, B., Christofa, E. and Tampère, C. M. (2016) "Optimal cycle-length formulas for intersections with or without transit signal priority", Transportation Research Record: Journal of the Transportation Research Board , No. 2558, pp.78-91.
-Xu, H., Sun, J. and Zheng, M. (2010) "Comparative analysis of unconditional and conditional priority for use at isolated signalized intersections", Journal of Transportation Engineering, Vol 12, No. 136, pp.1092-1103.
-Yang, M., Wang, W., Wang, B. and, Han, J. (2013) "Performance of the priority control strategies for bus rapid transit: comparative study from scenario microsimulation using VISSIM", Discrete Dynamics in Nature an dSoceity, Vol. 2013, Article ID: 398938, 9 pages.
-Ye, Z.and Xu, M. (2017) "Decision model for resolving conflicting transit signal priority requests", IEEE Transactions on Intelligent Transportation Systems, Vol. 18, No. 1, pp. 59-68.
-Zhou, L., Wang, Y. and Liu, Y. (2017) "Active signal priority control method for bus rapid transit based on vehicle infrastructure integration", International Journal of Transportation Science and Technology, Vol. 6, No. 2, pp. 99-109.
- Zhou, G., Gan, A. and Shen, L. D. (2007) "Optimization of adaptive transit signal priority using parallel genetic algorithm", Tsinghua
Science & Technology, Vol. 12, No. 2, pp. 131-140.
Zlatkovic, M., Stevanovic, A., Martin, P. and Tasic, I. (2012) "Evaluation of transit signal priority options for future bus rapid transoit line in Xest Valley City, Utah", Transportation Research Record, Journal of the Transportation Research Board, No.. 2012, pp. 176-185
![Figure 1. Delay of vehicles at intersection [Roess et al. 2011].](https://thumb-us.123doks.com/thumbv2/123dok_us/9441.2000690/2.595.316.559.467.670/figure-delay-vehicles-intersection-roess-et-al.webp)