OF IRON OXIDES AND SULPHIDES
A thesis submitted for the degree of DOCTOR OF PHILOSOPHY
of the
AUSTRALIAN NATIONAL UNIVERSITY
by
Catherine Ann MeCaramon
T h is t h e s i s i s t h e r e s u l t o f r e s e a r c h p e rfo rm e d d u r in g t h e p e rio d March 1979 t o S ep tem ber 1983 w h ile I was a f u l l - t i m e s tu d e n t a t t h e R e s e a rc h S cho ol o f E a r th S c ie n c e s , A u s t r a l i a n N a ti o n a l U n iv e r s ity . The work i s e n t i r e l y my own, u n l e s s o th e r w is e ack n o w le d g ed . Uhis t h e s i s h a s n e v e r b een s u b m itte d t o a n o th e r U n i v e r s i t y o r s im i la r i n s t i t u t i o n .
ACKNOWLEDGEMENTS
I thank my supervisors, A.E. Ringwood and I. Jackson, for their partici
pation in what turned out to be a rewarding four years of research.
A.E. Ringwood was a continual source of innovative ideas providing new
lines of research to pursue. I am indebted to I. Jackson for countless
hours of discussion, and for his careful and constructive criticism of my
work. The infectious enthusiasm of both my supervisors always provided a
source of excitement regarding experimental results, and their high academic
standard undoubtedly improved mine. I am grateful to L. Liu for supervising
the first two years of my research, and for numerous hours of instruction
in the art of using the diamond anvil cell. The Mössbauer component of my
research was made possible by D.C. Price (formerly at R.S.Phys.S., ANU)
and J. Cashion (Dept, of Physics, Monash University), who permitted me
access to their equipment. I am indebted to both of them for their interest
in my work and their expertise in the subject which greatly extended my
knowledge of the Mössbauer effect through numerous discussions. I am
grateful to H. O'Neill who substantially contributed to my understanding
of thermodynamics. Technical support was provided by K. Massey, N. Ware,
H. Neisler, A. Major and W. Hibberson, and I am particularly indebted to the latter two for their generous assistance throughout the course of my
research. Financial support was provided by an ANU Ph.D. scholarship,
and I am grateful to RSES for providing monetary support to attend
conferences and conduct Mössbauer experiments at Monash University. My
greatest debt is to my parents who have unselfishly provided encouragement
and financial support through all phases of my education. This thesis is
a tribute to their confidence in my ability. Finally, I am especially
indebted to Richard for our happy life together, and who never fails to
PREFACE
The research described in this thesis overlaps several scientific disciplines, and a number of concepts from different subjects are used to discuss the behaviour of compounds studied. While most readers will be familiar with these subjects at the levels that they are presented in this thesis, a list of suggested references is provided in the case that
additional material is desired.
Thermodynamics: Kern, R. and Weisbrod, A. Thermodynamics for Geologists, Freeman, Cooper and Co., 1967»
Crystal field theory: Burns, R.G. Mineralogical Applications of Crystal Field Theory, Cambridge University Press, 1970.
Molecular Orbital Theory: Cotton, F.A. and Wilkinson, G. Advanced Inorganic Chemistry, Interscience, 1972.
Band theory and magnetism: Kittel, C. Introduction to Solid State Physics, John Wiley and Sons, 1976 (5th ed).
Behaviour of compounds in this thesis may be alternately described in terms of crystal field theory, molecular orbital theory and band theory, depending on which is the most convenient to describe the particular phenomena.
During the course of the research there have been opportunities to publish most of the work, and a list of these publications is given below. McCammon, C.A. and Price, D.C. (1982). A Mössbauer effect investigation of
the magnetic behaviour of (Fe,Co)S^+x solid solutions, J. Phys. Chem. Solids k3 431-^37• (Chapter 3)
McCammon, C.A. and Cashion, J. A Mössbauer study of (Fe,Mn)S and (Fe,Mg)S solid solutions at 298 K and h.2 K (in preparation). (Chapter 4)
McCammon, C.A., Jackson, I. and Ringwood, A.E. High-pressure phase rela tions in the systems FeS-MnS and FeS-MgS (in preparation). (Chapter 5) McCammon, C.A. and Liu, L. (1983) The effects of pressure and temperature
on nonstoichiometric wllstite, Fe^O: The iron-rich phase boundary, Phys. Chem. Minerals, in press. (Chapter 6)
McCammon, C.A., Ringwood, A.E. and Jackson, I. (1983). Thermodynamics of the system Fe-FeO-MgO at high pressure and temperature and a model for formation of the Earth's core, Geophys. J. R. astr. S o c . J2_ 577-595. (Chapter 8)
McCammon, C.A., Ringwood, A.E. and Jackson, I. (1983). A model for formation of the Earth's core, J. Geophys. Res. 88_ (supplement) A501-A506. (Chapter 8)
In all but the latter two manuscripts, the coauthors' contributions were mainly of collaborating on original ideas of the first author. The latter two manuscripts were based on original ideas of A.E. Ringwood, which were developed by the first author using thermodynamic calculations and arguments in collaboration with A.E. Ringwood and I. Jackson. The manuscripts were written by the first author.
vi
ABSTRACT
The complex and diverse behaviour exhibited by transition metal compounds
is primarily attributed to the presence of d electrons in their outer
bonding orbitals. The behaviour of FeO, FeS and some of their solid
solutions is explored in the context of transitions at high pressure that
have potential relevance to geophysics. The transitions studied are
changes in spin state, magnetic transitions, changes in degree of electron
delocalization, changes in oxidation state and B1/B8 (NaCl/NiAs)
polymorphism. Mössbauer spectra recorded of a series of (Fe,Co)S solid solutions in the B8 structure imply increasing delocalization of electrons
between Fe and S as the CoS endmember is approached, resulting in
substantially decreased magnetic hyperfine interactions involving the Fe
nuclei. Based on the similarities in Mössbauer parameters and interatomic 57
distances between high-pressure phase FeS and Fe:CoS, the degree of
electron delocalization may be similar in the two compounds. Mössbauer
spectra recorded of a series of (Fe,Mn)S and (Fe,Mg)S B1 solid solutions
enables an assessment of the likely physical properties of the
hypothetical phase FeS(B1) to be assessed. FeS(B1) is inferred to be more
ionic than FeS(B8), and nonmetallic, and AV between the B1 and B8
polymorphs is calculated to be - 7.2%. The large negative AV should result
in an exsolution of a B8 phase from (Fe,Mg)S and (Fe,Mn)S B1 solid
solutions at high pressure, and this behaviour is confirmed
experimentally. The low and pressure-independent solubilities observed for
Mg and Mn in the B8 phase suggest that B8 polymorphism is unlikely for
both MnS and MgS at high pressure. The change in stoichiometry (oxidation
state) of FexO in equilibrium with Fe is determined experimentally at high pressure and temperature, and correlation of the experimental results with
theoretical calculations of the phase boundary suggests that the bulk
modulus of FexO does not vary significantly with composition for x £ 0.96.
One consequence of this conclusion is that changes in stoichiometry of
Fex0 at high pressure should result in only small changes in density. The
nature of the defect structure of Fex0 (x = 0.95 to 0.98) is explored
using Mössbauer spectroscopy, and a physical model which behaves in a consistent manner according to the changing numbers of defects indicates
that the relative populations of defect arrangements vary rapidly with
exsolution of essentially pure FeO(hpp) from (Fe,Mg)0 B1 solid solutions
at high pressure. Thermodynamic calculations of the phase boundary
indicate that FeO(hpp) exsolution is not likely to be important in the
present-day lower mantle, but may have been important in the formation of
the Earth's core. Evidence for the miscibility of Fe and FeO in the liquid
state is reviewed, and a series of schematic phase diagrams of the system
Fe-FeO at high pressure is proposed where a low melting point alloy forms,
analagous to the system Fe-FeS at low pressure. Exsolution of FeO(hpp)
from (Fe,Mg)0(B1) and the low melting point Fe-FeO alloy provide a means
viii
TABLE OF CONTENTS
CHAPTER 1 INTRODUCTION
1 . 1 C o m p o s itio n and M in e r a lo g y o f t h e Lower M a n tle and C o r e ---1
1 . 1 . 1 Lower m a n tle --- 1
1 . 1 . 2 C o r e ---2
1 . 2 S tu d y in g I r o n M in e r a ls a t H igh P , T --- 3
1 . 2 . 1 T r a n s i t i o n m e t a l c h e m i s tr y --- 4
1 . 2 . 2 I n d i r e c t e x p e r i m e n t a l m e th o d s --- 7
1 . 3 O u t l i n e o f T h e s i s ---8
CHAPTER 2 EXPERIMENTAL METHODS 2 .1 L a rg e-V o lu m e H i g h - P r e s s u r e A p p a r a tu s --- 9
2 . 1 . 1 A p p a r a tu s d e s c r i p t i o n a n d r u n p r o c e d u r e --- 9
2 . 1 . 2 T e m p e r a tu r e m e a su re m e n t --- 11
2 . 1 . 3 P r e s s u r e c a l i b r a t i o n --- 11
2 . 2 Diamond A n v il C e l l ---13
2 . 2 . 1 Quench e x p e r i m e n t s --- 13
2 . 2 . 2 C o m p re s s io n e x p e r i m e n t s --- lU 2 .3 A n a l y t i c a l T e c h n iq u e s --- 15
2 . 3 . 1 X - r a y d i f f r a c t i o n --- 15
2 . 3 . 2 E l e c t r o n m ic r o p r o b e --- 15
2 . 3 . 3 M ö ssb a u e r s p e c t r o s c o p y --- 15
CHAPTER 3 THE SYSTEM FeS-C oS 3 .1 I n t r o d u c t i o n --- 17
3 .2 E x p e r im e n t a l P r o c e d u r e --- 20
3 .3 R e s u l t s --- 20
3.*+ M a g n e tic T r a n s i t i o n i n (F e , C o ) S --- 25
3 .5 H i g h - P r e s s u r e P h a s e o f F e S ---29
2+ 3 .6 D i s c u s s i o n o f Fe S p in S t a t e i n F e O ---33
CHAPTER k (F e,M n )S AND (F e ,M g )S : THE B1 STRUCTURE U .l I n t r o d u c t i o n --- 35
h . 2 E x p e r im e n t a l P r o c e d u r e --- 36
h . 3 M ö ssb a u e r S p e c t r a a t 298 K --- 36
J+ .3.1 P r e v i o u s w o r k --- 36
h . 3 - 2 E x p e r im e n ta l r e s u l t s a n d i n t e r p r e t a t i o n ---38
U . U .
1
Previous w o r k ---1+1
4.4.2 Fitting the s p e c t r a --- 42
4.4.3 Interpreting the s p e c t r a ---1+2 4.5 The Hypothetical Phase FeS(Bl) ---1+5 4.6 Distortions of the B1 Structure at High P r e s s u r e --- 47
4.6.1 MnS - new compression results ---47
4.6.2 FeO - relevance of MnS r e s u l t s --- -— -
51
CHAPTER 5 (Fe,Mn)S and (Fe,Mg)S: HIGH-PRESSURE PHASE DIAGRAM 5.1 I ntroduction---
53
5.2 Experimental Procedure ---
53
5.3 Experimental Results ---
56
5.3.1 X-ray diffraction - the phase d i a g r a m ---
56
5.3.2 Optical examination of exsolution textures ---
58
5.3.3 Mössbauer spectra of high-pressure runs --- 64
5.4 Theoretical Calculation of High-Pressure Phase Diagrams ---
68
5.4.1 F e S - M g S ---
68
5.4.2 F e S - M n S --- 70
5.5 Implications for FeO-MgO at High P , T --- 72
CHAPTER
6
NONSTOICHIOMETRY OF FeO AT HIGH PRESSURE 6.1 I n t r o d u c t i o n ---74
6.2 Previous W o r k --- ---
75
6.3 Experimental Procedure ---
75
6.4 Experimental Results ---
76
6.5 Theoretical Calculation of x at High P , T ---
78
6.5.1 General m e t h o d ---
78
6.5*2 Thermodynamic parameters --- 80
6.5.3 Variation of a with x in Fe 0 ---
8
l x 6.5.4 Variation of K with x in Fe 0 --- 84x
6.6
R e s u l t s ---86
6.7 Interpretation of the Shock Wave Data of F e ^ O --- 91
CHAPTER 7 DEFECT STRUCTURE OF Fe 0 x 7.1 Introduction --- 93
7-2 Experimental Procedure --- 93
7-3 Mössbauer Spectra of Fe 0 at 298 K ---94
7.4 Mössbauer Spectra of Fe 0 at 4.2 K --- 100
X
CHAPTER 8 PHASE RELATIONS IN THE SYSTEMS FeO-MgO AND Fe-FeO
8.1 Introduction--- 103
8.2 The System F e O - M g O ---103
8.2.1 The high-pressure phase of F e O --- 103
8.2.2 Calculation of the FeO-MgO phase d i a g r a m --- 105
8.2.3 R e s u l t s --- 106
8.2. U Implications for the E a r t h ---108
8.3 The System F e - F e O --- 111
8.3.1 The Fe-FeO phase diagram at 0.1 M P a ---111
8.3.2 Melting curves for Fe and F e O --- 113
8.3.3 The effect of pressure on liquid immiscibility --- 11^
8.3. ^ The effect of pressure on eutectics of F e - F e O --- 115
8.3.5 The Fe-FeO phase diagram at high p r e s s u r e --- ll6 8. U Formation of the Earth's C o r e --- ll6 CHAPTER 9 CONCLUSION 9.1 S u m m a r y --- 122
9.2 Future W o r k --- 126
APPENDIX AN INTRODUCTION TO MÖSSBAUER SPECTROSCOPY A.l T h e o r y --- 128
A. 2 E x p e r i m e n t --- 131
A. 3 Mössbauer P a r a m e t e r s --- 132
CHAPTER 1 INTRODUCTION
Physical properties of the Earth’s interior such as density,
elasticity and electrical conductivity can be measured from the surface of
the Earth using seismic, gravity and electromagnetic methods. A synthesis
of information derived from these sources with temperature-pressure-depth
profiles and results of detailed studies of relevant minerals at high P,T
can provide models of the Earth in terms of mineralogy and chemical
composition. This method has been relatively successful in constraining
the composition and mineralogy of the upper mantle and transition zone
because of access to the upper ^ 200 km of the mantle through magmatic
material, and the relatively large body of experimental data available
regarding the behaviour of N a , C a , A 1 , Mg and Fe silicates at high
temperatures and pressures up to ^ 30 GPa (corresponding to ^ 800 km depth
within the Earth). As a consequence of the more limited information available from experiments at higher pressures and the uncertainty
concerning the nature of the 650 km discontinuity, the composition and
mineralogy of the lower mantle and core are relatively less well
constrained.
1.1 Composition and Mineralogy of the Lower Mantle and Core
1.1.1 Lower mantle
The lower mantle extends from 800 km to 2800 km depth within the
Earth, and is characterized by a relatively uniform variation of seismic
wave velocities with depth. Recent density models derived from inversion
of gross Earth data (e.g. Dziewonski and Anderson, 1981) indicate that deviations (if present) from homogeneity must be minor, and they are not
necessary to account for the bulk of the available observational evidence.
There is, however, evidence from recent body wave studies of fine
structure in the uppermost lower mantle to depths of ^ 1200 km
(Hendrajaya, 1981; Muirhead and Hales, 1980; Wright, 1983) and in the
lowermost mantle below 2400 km depth (Wright and Lyons, 1981; Lay and
Helmberger, 1983). The probable mineralogy of the lower mantle has been
inferred on the basis of shock wave experiments and static phase
transformation studies of upper mantle mineral assemblages at high P,T to
be a mixture of (Mg,Fe)Si0^ (perovskite), (Mg,Fe)0 (rocksalt), Ca^Al^SiO^
(sodium titanate) and NaAlSiO^ (calcium ferrite) (Liu, 1978; Liu, 1979;
2
Studies regarding the chemical composition of the lower mantle have
involved either (1) relating seismic models to elasticity-density-pressure
profiles of relevant minerals obtained from shock compression studies or
equations of state based on low-pressure elasticity data, or (2) comparing
experimentally measured incompressibilities and densities of the relevant
mineral assemblages with the incompressibility and density of the lower
mantle obtained by extrapolating lower mantle parameters to standard
pressure-temperature conditions using adiabatic equations of state. There
are several uncertainties, however, which constrain proposed models of
lower mantle composition to be only consistent with available data, and by
no means unique. These uncertainties include the nonuniqueness of seismic
lower mantle density models (Worthington, 1973), differences in phase and
temperature between the lower mantle and shock compression curves (e.g.
Davies, 1974), and the wide trade-off between the composition and
temperature of the lower mantle and the assumed properties of lower mantle
phases (Davies, 1974; Jackson, 1983). A lower mantle composed of pyrolite
(a widely accepted model of upper mantle composition; see Ringwood, 1975; Green et a l ., 1979) has been shown to be approximately consistent with
available seismic and laboratory data in a wide variety of independent
analyses (e.g. Ringwood, 1970; Davies, 1974; Mao, 1974; Ringwood, 1975;
Graham and Dobrzykowski, 1976; Watt and O'Connell, 1978; Jackson and
Ahrens, 1979; Jackson, 1983), and while not required, substantial enrichment in silica of the lower mantle relative to the upper mantle,
possibly coupled with iron depletion, is equally consistent with the
seisraological and laboratory data.
1.1.2 Core
The outer core extends from 2900 km to 5080 km depth within the Earth,
and is interpreted to be liquid by the absence of shear wave propagation.
The inner core is inferred to be solid from free oscillation data which
are best fit with finite rigidity (V ^ 3.5 km/sec) for the inner core.
Comparison of seismic pressure-density profiles with shock compression
curves of various cosmochemically abundant materials has revealed that the
core is composed predominantly of F e , mixed with an uncertain, though
probably small, amount of Ni. Seismic models indicate, however, that the
core is ^8-10% less dense than pure Fe at similar conditions, and
therefore a light element (or elements) must be present to account for the
studies; see Brett, 1976, and references therein for a review). It is
generally believed that the light element is confined to the outer core,
leaving an inner core of relatively pure Fe-Ni.
The nature of the light element, X, is important for a number of
reasons. The temperature at the inner core-outer core boundary is related
to the freezing of Fe-Ni from the liquid, and is determined by melting
relations in the Fe-Ni-X system. Several models for the Earth’s geodynamo
(e.g. Gubbins, 1977; Loper, 1978) have proposed that the power comes from
freezing of the outer core material; the dynamics of this process are
influenced by the abundance and density of the light element in the outer
core and melting relations in the relevant system. The electrical
conductivity of the outer core is also likely to be sensitive to
composition (Johnston and Strens, 1973)• affecting the energetics of the
core (Bullard and Gellman, 1954). The nature of the light element is
important in constructing models of core formation which require knowledge
of phase relations in the relevant systems (particularly Fe-X, but also
Fe-X-MgO-SiO^) at lower P,T conditions to describe the partitioning of the
light element into the core.
1.2 Studying Iron Minerals at High P,T
The importance of iron mineral studies at high P,T to determining the
composition of the lower mantle and core is evident from the above
discussion, and emphasizes the need for more detailed studies at higher
pressures and temperatures. Compared to Na, Ca, Mg and A1 silicates, the
behaviour of Fe compounds at high P,T is generally less well catalogued.
This results partly from the structure of the cation outer electrons. Na+
(1s22s22p6 ), Mg2+ (1s22s22p6 ), Al3+ (1s22s22p6 ) and Ca2+ (1s22s22p63s2 3p6 )
all have closed electron shell configurations, and behaviour of their
oxides and silicates follows numerous empirical systematics which have
been derived from experiments involving similar compounds over a number of
years. It is generally observed, however, that transition metal compounds
do not follow these systematics, because the outer electronic
configuration of transition metal ions involves partially filled d
1.2.1 Transition metal chemistry
Elements of the first transition series have the electronic
configuration (1s22s22p^3s23p^3d10-n4s1 or 2 ) where the 4s electrons and
one or more 3d electrons are lost when forming ions. In an isolated
transition metal ion, the five d orbitals are degenerate, but in a crystal
lattice the effect of a nonspherical electrostatic field splits the five d
orbitals according to the type, position and symmetry of the ligands
surrounding the transition metal ion. Under several simplifying
assumptions, the orbital energies can be calculated using crystal field
theory; Fig. 1.1 illustrates the distribution of electrons in the 3d
energy levels of a dD ion (e.g. Fe ) in tetrahedral and octahedral sites.
The lower relative energy associated with d^ ions in octahedral
coordination explains the preference of Fe2+ for octahedral sites.
The presence of partially filled d orbitals increases the number of
possible transitions which must be considered when interpreting data or
predicting behaviour of transition metal compounds at high P,T. Several transitions are discussed below:
(1) High-spin •» low-spin transitions
Distribution of the d electrons between orbitals is governed by two
opposing tendencies: electrostatic repulsion between electrons favours the
distribution of electrons in as many different orbitals as possible, while the crystal field effect favours spin pairing of electrons in the
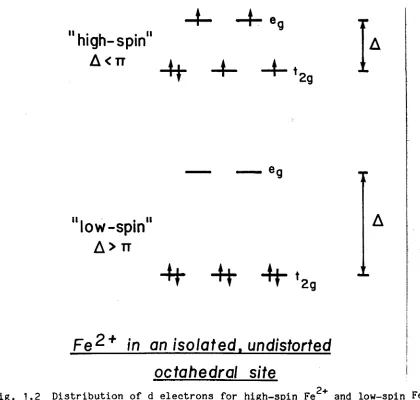
stabilized orbitals. At atmospheric pressure most Fe2+ compounds (oxides,
silicates, some sulphides) are in the high-spin state, where there are
four unpaired electrons (Fig. 1.2). The crystal field energy varies
approximately inversely with the fifth power of the interatomic distance
5
(A 'v* A0 (rQ /r) ) and the spin-pairing energy decreases with increasing covalency of the metal-ligand bond, so the low-spin state should be stable
for Fe2+ at sufficiently high pressure. The decrease in the number of
unpaired electrons (see Fig. 1.2) and the reduction in ionic radius of the
low-spin state result in diamagnetic behaviour and a significantly
increased density of the Fe2+ low-spin compound.
(2) Change of oxidation state
The relatively gradual increase of ionization potential with ionic
charge leads to a range of possible oxidation states for most first-row
4
4
-12/5 A t
3 /5 A t
A-%
4
tetrahedral
2/5A ,
[image:15.554.150.506.54.310.2] [image:15.554.78.498.367.767.2]M
4
4
|octahedrol|
A j= 4 /9 AQfor equal M-X distances
Fig. 1.1 Relative energy levels of d orbitals of a transition metal ion in tetrahedral and octahedrgl coordinations, showing the distribution of electrons for a high-spin dD ion (after Burns, 1970).
ii I • , . ii
high-spin
A
< TT
“H"
II , .11
low-spin
A
> TT
-H- -H-%
F e ^ + in
a
n
/so/ated.
un
octahedral site
6
other cations, is energetically favoured in a number of transition metal
systems (the monoxides, in particular). The equilibrium composition of a
nonstoichiometric compound is sensitive to the partial pressure of the
relevant constituents in the gaseous phase, and therefore varies as a
function of pressure and temperature. Because molar volume and elastic
properties may vary with composition, a nonstoichiometric compound can
undergo a continuous transition at high pressure which changes its
density.
(3) Metallic transitions
Although not restricted to transition metal compounds, metallic
transitions are more likely to occur in Fe compounds (e.g. oxides and
sulphides) at lower pressures than in Mg, Na, Ca and A1 oxides and
silicates because of d electrons. Metallic transitions are generally
described in terms of band theory, which regards the electrons as
occupying bands which are constructed by overlapping metal and ligand
atomic orbitals (tight binding model). A solid is regarded as an insulator
if all of the occupied bands are full of electrons, and as a metal if any
bands are only partially full.
The d bands in transition metal compounds are constructed by mixing of
metal d orbitals with ligand s and p orbitals, with the band width
dependent on the degree of mixing. These compounds tend towards metallic
behaviour as pressure is increased, because the enhanced overlap between
metal and ligand atomic orbitals increases the degree of electron
delocalization by broadening the bands. It is also possible to have
discontinuous insulator-metal transitions at high pressure, and there are
a number of proposed mechanisms (e.g. Van Zandt and Honig, 1974). All
involve a drastic increase in the conducting properties of the solid, and
usually a significant increase in density.
(4) Magnetic transitions (order-disorder)
The unpaired electrons of transition metal ions contribute to a net
magnetic moment of each atom, which can interact with magnetic moments on
other atoms to produce a bulk magnetization of the crystal. The
magnetization varies as a function of pressure and temperature, and therefore transitions corresponding to ordering or disordering of atomic
spins are possible. These transitions can involve changes in density
because there may be coupling between elastic strain and magnetization
are FeO, MnO and MnS which exhibit a progressive rhombohedral distortion
on cooling below the Neel temperature at atmospheric pressure. Although
density changes associated with magnetic transitions at high pressure are
likely to be small, the drastic change in magnetic properties must be
considered in determining the behaviour of the high-pressure phase.
1.2.2 Indirect experimental methods
It is often difficult to determine the crystal structure of a high-
pressure phase if it cannot be quenched to atmospheric pressure,
particularly if the high-pressure phase is of low symmetry since many
x-ray diffraction lines are required to determine the structure
unambiguously. If large transition pressures are involved, the relative
uncertainties of the x-ray lines may be increased due to nonhydrostatic
stress and pressure gradients on the sample. In addition, the change in
crystal structure may be accompanied by one of the transitions discussed
above, several of which are likely to be reversible with pressure (high-
spin + low-spin, metallic and magnetic), and these may further impede
unambiguous determination of the crystal structure. It is often
convenient, therefore, to study transitions in analogue compounds at lower
pressures.
The use of analogue compounds in studying systems which are
experimentally difficult has been successful in a number of studies. The crystal chemical relationships between silicates and germanates have been
exploited to predict silicate phase transformations at high pressure
(Ringwood, 1970), and the elastic properties of many compounds can be
predicted on the basis of their analogues (Liebermann, 1974; Jones and
Liebermann, 1974; Davies, 1976). It is not surprising to learn, however,
that transition metal oxides do not follow elastic systematics derived for
other oxides such as MgO, CaO or SrO (Davies, 1976), and much of the
discrepancy may be accounted for by crystal field contributions to the lattice energy (Ohnishi and Mizutani, 1978).
Analogues for transition metal compounds must be judged not only on
the basis of similar crystal structure, but also on the basis of similar
outer electron configuration; thus analogues should be chosen for the
coordinating ligands, not the transition metal ion. One possibility is the
use of transition metal chalcogenides (S, S e , Te) as analogues for
transition metal oxides. Although little data is available to test the
8
involved in transition metal chalcogenides relative to transition metal
oxides indicates that the greatest use of the analogues is probably in
detailing already known transitions and identifying new transitions which
may occur in the oxides at higher pressure, without necessarily expecting
a one-to-one correlation between transitions in chalcogenides and oxides.
1.3 Outline of Thesis
This thesis presents work relating to the behaviour of FeO, FeS and
some of their solid solutions at high pressure. Both 0 and S have been
proposed as candidates for the light element in the core (Birch, 1952),
and therefore studies of both FeO and FeS are important. FeS is also studied in this thesis as an oxide analogue, in the spirit of providing
further ideas for transitions of FeO at high pressure. Chapter 2 describes
the experimental apparatus, calibration and run procedures that were used
in the experiments. Chapters 3 and 4 present studies that were undertaken of (Fe,Co)S, (Fe,Mn)S and (Fe,Mg)S solid solutions to study different
aspects of the behaviour of Fe^+ , and to derive new knowledge about the
FeS(B1) endmember. Chapter 5 describes studies of (Fe,Mn)S and (Fe,Mg)S
that define the high-pressure phase relations, and their relevance to (Fe,Mg)0. The stoichiometry of FexO is studied as a function of pressure
and temperature in Chapter 6, and a thermodynamic model is developed to
account for the observations; the analysis demonstrates that the
observations tightly constrain the variation of elastic properties with
composition. Chapter 7 explores the defect structure of FexO (via the
Mössbauer spectra) which might account for the proposed elastic
properties. Chapter 8 presents calculations of the FeO-MgO phase diagram
at high P,T, and implications for the lower mantle are discussed. A consideration of the Fe-FeO phase diagram at high P,T completes the
framework of a model for core formation involving oxygen as the principal
light element. Mössbauer spectroscopy is a prominent tool used in studying
FeO, FeS and their solid solutions in this thesis; the appendix provides a
CHAPTER 2 EXPERIMENTAL METHODS
2.1 Large-Volume High-Pressure Apparatus
Advantages of using this type of apparatus include well controlled and
constrained P,T conditions and a relatively large sample volume. The major
disadvantage is restriction to only moderate pressures (< 7 GP a ) .
2.1.1 Apparatus description and run procedure
a) Piston Cylinder - The single-stage piston cylinder apparatus was used
(in the "piston-in" configuration described by Green et a l.# 1966) to
generate pressures of up to 4.5 GPa. The sample is loaded into the
assembly illustrated in Fig. 2.1a and placed inside a 0.5” (inner
diameter) pressure vessel. Normal run procedure involves the application
of an axial load of 'v 180 tons (metric) to the pressure vessel via a
hydraulic press, followed by the use of a second hydraulic press to drive
a 0.5" piston which compresses the sample assembly. Current is applied to
the graphite furnace until the run temperature is reached, and frequent
corrections are made to the applied load during the course of a run to
maintain the pressure to within + 0 . 0 5 GPa. The run is quenched by
terminating the flow of current to the furnace, causing the temperature to drop to 500 K within 10 seconds, and bleeding off the pressure over a
period of about 5 minutes.
b) Girdle Apparatus - The high-pressure girdle apparatus described by
Liebermann et al.(1974) and modified by Ringwood and Major (unpublished
data) was used to generate pressures in the range 5-7 GPa. The sample is loaded into the assembly shown in Fig. 2.1b and placed inside a tungsten
carbide die which opens out at either end with a 65° angle. The load is
applied using tungsten carbide pistons which taper with 60° angles to a
truncated face. Unfired pyrophyllite gaskets are placed between the walls
of the die and the anvils. Normal run procedure consists of a gradual
application of pressure until the run pressure is reached and then a
controlled application of temperature. Only minor corrections to the
pressure are necessary during a run. Quenching of the run is performed in
an identical manner to the piston cylinder except that bleeding off of the
pressure occurs overnight.
c) Bridgman Anvil Cell - A large-scale version of the apparatus described
by Nishikawa and Akimoto (1971) was used to generate pressures in the
10
I--- 1.5"--- 1
thermocouple
["Jpyrophyllite (unfired)
Q pyrophyllite (fired)
□ pyrophyllite ( 9 2 3 K )
0 stainless steel
^ t a l c
0 boron nitride
H p y re x
| graphite
UK multite
0 sample capsule
0 alumina
^ c ru s h a b le alumina
[image:20.554.90.509.47.709.2]pyrophyllite ring which was prefired at 923 K for 1.5 hours (Fig. 2.1c).
The assembly is placed between opposed tungsten carbide anvils, each with
a 30° taper ending at a truncated face of 1.5” diameter. The anvils are
slowly loaded until the required pressure is reached and the subsequent
run procedure and quenching process take place as described for the girdle
apparatus.
2.1.2 Temperature measurement
Temperatures were measured with a Pt/Pt ^ R h ^ thermocouple, and are
uncorrected for the effect of pressure on the e.m.f. Experiments by
Getting and Kennedy (1970) indicate that run temperatures measured with
Pt/PtgQR h 10 thermocouples near 1273 K at 3 GPa would be a maximum of 15 K
higher than actually measured. Single thermocouples were used for runs in
the piston cylinder and Bridgman anvil cell, whereas two thermocouples
were employed with the girdle apparatus. Temperatures generally differed
by 20 K - 25 K between the two thermocouples; the higher temperature of
the two was always taken to be the run temperature.
2.1.3 Pressure calibration
a) Piston Cylinder - Experimental pressures in the piston cylinder are
determined on the basis of the applied load and a 10% (+3%) downward
correction for friction. The friction correction is the result of the work
of several investigations, the most recent being a study by O'Neill and Hibberson (RSES Annual Report, 1981) who determined correction factors of
8-13% Tor talc cells in the piston cylinder on the basis of LiCl and AgCl
melting points.
b) Girdle Apparatus - Experimental pressures were determined using the
results of experiments by Ohtani (unpublished data) on the quartz-coesite
and fayalite-spinel transitions (Fig. 2.2a). Pressures based on this
calibration curve are thought to be accurate to within + 0 . 5 GPa.
c) Bridgman Anvil Cell - Calibration curves for the Bridgman anvil cell
are very sensitive to the firing temperature of the 1.5” pyrophyllite
gasket. Previous room temperature (Ringwood and Major, unpublished data)
and 1273 K (Sinclair, 1982) calibration curves for gaskets fired at 1123 K
are illustrated in Fig. 2.2b. The pyrophyllite used in the calibrations
was not available for the present work, however, and the new batch of
pyrophyllite was fired at a temperature (923 K) where the behaviour of the
12
15
s.
o
Lü
cr
3
CO CO LÜ
cc
CL
o c i fayalite-spinel ' 1273 K
o (DO®« quartz-coesite
/ 1473 K
100
150
LOAD
TONS (metric)
T = 2 9 8 K
B,
Rinqwood and Major (unpublished)^*^ *
1123K pyrophyllite
Ts 1273 K Sinclair (1982)
1123 K pyrophyllite
calibration curve used in present work based on fayalite-spinel transition at 1273 K for 9 2 3 K pyrophyllite
0
100
2 0 0
3 0 0
4 0 0
LOAD
TONS (metric)
5 0 0
stress. A set of calibration runs using the fayalite-spinel transition was
performed at 1273 K, and the calibration curve for the new pyrophyllite
was drawn through this point parallel to the old pyrophyllite calibration
curve at 1273 K (Fig. 2.2b). Pressures based on the 923 K pyrophyllite
calibration curve are thought to be accurate to within + 0 . 5 GPa.
2.2 Diamond Anvil Cell
Advantages of using the diamond anvil cell include routine access to
relatively high pressures and the ability to perform "in-situ” experiments
(i.e. while the sample is under pressure) such as visual observation,
laser heating and x-ray diffraction. Disadvantages include poorly
constrained P,T conditions and a small sample volume which restricts the
quality of techniques such as x-ray diffraction.
2.2.1 Quench experiments
Phase transformations that could be quenched were studied using an
LD-type diamond anvil cell designed by Bassett and Takahashi (1965) which
is capable of generating up to 30 GPa using 0.125 carat diamonds. The
powdered sample is placed between the faces of two opposed gem-quality diamonds which are mounted on the ends of two pistons driven together by a
lever and spring assembly. The size of the sample is 0.3 mm diameter and the region of highest pressure and minimum pressure gradient is at the
centre and is approximately 0.1 mm in diameter. Once under pressure the
sample is heated using a continuous Nd-doped YAG laser focussed on the
sample. The pressure is then released and the sample is placed on the end
of a 0.1 ram diameter collimator which is mounted in a conventional
Debye-Scherrer camera (57.3 mm diameter) to record the x-ray diffraction
pattern of the sample. Exposure times range from 100-200 hours using a
Phillips x-ray generator operating at 800 W. NaCl is often mixed with the
sample before the run to provide an internal standard with which to
calibrate the x-ray film (assuming that NaCl does not react chemically
with the sample during the run).
The applied pressure is determined on the basis of the length of the
compressed spring, which was standardized using NaCl and the compression
curve for NaCl reported by Weaver et a l .(1971) (Liu, unpublished data).
The estimated uncertainty is + 10% of the measured pressure. The actual
pressure (i.e. the pressure at high temperature) may differ from the
pressure at room temperature, however. The temperature is estimated by eye
Ik
heating. The uncertainty in temperature is generally + 50% of the
estimated temperature. Experimental problems such as variation in the
amount of energy absorbed by the sample, non-uniform heating and variation
in the emissivity of the sample have prevented a substantial improvement
in the accuracy of temperature measurement.
2.2,2 Compression experiments
Room temperature compression curves were measured using a UP-type of
diamond anvil cell designed by Bassett et al.(1967). The UP-type cell is similar to the LD-type cell, except that pressure is applied via a
screw-in piston instead of a lever and spring assembly. Powdered sample is placed between the diamond faces and a small amount of pressure is
applied. An x-ray diffraction pattern is taken of the sample using the
diamond anvil cell as an x-ray camera. A 0.1 mm diameter collimator
mounted on one side of the diamonds directs the x-ray beam onto the sample
and a curved film cassette with a radius of 50 mm mounted on the other side of the diamonds records the diffraction pattern. Filtered Mo KcT
radiation is used exclusively for these experiments due to the large
amount of energy absorbed by the diamonds. Exposure times range from 24-36
hours using a Rigaku rotating anode x-ray generator operating at 11 kW. More pressure is applied to the diamond anvil cell and another x-ray
diffraction pattern recorded. This process is repeated until a complete
curve of unit cell volume versus pressure is obtained. Room temperature
phase transitions can also be studied by this technique.
To calibrate the x-ray film a very thin platelet of NaCl is placed on
the outside face of the diamond facing the film cassette (note that the
NaCl is not under pressure). Measuring the position on the x-ray film of
diffraction lines from the external NaCl standard enables the sample to
film distance to be calculated. The internal pressure is calculated by
measuring the diffraction lines produced by an internal NaCl standard
which has been premixed with the sample in the ratio 1:2. By comparing the
cell volume of the internal NaCl standard with the compression curve
reported by Weaver et a l .(1971) the sample pressure can be determined. The
uncertainty is a function of the relative error in reading lines on the
2.3 Analytical Techniques
2.3.1 X-ray diffraction
Samples (excluding those from diamond anvil experiments) were x-rayed
using a Debye-Scherrer camera (114.6 mm diameter) with a 0.9 mm diameter
fine collimator. The samples were prepared by crushing in an agate mortar,
mixing with clear nail polish and rolling to form a needle of 0.1-0.3 mm
diameter. Fe KcT, Co KcT or Cu KcT radiation was used depending on the composition of the sample. Exposure times varied from 2-24 hours using a
Phillips x-ray generator operating at 800 W. X-ray films were calibrated
using either NaCl(a = 564.01 + 0.01 pm) or Si(a = 543.088 pm) as an
internal standard.
2.3.2 Electron microprobe
Elemental compositions of samples were determined using an electron
microprobe manufactured by Technisch Physische Dienst, Netherlands which
was fitted with a Si(Li) detector (Reed and Ware, 1973; 1975). This system
uses an energy-dispersive technique. Accelerating voltage was 20 kV, beam
current 2.1 nA, beam size 1 ym and the counting interval 100 sec. Data was
reduced by the computer program "METAL", written by N. Ware, RSES. An accuracy of approximately + 2% is expected with the microprobe (Reed and Ware, 1975). Samples were prepared for the electron microprobe by Mr. K.
Massey, RSES.
2.3.3 Mössbauer spectroscopy
Mössbauer spectra were recorded on two spectrometers, one located at
Dept. Solid State Physics, ANU and the other at Dept, of Physics, Monash
University, Victoria. The ANU spectrometer is based on a PDP 11/10
minicomputer which accumulates and stores eight spectra simultaneously (of
256 channels each), displays or outputs the data and generates the
reference signal for the Mössbauer drives (Window et al., 1974). The
reference waveform used by ANU consists of a constant acceleration signal
(linear ramp) during data accumulation followed by a flyback of half the
ramp period. No data is accumulated during the flyback period. Mössbauer
data are punched onto paper tape to be used later for data reduction and 57
analysis using a large computer. A 50-60 mCi Co source diffused in a
rhodium matrix was used, and counting times varied from roughly 12-36 hours, depending on the iron concentration of the sample. Mössbauer
16
Monash University is similar to the one at ANU except that data are
accumulated using a multichannel analyser in place of a minicomputer, and
the reference waveform consists of two linear ramps joined together. This
enables data accumulation during both sweeps of the transducer, producing
a mirror-image spectrum. The final spectrum is obtained by folding the
mirror-image spectrum into itself, removing any nonlinearity associated
with the source-absorber geometry.
Mössbauer samples were prepared by crushing in an agate mortar, mixing
with boron nitride to randomize the crystal grains and mounting in a 13 mm
diameter sample holder. The concentration of iron in the samples was
2
maintained below 5 mg/cm to reduce saturation effects. The Mössbauer data
were analysed by fitting the spectra to pseudo-lorentzian lineshapes
(Price, 1981) using an iterative, nonlinear least squares method (Price,
R.S.Phys.S. Research Report no. 7, ANU). The validity of computer fits was
2
assessed on the basis of x values, consistency of parameters across
samples and convergence of the fitting process. All Mössbauer spectra were
3.1 Introduction
Fe^S and Co^S Form a continuous solid solution at atmospheric pressure
(Pearson, 1967, p. 789). (Fe,Co)xS crystallizes in the hexagonal NiAs (B8)
structure with varying metal/sulphur ratios ranging from x = 1 to
x = 'b 0.87. X-ray data for (Fe,Co)A nAS and (Fe,Co)_ Q_S have been
reported in the literature (Vogel and Hillner, 1953; Perthel, 1960). The
cell parameters of (Fe,Co) S decrease smoothly from Fe S to Co S. The
X X X
crystal lattice of FexS thus contracts with the substitution of Co .
The magnetic properties of the endmembers FexS and CoxS differ
considerably. CoxS is a Pauli paramagnet with an assumed magnetic moment
of 1 iiD per Co atom. The room temperature magnetic susceptibilities of
”
—6
—6
CoA S and Co QS are 4.4x10 emu/g and 4.6x10 emu/g, respectively
(Townsend et al., 1975). The magnetic properties of FexS vary with
stoichiometry. For x 0.92 FexS is antiferromagnetic with a Neel
temperature of approximately 588-593 K, depending on the stoichiometry
(Hirone et a l ., 1954). High-temperature magnetic susceptibility
measurements indicate an effective magnetic moment of 5.24 per Fe atom (Vaughn and Craig, 1978). For x 0.92 FexS is ferrimagnetic with a Curie
temperature which varies discontinuously from 473 K for Fe S to 573 K
U • 7 u
for Fe_ OQS (Schwartz and Vaughn, 1972). U . oo
The magnetic properties of (Fe,Co) 0 S have been studied as a 0. o f
function of composition (Perthel, I960). At room temperature a
ferrimagnetic-paramagnetic transition occurs at approximately
(Fe_ -Co- „)_ 0„S. The Curie temperature extrapolates to zero at the U • 0 U •4 U •oI
approximate composition (FeQ ^ C Oq Q (Fig. 3.1).
The mechanism of the magnetic transition which occurs as a function of
composition in (Fe,Co)S is at present unknown. ((Fe,Co)S will be used
henceforth to represent the general formula (Fe,Co) S.) Previous Mössbauer
57 X
data from an experiment using Co in CoS as the source and K^Fe(CN)g.3H20
R Y
as the absorber show no evidence of magnetic interaction in Fe:CoS down
to 80 K (Seregin et a l ., 1970). This suggests a change in the strength of
the magnetic interaction involving the iron atoms as a function of
composition.
18
Fe2+ ions in (Fe.Co)S, which has also been proposed as being responsible
for the high-pressure phase transition observed by Mössbauer spectroscopy in FeS (Vaughn and Craig, 1978). Fe2+ in FeS is in the high-spin (hs)
state, whereas Co^ in CoS is in the low-spin (Is) state (Townsend et a l .,
1975). The relative ionic radii for F e ^ t l s ) and Co^+ (ls) are 61 pm and
65 pm, respectively, compared with 78 pm for Fe^+ (hs) (Shannon, 1976). It
is therefore possible that the decrease in interatomic distance produced
2^ 21
by the substitution of Co^+ into FeS may cause a spin transition of Fe^+ .
2
Observation of Fe (Is) would provide an ideal opportunity to study the
high-spin low-spin transition in a chemically simple compound
(previously studied compounds include phenanthroline, ferrocynanide and
phthalocyanine complexes, among others), and may be relevant to
transitions in Fe oxides at very high pressure. To investigate the
magnetic transition and the possibility of Fe^+ (ls), the Mössbauer spectra of a suite of samples in the solid solution (Fe,Co)S were run at various
temperatures.
9
-400
Ö 200
mole %
F i g . 3.1 Plot of the Curie temperature versus composition in
(Fe,Co) S, taken from Perthel (I960).
1.700
1.600
1.500
• c / a
O M o l a r V o l u m e
18.00 O O 17.00 16.00
o
o > w_ co o 5CoS 0 2 5 0 5 0
mole fraction
0 .7 5
F ig . 3 .2 P lo t o f th e v a r ia t io n o f m olar volume and c /a r a t i o w ith com position in th e system FeS-CoS.
Table 3.1 Composition and cell parameters for (FexCo^ x ) £
0/Fe:CoS 16 mol % FeS 50 mol % FeS 69 mol % FeS 83 mol % FeS Fe(x)
Co (1-x) (Fe+Co)/S (y)
0.009(1) 0.991(1) 0.871(4) 0.156(3) 0.845(3) 0.919(7) 0.503(3) 0.497(3) 0.936(6) 0.692(4) 0.308(4) 0.958(2) 0.834(1) 0.166(1) 0.950(8) a (pm)
c (pm)
338.8(1) 520.6(2) 339.2(1) 525.0(2) 340.7(1) 542.1(3) 342.2(1) 557.5(12) 343.5(1) 567.2(2) c/a
V (cm^/mole)
20
3.2 Experimental Procedures
Samples of varying composition of (Fe,Co)S were prepared in the
following manner. Mixtures of the elements were finely ground, pelletized
and sealed inside silica glass tubes evacuated to less than 10 mPa. The
glass tubes were heated inside a temperature-controlled furnace at 823 K
to allow the sulphur to react with the metal. After 2-3 hours the
temperature was increased to 1273 K and the mixtures were sintered for
14-16 hours. The samples were quenched in water, reground, sealed inside
new silica glass tubes and resintered at 1273 K. This process was repeated
until x-ray diffraction patterns taken of the samples after each
regrinding indicated no change in the composition of the mixture.
The x-ray diffraction patterns of all samples could be indexed
according to the B8 structure; no evidence for the presence of a
superstructure was observed. Small amounts (< 5%) of Fe^O^ were detected
in 3ome samples. The cell parameters of the samples are given in Table
3.1. There is a smooth increase in both molar volume and c/a ratio towards the FeS endmember (Fig. 3*2).
Compositions were determined using an electron microprobe and are listed in Table 3.1. The metal/sulphur ratio varies slightly from sample to sample, reflecting small variations in sample preparation. Excess
57
sulphur was added to the starting mix of Fe:CoS to prevent the formation
of CogSg which was present in earlier runs with higher metal/sulphur
ratios.
The Mössbauer spectra were recorded on a constant acceleration
Mössbauer spectrometer located at Dept. Solid State Physics, R.S.Phys.S.,
ANU. Details of the apparatus and run procedure are given in Chapter 2.
3.3 Results
The Mössbauer spectra of the (Fe,Co)S samples are illustrated in
Fig. 3.3* The nonmagnetically-split Mössbauer spectra were fitted to two
quadrupole doublets with the half widths and line intensities of the
components constrained to be equal. The Mössbauer parameters are listed in
Table 3.2. A statistical F test was applied to determine if the reduction
2
in x of a two doublet fit over a one doublet fit was statistically
significant (Bevington, 1969). Although the results do not support the two
doublet fit in all cases (see Table 3*2), the relatively large line widths
T = 2 9 8 K T = 4.2 K
8 3 % Fe
0.2%
6 9 % Fe
0
.
2%
50%Fe
0
.
2%
!6%Fe
1.
0%
M i l
I
I
I
1
I
I
I
1
I
I
1
I
Fe'CoS
1
.
0%
J 0.5%-3 -2
Velocity
mm/sec
Fig.
3.3
Mössbauer spectra of (FetCo)S as a function of temperature and composition. The velocity scales are relative to Fe. The nonmagnetic22
Table 3.2 Mössbauer parameters for the non-magnetic spectra of (Fe.Co)S
50 mol % FeS T=298 K
16 mol % FeS T=298 K
5 7
Fe:CoS T=298 K
16 mol % FeS T = 4 .2 K
5 7
'Fe:CoS T = 4 .2 K
6a mm/sec 0.669(3) 0.594(3) 0.570(1) 0.740(4) 0.719(2)
e mm/sec 0.330(4) 0.316(4) 0.326(2) 0.394(2) 0.338(4)
T mm/sec 0.314(7) 0.236(7) 0.228(3) 0.473(11) 0.303(6)
% Area 21 26 31 45 49
6a mm/sec 0.683(1) 0.590(2) 0.573(1) 0.727(3) 0.730(3)
e mm/sec 0.111(3) 0.175(2) 0.180(1) 0.143(5) 0.188(3)
T mm/sec 0.460(5) 0.348(6) 0.331(3) 0.471(16) 0.328(9)
% Area 79 74 69 55 51
2
X 0.98 1.16 0.99 1.18 0. 77
F b
X 4.36 1.00 7.67 0.97 2.18
arelative to Fe imetal
bTo accept a two doublet fit over a one doublet fit at the 95% confidence level, the value of F
X
should be greater than or equal to 2.37.
Table 3.3 Mössbauer parameters for the magnetic spectra of (Fe,Co)S
83 mol % FeS T=298 K
69 mol % FeSb T=298 K
69 mol % FeS 50 mol % FeS
T=4.2 K T=4.2 K
6a mm/sec 0.721(13) 0.759(11) 0.884(6) 0.860(10)
ec mm/sec 0.03(1) -0.15(1) -0.09(1) -0.03(1)
H kOe 293.0(12) 297.0(7) 338.4(5) 253.3(11)
% Area 31 40 45 32
6a mm/sec 0.740(10) 0.726(14) 0.899(8) 0.849(10)
ec mm/sec 0.06(1) -0.12(1) -0.08(1) 0.00(1)
H kOe 267.8(8) 269.1(13) 321.4(6) 218.8(8)
% Area 69 44 55 68
x2 0.87 1.46 2.00 1.50
arelative to Fe metal
^This spectrum also contained a quadrupole doublet with 6 =
e = 0.228(22) mm/sec, T = 0.717(49) mm/sec and occupied 16%i of the total area0.709(22) mm/sec,
Ce = i ( V6 + ~ ^2
line width of 0.25 mm/sec using the same Mössbauer source). The multiple
doublets could originate from small crystallographic distortions due to
metal defects or from distributional variations of cation nearest
neighbours of the Fe2* sites. In the latter case a set of broadened
doublets corresponding to the predominant arrangements would be expected.
The magnetic Mössbauer spectra were fitted to two six-line hyperfine spectra and the data are listed in Table
3
.3
. The half widths and lineintensities of corresponding peaks (i.e. peaks 1 and 6, peaks 2 and 5, 57 2+
etc.) were constrained to be equal. The multiple Fe environments seen
in the magnetic Mössbauer spectra may correspond to those seen in the nonraagnetically-split spectra.
The onset of hyperfine splitting at 298 K occurs within the
compositional range 50 mol
%
FeS to 83 mol%
FeS. Although the69 mol
%
FeS spectrum could be fitted to a combination of magnetically-split and nonmagnetically-split spectra, it is impossible to determine
from the data if the spectrum represents two phases, one with zero
hyperfine field, or one phase where some Fe2* ions experience a very small
exchange field not strong enough to cause hyperfine splitting. The
69 mol
%
FeS spectrum was therefore fitted on the basis of one phase being present since the uncertainties in the fitted parameters are large enoughto encompass those which each component of a two-phase system would have.
Fig. 3.4a illustrates the variation of centre shift at 298 K as a
function of composition. Only a small decrease in centre shift from the
magnetic spectra to the nonmagnetic spectra is observed and the centre
shift decreases as a function of decreasing Fe2+ concentration. It is
difficult to ascertain if the centre shift varies continuously through the
magnetic transition but it is clear that no large 0.03 mm/sec)
discontinuity is involved.
57
The hyperfine magnetic field at the Fe nucleus varies as a function
of composition and the experimental values are illustrated in Fig. 3.4b.
The field strength at 298 K of the 83 mol
%
FeS and 69 mol%
FeS samplesare identical within experimental error. The hyperfine field at 4.2 K of
the 50 mol
%
FeS sample is substantially reduced, however. This sample wasrun at 100 K to determine if the hyperfine field at 4.2 K was saturated,
or if the low value was merely due to the proximity of the ordering
2h
T=298 K
CoS
25
50
75
FeS
mole %
CoS
25
50
75
FeS
mole %
Fig. 3.4 Plot showing the variation with composition of (a) the room temperature centre shift and (b) the hyperfine field parameter. The values of 5 and H were computed as a weighted average of the component spectra. The values for FeS were taken from Hafner and Kalvius (1966). The
with a hyperfine field smaller than the value at 4.2 K, indicating that
the hyperfine field at 4.2 K is saturated; a nonsaturated field at 4.2 K
would preclude the possibility of observing a magnetically-split spectrum
at 100 K. The magnitude of the hyperfine field, then, decreases with
decreasing Fe2+ concentration.
If only dilution effects were controlling the magnetic properties of
the Mössbauer spectra the net result would be a steady decrease of the
ordering temperature with the hyperfine field strength remaining constant.
The decreasing magnitude of the field strength thus indicates a
significant alteration to the factors which give rise to the hyperfine
magnetic field. To study the problem further, the Mössbauer spectrum of 57
Fe:CoS was recorded in an external magnetic field of 25 kOe with the
field axis parallel to the direction of y-ray propagation (Fig. 3.5). The spectrum was recorded by Dr. P. Clark at Monash University, Victoria. The
line width of the spectrum is broadened by approximately 0.6 mm/sec from
the zero-field spectrum, and the splitting is nearly identical with the observed value for FeS^ at 4.2 K in an external magnetic field of similar
intensity (Montano and Seehra, 1976), indicating a zero contribution of the internal hyperfine field to the observed splitting.
3.4 Magnetic Transition in (Fe,Co)S
The room temperature centre shifts decrease almost continuously 57
(Fig. 3.4a) from 0.76 mm/sec at FeS to 0.57 mm/sec at Fe:CoS, although
there may be a small discontinuity (^ 0.03 mm/sec) near 69 mol % FeS. At 57
4.2 K the hyperfine magnetic field at the Fe nucleus decreases with
decreasing Fe2+ concentration from 328 kOe at FeS to 230 kOe at
50 mol % FeS. The internal field contribution to the magnetic splitting of 57
Fe:CoS in an external magnetic field at 4.2 K is close to zero.
One possible mechanism for the observed decrease in the hyperfine magnetic field is a high-spin -► low-spin transition of the Fe2+ ions,
since Fe^+ (ls) has no unpaired electrons and cannot contribute
significantly to the hyperfine magnetic field. Co2+ is probably in the
low-spin state throughout the solid solution inferred on the basis of data
presented in Fig. 3.1. Co2 + (hs) is most likely to occur near the FeS
endmember, but the smooth decrease in ordering temperature with increasing
Co2+ concentration is not consistent with a high-spin -* low-spin
2+
26
T = 4.2 K
H =25 kOe
I
I
I
I
-5
0
5
Velocity
mm/sec
57