ON
SERUM URIC ACID LEVEL IN TYPE 2
DIABETES MELLITUS
Submitted to
THE TAMILNADU DR. M. G. R. MEDICAL UNIVERSITY CHENNAI
in fulfilment of the regulations
for the award of
M.D DEGREE IN GENERAL MEDICINE
BRANCH I
GOVERNMENT MOHAN KUMARAMANGALAM
MEDICAL COLLEGE, SALEM.
This is to certify that the dissertation entitled “A Study on Serum
Uric Acid Level in Type 2 Diabetes Mellitus” is a bonafide work done
by Dr. P.SENTHILNATHAN in M.D BRANCH I GENERAL
MEDICINE at Government Mohan Kumaramangalam Medical College,
Salem-636030, to be submitted to The Tamil Nadu Dr.M.G.R Medical
University, in fulfilment of the University Rules and Regulation for the
award of M.D. Degree Branch I General Medicine, under my supervision
and guidance, during the academic period from March 2009 to October
2009.
Prof. Dr. R.ANBALAGAN, M.D., HOD of Medicine,
General Medicine,
Govt. Mohan Kumaramangalam Medical College, Salem
DEAN
I solemnly declare that this dissertation “A Study on Serum
Uric Acid Level in Type 2 Diabetes Mellitus” was prepared by me at
Government Mohan Kumaramangalam Medical College and
Hospital, Salem-636030 under the guidance and supervision of
Prof.Dr.T.SUNDARARAJAN, M.D., Professor of General Medicine,
Govt. Mohan Kumaramangalam Medical College and Hospital Salem.
This dissertation is submitted to The Tamil Nadu Dr. M.G.R.
Medical University, Chennai in fulfillment of the University
regulations for the award of the degree of M.D. Branch I General
Medicine.
Place : Salem
Date :
(Dr. P.SENTHILNATHAN)
Former Dean, Govt.Mohan Kumaramangalam Medical College and
Hospital, for permitting me to undertake this study.
I am also thankful to Dr. K.V.KANAGASABAI, M.D., Dean,
Govt.Mohan Kumaramangalam Medical College and Hospital, for his
whole hearted co-operation and support for the completion of this
dissertation.
I would like to express my sincere gratitude to
Prof.Dr.R.ANBALAGAN, M.D., Head of the Department of
Medicine, Govt.Mohan Kumaramangalam Medical College and
Hospital, Salem for his excellent guidance and encouragement during
this study.
I am extremely thankful to my unit chief and Professor of
Medicine Dr.T.SUNDARARAJAN, M.D., for his guidance,
invaluable help, encouragement and support throughout the study.
I am grateful and thankful to Dr.V.DHANDAPANI, M.D.,
Professor of Medicine for his unstinting help for completion of this
dissertation in time.
I am thankful to Dr.A.THANGARAJU, M.D., Professor of
medicine and Dr.S.R.SUBRAMANIAM, M.D., Registrar in
department during this study.
I gratefully thank to Dr.G.PRAKASH, M.D., Dip.
Dibaetology, Asst. Professor, Department of Medicine, for showing
special interest in my work and for his valuable advice.
I am thankful to Dr.T.MUNUSAMY, M.D., D.M., and
Dr.P.KANNAN, M.D., D.M., Asst. Professor of Cardiology for their
valuable suggestions and support.
I am thankful to all my Assistant Professors
Dr.V.SUNDARAVEL, M.D., Dr.D.VIAYARAJU, M.D.,
Dr.A.RAVI, M.D., Dr.V.RAJKUMAR, M.D.,
Dr.J.VASANTHAKUMAR, M.D., who had offered constructive
criticism and valuable suggestion during the preparation and
presentation of the work.
I express my sincere thanks to my fellow post graduates and
CRRI for their help and co-operation throughout the work.
A special thanks to M/s.VIVA COMPUTERSS, Salem for the
neat execution of this dissertation.
Last but not the least, I am grateful to all my patients for their
S. No. Particulars Page No.
1. Introduction 1
2. Aims and Objectives 4
3. Review of Literature 5
4. Materials and Methods 36
5. Results 41
6. Discussion 62
7. Conclusion 68
8. Summary 69
Bibliography
Proforma
IDDM - Insulin Dependent Diabetes Mellitus
NIDDM - Non Insulin Dependent Diabetes Mellitus
CAD - Coronary Artery Disease
JNC - Joint National Committee
IHD - Ischaemic Heart Disease
GDM - Gestational Diabetes Mellitus
SUA - Serum Uric Acid
HT - Hypertension
BMI - Body Mass Index
WHR - Waist Hip Ratio
DOD - Duration of Diabetes
BS - Blood Sugar
PG - Plasma Glucose
MI - Myocardial Infarction
I - Ischaemia
SD - Standard Deviation
IFG - Impaired Fasting Glucose
IGT - Impaired Glucose Tolerance
CVD - Cardiovascular Disease
Cardiovascular disease has emerged as a major health burden
worldwide.1 Type 2 diabetes mellitus is an epidemic in India for the
past few decades. Diabetes mellitus is the most important risk factor
associated with two to four fold increased incidence of coronary artery
disease.2
Nearly 120 years have elapsed since serum uric acid was first
described as risk factor for cardiovascular disease.3 Serum uric acid as
a potential cardiovascular disease risk factor has ballooned in the last
several years with numerous abstracts & research papers, multiple
editorials & review articles.
The four major risk factors for CAD viz, hypercholesterolemia,
hypertension, diabetes mellitus, and cigarette smoking which were
present in Framingham’s cohort are difficult to explain among Indians
with CAD. CAD in Indians is present even with low cholesterol level.4
Obesity, systemic hypertension, hypercholesterolemia is associated
Much but not all epidemiological research identifies
hyperuricemia as a independent risk factor for the development of
cardiovascular disease, renal disease & stroke, particularly in patients
with hypertension or congestive heart failure and in women.6
Hyperuricemia has been found to be associated with obesity
and insulin resistance, and consequently with type 2 diabetes.7 Further
potentially important biological effects of uric acid relate to
endothelial dysfunction by inducing antiproliferative effects on
endothelium and impairing nitric oxide production and
inflammation.8,9 Uric acid may play a role in immune activation with
subsequent increased chemokine and cytokine expression.10,11
Puig et al has found that in patients with metabolic syndrome
serum uric acid level was higher when compared with controls and
that serum urate increases with the number of components of
metabolic syndrome.12 In addition a recent study in rats showed that
fructose – induced hyperuricemia plays a pathogenic role in the
Some have found a significant & specific independent
association between uric acid level and cardiovascular mortality and
morbidity, while others have come to an opposite conclusion.14 Thus
despite abundant epidemiological evidence, the role of increased
serum uric acid and cardiovascular risk is controversial.
Here an attempt has been made to study the level of serum uric
acid level in Type 2 diabetes mellitus & the correlation between
elevated serum uric acid level and the component of metabolic
AIMS AND OBJECTIVES
1) To identify the level of uric acid in patients with type 2
Diabetes mellitus.
2) To identify whether any association exist between age, sex,
anthropometric measurements (BM1, WHR), hypertension,
REVIEW OF LITERATURE
DIABETES MELLITUS
Diabetic Mellitus is a group of metabolic diseases characterized
by hyperglycemia resulting from defects in Insulin secretion, insulin
action or both.15 The chronic hyperglycemia of diabetes is associated
with long term damage, dysfunction and failure of various organs,
especially the eyes, kidneys, nerves, heart and blood vessels.16
CLASSIFICATIONS:
In 1997, ADA issued new diagnostic and classification criteria;
In 2003, modifications were made regarding the diagnosis of impaired
fasting glucose.17 The classification of diabetes includes four clinical
classes,
( Type 1 Diabetes: Results from β-cell destruction, usually
leading to absolute insulin deficiency.
( Type 2 Diabetes: Results from a progressive insulin secretory
defect on the background of insulin resistance.
( Other specific types of diabetes due to other causes, eg.(i)
pancreas, (such as cystic fibrosis), (iii) Drug or chemical
induced (such as in treatment of AIDS or after organ
transplantation)
( Gestational Diabetes Mellitus (GDM): Diabetes diagnosed
during pregnancy.
DIAGNOSIS OF DIABETES:
RECOMMENDATIONS:
1. The Fasting Plasma Glucose (FPG) test is the preferred test
to diagnose diabetes in children and non pregnant adults.
2. Use of the A1C for the diagnosis of diabetes is not
recommended at this time.18
Three ways to diagnose diabetes are available and each must be
confirmed on a subsequent day unless equivocal symptoms of
hyperglycemia are present. Although the 75 g. oral glucose tolerance
test (OGTT) is more sensitive and modestly more specific than the
FPG to diagnose diabetes, it is poorly reproducible and difficult to
perform in practice. Because of ease of use, acceptability to patients,
CRITERIA FOR THE DIAGNOSIS OF DIABETES
1. FPG ≥126 mg/dl (7.0 mmol/l). Fasting is defined as no
caloric intake for atleast 8 hours. (or)
2. Symptoms of Hyperglycemia and a casual plasma glucose ≥
200 mg/dl (11.1 mmol/l). Casual is defined as any time of
day without regard to time since last meal. The classic
symptoms of Hyperglycemia include polyuria, polydipsia
and unexplained weight loss. (or)
3. 2 hours plasma glucose ≥ 200 mg/dl (11.1 mmol/l) during an
OGTT. The test should be performed as described by the
World Health Organization, using a glucose load containing
the equivalent of 75 g anhydrous glucose load containing the
equivalent of 75g. anhydrous glucose dissolved in water.17
DIAGNOSIS OF PRE-DIABETES
Hyperglycemia not sufficient to meet the diagnostic criteria for
diabetes is categorized as either Impaired Fasting Glucose or Impaired
Glucose tolerance, depending on whether it is identified through the
IFG = FPG 100 mg/dl – 125 mg/dl
IGT = 2 hr. plasma glucose 140 mg/dl – 199 mg/dl.
IFG and IGT has been officially termed “Pre-diabetes”. Both
IGT and IFG are similarly associated with endovascular disease
outcomes. Risks are higher when IGF and IFG coexist. Lifestyle
interventions are highly effective in delaying or preventing the onset
of diabetes in people with IGT and may reduce LVD and total
mortality.20
EPIDEMIOLOGY
The prevalence of diabetes is rapidly rising all over the globe at
an alarming rate.21 Although there is an increase in the prevalence of
type 1 diabetes also, the major driver of the epidemic is the type 2
DM, which accounts for more than 90%.
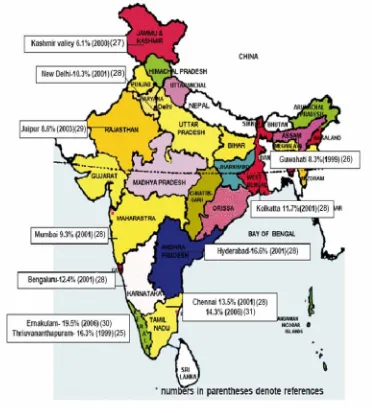
India leads the world with largest number of diabetic subjects
earning the dubious distinction of being termed the “diabetes capital
the IDF, the number of people with diabetes in India currently around
Fig.2 is a map of India showing the prevalence of type 2 DM
[image:17.612.129.501.185.598.2]reported in different regions of India.
A study conducted by WHO & ICMR in 5 states of India,
representing each zone has shown that the highest prevalence of DM
was in urban areas followed by peri-urban and rural areas.32
The increase in the prevalence of type 2 DM among Indians is
attributed to both genetic and environmental factors. The so called
“Asian Indian Phenotype” refers to certain unique clinical and
biochemical abnormalities in Indians which include increased insulin
resistance, greater abdominal obesity, lower adiponectin and higher
high sensitive C-reactive protein levels.33,34,35 This phenotype makes
Asian Indians more prone to diabetes and premature coronary artery
disease.
However, the primary driver of the epidemic of diabetes is the
rapid epidemiological transition associated with changes in dietary
patterns (Fast food culture)36 and decreased physical activity
(Sedentarinism),37 as evident from the higher prevalence of diabetes in
the urban population.38
Even though the prevalence of microvascular complication of
Indians, the prevalence of premature coronary artery disease is much
higher in Indians compared to other ethnic groups.38
The most disturbing trend is the shift in age of onset of diabetes
to a younger age in recent years. Mohan et al has recently developed
the Indian Diabetes Risk Score (IDRS) using four simple variables
namely, age, family history, regular exercise and waist circumference
(Table).39
Table. Indian Diabetes Risk Score (IDRS)
Particulars Score
Age (yr):
< 35 (reference) 0
35-49 20
>50 30
Abdominal obesity:
Waist <80 cm (female), <90 (male) (reference) 0
Waist > 80-89 cm (female), >90-99 cm (male) 10
Physical activity:
Vigorous exercise or strenuous (manual) labour at
home/work
0
Mild to moderate exercise or mild to moderate physical activity at home/work
20
No exercise and sedentary activities at home/work 30
Family history:
No family history (reference) 0
Either parent 10
Both parents 20
Minimum score 0
Maximum score 100
Interpretation:
Score < 30 low risk, score 30-50 medium risk and score > 60
high risk for type 2 diabetes and cardiovascular diseases.
PATHOGENESIS:
Insulin resistance and abnormal insulin secretion are central to
the development of type 2 DM. Although the primary defect is
precedes an insulin secretory defect but that diabetes develops only
when insulin secretion becomes inadequate.40
Type 2 DM has a strong genetic component. The concordance
of Type 2 DM in identical twins is between 70 and 90%. Individuals
with a parent with type 2 DM have an increased risk of diabetes; if
both parents have type 2 DM, the risk approaches 40%. A recent study
has found a strong association of type 2 diabetes mellitus with a
variant of the transcription factor 7- like 2 gene in several
populations.40
The disease is polygenic and multifactorial since in addition to
genetic susceptibility, environmental factors (such as obesity, nutrition
and physical activity) modulate the phenotype.
In the early stages of the disorder, glucose tolerance remains
near normal, despite insulin resistance, because the pancreatic beta
cells compensate by increasing insulin output. As the disorder
progresses, the beta cells are unable to sustain the hyperinsulinemic
state. IGT, characterized by elevations in postprandial glucose, then
develops. A further decline in insulin secretion and an increase in
hepatic glucose production lead to overt diabetes with fasting
COMPLICATIONS OF DIABETES MELLITUS40
Acute Complications Chronic Complications
1. Diabetic Ketoacidosis Microvascular Macrovascular
2. Non-Ketotic hyperosmolar 1) Retinopathy 1) Coronary artery coma 2) Neuropathy disease 3. Hypoglycemia 3) Nephropathy 2) Peripheral
vascular disease 3) Cerebrovascular disease
Others
1. Gastrointestinal – Gastroparesis, diarrhea.
2. Genitourinary – Uropathy / Sexual dysfunction
3. Dermatological – Acanthosis nigricans.
4. Infections – Emphysematous pyelonephritis, Mucormycosis,
METABOLIC SYNDROME
Metabolic syndrome is a combination of medical disorders that
increase the risk of developing cardiovascular disease and diabetes.
Metabolic syndrome is also known as syndrome X, insulin
resistance syndrome, Reaven’s syndrome, and CHAOS (Australia).41
HISTORY
The term "metabolic syndrome" dates back to at least the late
1950s,
The Marseilles physician Dr. Jean Vague, in 1947, observed
that upper body obesity appeared to predispose to diabetes,
atherosclerosis, gout and calculi.42
In 1977, Haller used the term "metabolic syndrome" for
associations of obesity, diabetes mellitus, hyperlipoproteinemia,
hyperuricemia, and Hepatic steatosis when describing the additive
effects of risk factors on atherosclerosis.43
The same year, Singer used the term for associations of obesity,
In 1988, in his Banting lecture, Gerald M. Reaven proposed
insulin resistance as the underlying factor and named the constellation
of abnormalities Syndrome X. Reaven did not include abdominal
obesity, which has also been hypothesized as the underlying factor, as
part of the condition.45
RISK FACTORS 40
¾ Overweight / Obesity
¾ Sedentary Lifestyle
¾ Stress
¾ Aging
¾ Diabetes Mellitus
¾ Coronary Heart Disease
¾ Lipodystrophy
ETIOLOGY
INSULIN RESISTANCE
The most accepted and unifying hypothesis to describe the
pathophysiology of the metabolic syndrome is insulin resistance,
caused by an incompletely understood defect in insulin action. The
hyperinsulinemia, followed by fasting hyperinsulinemia and,
ultimately, hyperglycemia.
An early major contributor to the development of insulin
resistance is an overabundance of circulating fatty acids. The
inhibition of lipolysis in adipose tissue is the most sensitive pathway
of insulin action. Thus, when insulin resistance develops, increased
lipolysis produces more fatty acids, which further decrease the
antilipolytic effect of insulin. Excessive fatty acids enhance substrate
availability and create insulin resistance by modifying downstream
signaling. Fatty acids impair insulin-mediated glucose uptake and
accumulate as triglycerides in both skeletal and cardiac muscle,
whereas increased glucose production and triglyceride accumulation
are seen in liver.40
Increased Waist Circumference
Relative increases in visceral versus subcutaneous adipose
tissue with increasing waist circumference in Asian Indians explains
the greater prevalence of the syndrome in these populations. It is also
possible that visceral fat is a marker for, but not the source of, excess
Dyslipidemia
The major lipoprotein disturbances are hypertriglyceridemia &
decrease in HDL.
Hypertriglyceridemia is an excellent marker of the
insulin-resistant condition.
With fasting serum triglycerides >2.0 mM (~180 mg/dL), there
is almost always a predominance of small dense LDLs. Small dense
LDLs are thought to be more atherogenic.40
Glucose Intolerance
The defects in insulin action lead to impaired suppression of
glucose production by the liver and kidney and reduced glucose
uptake and metabolism in insulin-sensitive tissues, i.e., muscle and
adipose tissue.40
Hypertension
In the setting of insulin resistance, the vasodilatory effect of
insulin is lost, but the renal effect on sodium reabsorption and increase
in the activity of the sympathetic nervous system is preserved, which
Proinflammatory Cytokines
The increases in proinflammatory cytokines, including
interleukin (IL) 1, IL-6, IL-18, resistin, tumor necrosis factor (TNF) ,
and C-reactive protein (CRP), reflect overproduction by the expanded
adipose tissue mass. Adipose tissue-derived macrophages may be the
primary source of pro-inflammatory cytokines locally and in the
systemic circulation.40
Adiponectin
Adiponectin is an anti-inflammatory cytokine produced
exclusively by adipocytes. Adiponectin enhances insulin sensitivity
and inhibits many steps in the inflammatory process. In the liver,
adiponectin inhibits the expression of gluconeogenic enzymes and the
rate of glucose production. In muscle, adiponectin increases glucose
transport and enhances fatty acid oxidation, partially due to activation
of AMP kinase. Adiponectin is reduced in the metabolic
In addition to the features specifically associated with metabolic
syndrome, insulin resistance is accompanied by other metabolic
alterations. These include increases in,
( Uric acid48
( apoB and C III,
( prothrombotic factors (fibrinogen, plasminogen activator
inhibitor 1),
( serum viscosity,
( asymmetric dimethylarginine,
( homocysteine,
( white blood cell count,
( CRP,
( microalbuminuria,
( nonalcoholic fatty liver disease (NAFLD) and/or nonalcoholic
steatohepatitis (NASH)
( polycystic ovarian disease (PCOS), and
( obstructive sleep apnea (OSA).40
Diagnosis
There are currently two major definitions for metabolic
syndrome provided by the International Diabetes Federation and the
IDF
The IDF consensus worldwide definition of the metabolic
syndrome.49
Central obesity (defined as waist circumference with ethnicity
specific values), ≥ 90 cm in men and ≥ 80 cm in women for South
Asian and Chinese people.
AND any two of the following:
Raised triglycerides : > 150 mg/dL (1.7 mmol/L), or specific treatment
for this lipid abnormality.
Reduced HDL cholesterol: < 40 mg/dL (1.03 mmol/L) in males, < 50
mg/dL (1.29 mmol/L) in females, or specific treatment for this lipid
abnormality.
Raised blood pressure : systolic BP > 130 or diastolic BP >85 mm Hg,
or treatment of previously diagnosed hypertension.
Raised fasting plasma glucose :(FPG)>100 mg/dL (5.6 mmol/L), or
previously diagnosed type 2 diabetes.
# If BMI is >30 kg/m², central obesity can be assumed and waist
NCEP
The US National Cholesterol Education Program Adult
Treatment Panel III50 requires at least three of the following:
Central obesity: waist circumference ≥ 102 cm or 40 inches (male),
≥ 88 cm or 36 inches(female)
Dyslipidaemia: TG ≥ 1.695 mmol/L (150 mg/dl)
Dyslipidaemia: HDL-C < 40 mg/dL (male), < 50 mg/dL (female)
blood pressure ≥ 130/85 mmHg
Fasting plasma glucose ≥ 6.1 mmol/L (110 mg/dl).
The two differences are that IDF state if BMI>30 kg/m2 central
obesity can be assumed and waist circumference does not need to be
measured. However, this potentially excludes any subject without
increased waist circumference if BMI<30, whereas, in the NCEP
definition, metabolic syndrome can be diagnosed based on other
criteria and the IDF uses geography-specific cut points for waist
circumference, while NCEP uses only one set of cut points for waist
circumference regardless of geography. These two definitions are
much closer to each other than the original NCEP and WHO
CAUSES OF HYPERURICEMIA IN TYPE 2
DIABETES MELLITUS PATIENTS
1. DIETARY HABITS
An increase in Serum urate level may occur in type 2 DM in
various situations like Purine rich diet such as liver, anchovies,
kidney, sardines, sweet breads, peas, cauliflower, brinjal and yeasts.40
2. ALCOHOL
Alcohol increases serum urate level by accumulation of organic
acids (betahydroxybutyrate, acetoacetate, lactate) that compete with
urate for tubular secretion and accelerated breakdown of ATP by liver
is increased (Beer contains high uric acid).40
3. OBESITY
Various mechanisms play role in increase in serum urate by
obesity, like anabolic effects of tissues because of Insulin resistance,
increase in denovo biosynthesis of Purines, decreased excretion and
4. DEHYDRATION
Dehydration can impair uric acid excretion by decreased
filtration and secretion and sometimes with acidosis by competition of
H+ ion for excretion. Starvation again causes accumulation of organic
acids that compete for the excretion of urate for tubular secretion.40
5. SYSTEMIC HYPERTENSION
There are various studies regarding association of systemic
hypertension with the elevated uric acid level. Probable mechanism
suggested is impaired excretion of urate because of intrinsic renal
defect in hypertension.40
6. LACTIC ACIDOSIS AND DIABETIC KETOACIDOSIS
Dehydration and Pre renal azotemia both can impair filtration
and secretion of urate leading to retention and also these may cause
diminished reabsorption of uric acid. Again in the setting of acidosis
H+ ion compete with uric acid leading to enhanced reabsorption and
7. HYPERGLYCEMIA
Both uric acid and glucose levels are positively related to body
mass index. The association of uric acid in relation to glucose reflects
the biochemical interaction between serum glucose metabolism and
purine metabolism.40
8. RENAL INSUFFICIENCY
Decreased urate filtration contributes to the hyperuricemia of
renal insufficiency. But the correlation between BUN, Serum
creatinine and serum uric acid concentration per unit of GFR increases
progressively with renal insufficiency. The tubular secretory capacity
tends to be preserved, the tubular reabsorbtive capacity is decreased
and extra renal clearance of uric acid increases as the renal damage
becomes more severe.40
9. DRUGS
They mainly act by competitive inhibition of uric acid
excretion. Salicylates and nicotinic acid directly compete with the
urate for tubular secretion. Diuretics, L-dopa, Pyrazinamide,
Ethambutol, cyclosporine decreases the secretion of urate in the
URIC ACID AND INSULIN RESISTANCE
Nearly 120 years have elapsed since uric acid was first
described as a potential factor in the development of cardiovascular
disease.3 The actual mechanism of hyperuricemia found in many
diabetic patients is not known, but different theories have been
presented.
Quinones et al observed that hyperuricemia is a frequent finding
in Insulin resistant states. He found that insulin induces changes in
fractional uric acid and sodium excretion co-related with one another
and physiological hyperinsulinemia acutely reduces urinary uric acid
and sodium excretion in coupled patients. They also observed that in
Insulin resistant individuals compensatory hyperinsulinemia imposes a
chronic antinatriuretic and anti uricosuric pressure on the kidney.51
Moriwaki et al studied the effects of glucose infusion on the
renal clearance of uric acid, xanthine and oxypurinol and found that
the effect was not related to osmotic diuresis, but induced by
Muscilli et al observed that effect of insulin or urinary excretion
in normal subjects and found that hyperinsulinemia caused a
significant decrease in the urinary excretion of uric acid.53
Tkac et al found that higher mean serum uric acid level in
myocardial infarction group was associated with increasing age and
serum creatinine levels. It was associated with elevated TGL, BMI and
hypertension.54
Woo et al study results found positive association between
serum uric acid concentration and BMI, with systolic and diastolic BP,
urea, creatinine, fasting glucose 2 hour insulin, TGL, apolipoprotein B
in men. Similar but fewer associations were seen in women with
additional positive associations with age. The study suggests that
serum uric acid may be a Marker for the presence of an adverse
cardiovascular risk profile.55
Wannamethee et al conducted in their study that serum uric acid
is not a truly independent risk factor for coronary acting disease.
Increased serum uric acid appears to be an integral part of the cluster
include central obesity, increased TG level and serum cholesterol
level.56
Pearl et al study concluded high molar equivalent serum anti
oxidant capacity (MESA) between diabetics and non-diabetics showed
uric acid as a free radical scavenger is NIDDM.57
There are certain clinical clustering groups with increased
cardiovascular risk, which have associated hyperuricemia.58 They are,
1. African American patient group.
2. Patients group with excessive alcohol consumption.
3. Hypertensive patient groups
4. Non diabetic patient groups with acclerated atherosclerosis.
5. Congestive heart failure patients group with ischemic
cardiomyopathy.
6. Metabolic syndrome patients group
7. Renal disease patients group and
8. Patients group taking diuretics.
Each of the clustering group has metabolic mechanism that may
MECHANISM:
Type 2 Diabetics mellitus is strongly associated with
hyperuricemia.59
Potential mechanism involved in the association of
hyperuricemia and type 2 Diabetes mellitus include the following:
1. Altered renal sodium handling causes decreases renal blood
flow and diminishes uric acid excretion.60
2. Decreased GFR stimulating urate absorption.61
3. Microvascular disease resulting in local tissue ischemia.
4. Ischemia associated with increased lactate production.
5. Ischemia induces increased xanthine oxidase production.61
Other factors which may contribute are alcohol abuse, lead
Mechanism of Hyperuricemia in Hyperinsulinemia61
Hyperinsulinemia
↓
Altered renal sodium handling
↓
↑Arterial pressure
↓Renal blood flow
↓Uric acid excretion
↓
Hyperuricemia
Increased serum uric acid has been found to predict the
development of renal insufficiency in individuals with normal
function.
In type 2 Diabetes mellitus hyperuricemia seems to be
associated with metabolic syndrome and with early onset or increased
From the review the following conclusion was arrived:
Determining the truth in medical science is a difficult business.
Serum uric acid may or may not be an independent risk factor because
its linkage to other risk factors is so strong. However there is not much
correlation regarding its role as a marker or risk factor that is clinically
significant and relevant.
Hyperuricemia should alert the clinician to an overall increased
risk of Cardiovascular disease. Elevation of uric acid > 4 mg/dl should
be considered a “Red Flag” in those patients at risk for cardiovascular
diseases and should alert the clinician to strive and utilize a global risk
reduction programme to reduce the complications of atherogenic
process.58
Hayden and Tyagi et al have suggested the RAAS protocol for
these patients to reduce the atherogenic process58
R – Reductase inhibitors ( HMG Co-A )
A – ACE inhibitors, ARB
Aspirin
Adrenergic blockade
A - Aggressive control of diabetes
Aggressive control of B.P (losartan)3
Aggressive control of uric acid (allopurinol)
S – Life Style
Stop Smoking
DEFINITIONS USED IN PRESENT STUDY
1. DIABETES MELLITUS:
Criteria for the diagnosis of diabetes mellitus (modified form of
American Diabetes Association, 2003)
1. Symptoms of diabetes + (R) blood glucose ≥ 200 mg/dl.
2. Fasting plasma glucose ≥ 126 mg/dl.
3. Two hour plasma glucose (Post prandial) ≥ 200mg/dl during
an oral glucose tolerance test.
2. HYPERURICEMIA:
Hyperuricemia is defined as serum uric acid level ≥ 8mg/dl in
males and ≥ 6 mg/dl in females.
3. BODY MASS INDEX:
It is estimated by using the formula : weight (kg)/ Height2(m)
4. OBESITY:
Obesity is usually defined as body mass index > 30, body mass
index between 25-30 kg/m2 as overweight. Body mass index between
25-30 should be viewed as medically significant, especially in the
Large scale epidemiological studies suggest that cardiovascular
morbidity begins to rise when body mass index ≥ 25, suggesting that
the cut of for obesity should be lowered.
WAIST HIP RATIO:
The waist is measured by taking a circumference that gives the
narrowest measurement between the rib cage and the iliac crest. The
hip measurement is taken by measuring at a level that gives the
maximal measurement of hip over the buttocks. It is a simple, and
convenient measurement that is unrelated to height, correlates closely
with body mass index and waist hip ratio is an approximate index of
intra abdominal fat mass and total body fat.
Waist hip ratio > 0.8 in women and > 1.0 in men being
abnormal.
LIPID PROFILE ABNORMALITY
According to NCEP-ATP III guidelines, the following lipid
values were considered as abnormal.
Triglycerides >150 mg/dl
MATERIALS AND METHODS
SETTING : Government Mohan Kumaramangalam
Medical college, Salem-30.
COLLABORATIVE : Department of Biochemistry,
Government Mohan Kumaramangalam
Medical college, Salem-30.
STUDY DESIGN : Descriptive analytical study
PERIOD OF STUDY : February 2008 to September 2009
SAMPLE SIZE : 70 Cases.
ETHICAL COMMITTEE
APPROVAL
: The present project was approved by
the Ethical committee.
INCLUSION CRITERIA:
1. Patients with type 2 diabetes mellitus (patients were taken
irrespective of their glycemic control and their duration of
diabetes).
2. Patients who were above 40 years were included.
EXCLUSION CRITERIA:
1. Patients with renal failure.
2. Pregnancy & lactating mothers.
3. Patients who were on long term diuretics & steroid.
4. Patients who were regularly consuming alcohol.
5. Patients who were on anti metabolite and chemotherapy
drugs.
6. Patients who had hepatic & metabolic disorders.
7. Patients who had PVD/CVA/ Pulmonary Tuberculosis.
8. Renal transplant patients.
CONTROLS:
Subjects who were above 40 years and had normal blood sugar
and who met the above exclusion criteria.
CONSENT:
The study group thus identified by the above criteria (inclusion
and exclusion) were first instructed about the nature of study. Willing
participants were taken up after getting a written informed consent
MATERIALS:
Thus a total of 70 cases who satisfied the inclusion and
exclusion criteria above were taken up for subsequent study. 30 age
and sex matched subjects were kept as control.
CONFLICT OF INTEREST:
There was no conflict of interest.
FINANCIAL SUPPORT:
Nil.
LIMITATIONS:
1. Because of limited resources GTT, HbA1C, leptin level, C
peptide assay, plasma insulin assay could not be tested.
2. X ray chest was not performed is every case due to technical
limitation.
3. Only serum uric acid levels were analysed. Urinary excretion
METHODS:
Selected socio- demographic, clinical, laboratory data were
elicited from the patients and controls and recorded in proforma.
1. Socio demographic data.
• Age
• Sex
2. Clinical Data.
• Body weight
• Height
• BMI, waist hip ratio (WHR)
• Systolic / Diastolic blood pressure
• Cardiovascular risk factors
• Clinical examination
3. Laboratory Data:
• Blood urea estimation was done manually by using diacetyl
monoxime method (DAM).
• Serum creatinine estimation was done by using COBAS auto
analyser.
PRINCIPLE:
Uric acid is converted by uricase to allantoin and hydrogen
peroxide in the presence of peroxidase (POD) which oxidizes the
chromogen to a red coloured compound which is read at 500mm.65
Uric acid + 2H2O + O2 URICASE Allantion + CO2+H2O2
Red quinolone + H2O +HCl (DHBS 3,5 dicholoro-2 hydroxy benzene sulphonic acid)
DHBS POD 2H2O2 + 4 Aminopyrine +
STATISTICAL ANALYSIS:
Data was entered in Microsoft excel spread sheet and analysed
statistically using standard statistical software. Student ‘t’ values was
RESULTS
The total number of subjects included in this study was 100.
Among those 100 subjects, 70 were cases (type 2 diabetes mellitus)
[image:48.612.123.509.315.642.2]and 30 were controls (non diabetic).
Table – 1 : Introduction
CASES CONTROLS
Total No. 70 30
Gender M=43;F=27 M=18; F=12
Age (Years) 43 to 72 41 to 75
Mean age (Years) 59.13 56.97
BMI 19.6-29.4 18.4-26.0
WHR 0.73-1.14 0.76-1.12
FBS (mg/dl) 105-172 86-120
PPBS (mg/dl) 157-302 139-181
ANALYSIS OF CASES AND CONTROL WITH RESPECT TO
AGE:
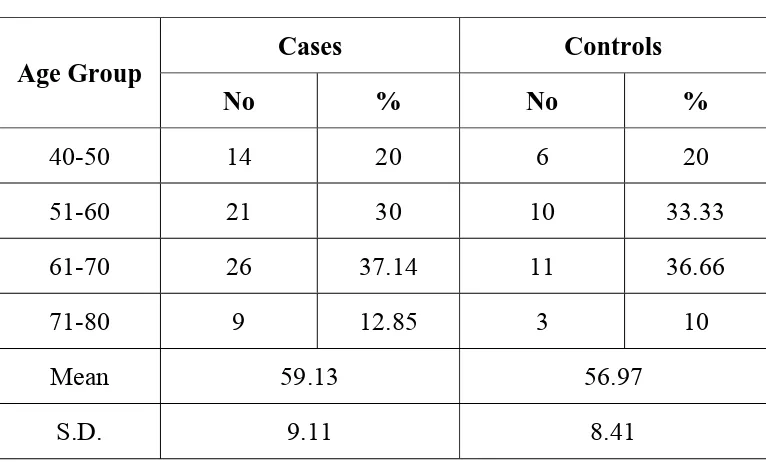
The age of the subjects in the study group ranged from 43 to 72
years. The mean and standard deviation for age of the cases and
controls were 59.13±9.11 and 56.97±8.41 respectively, there was no
significant difference among the cases and controls with reference to
the age. The distribution of cases and controls in relation to age is
[image:49.612.123.506.379.610.2]provided in table 2 given below.
Table 2 : Cases and Controls in relation to age
Age Group
Cases Controls
No % No %
40-50 14 20 6 20
51-60 21 30 10 33.33
61-70 26 37.14 11 36.66
71-80 9 12.85 3 10
Mean 59.13 56.97
S.D. 9.11 8.41
ANALYSIS OF CASES AND CONTROLS WITH RESPECT TO
GENDER
Among 70 cases studied, there were 43 males and 27 females,
among 30 controls there were 18 males and 12 females. The details
[image:50.612.122.510.291.449.2]are given in table 3 provided below.
Table 3 : Cases and Controls in relation to gender
Sex
Cases Controls
No % No %
Male 43 61.43 18 60
Female 27 38.57 12 40
Total 70 100 30 100 P = 0.7901 (Not significant)
The sex composition of the study group and control group does
not differ.
ANALYSIS OF CASES AND CONTROL WITH RESPECT TO
BMI:
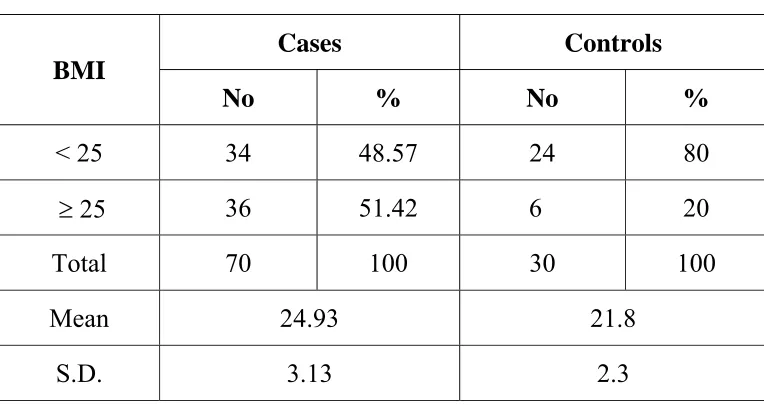
Among 70 cases and 30 controls screened for BMI, none were
obese. The mean and standard deviation for BMI of cases and controls
were 24.93 ± 3.13 and 21.8 ± 2.3 respectively. The details are shown
[image:51.612.123.505.320.525.2]in Table 4 given below:
Table 4 : Cases and Controls in relation to BMI
BMI
Cases Controls
No % No %
< 25 34 48.57 24 80
≥ 25 36 51.42 6 20
Total 70 100 30 100
Mean 24.93 21.8
S.D. 3.13 2.3
P = 0.0002 (Significant)
The BMI of the study group was significantly higher than that
BLOOD SUGAR DISTRIBUTION AMONG CASES
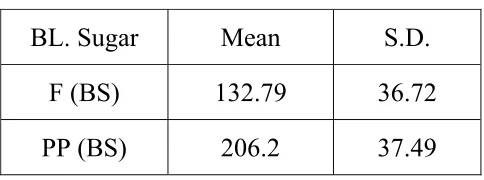
The details of fasting and post prandial blood sugar distribution
among the cases are shown in table 5 given below:
Table 5 : (F) BS and (PP) BS among cases
BL. Sugar Mean S.D.
F (BS) 132.79 36.72
PP (BS) 206.2 37.49
The mean and standard deviation for fasting blood sugar was
132.79±36.72 similarly for post prandial blood sugar was
206.02 ± 37.49 among diabetes. Thus showing their diabetic status
[image:52.612.194.436.262.352.2]DISTRIBUTION OF CASES AND CONTROLS IN RELATION
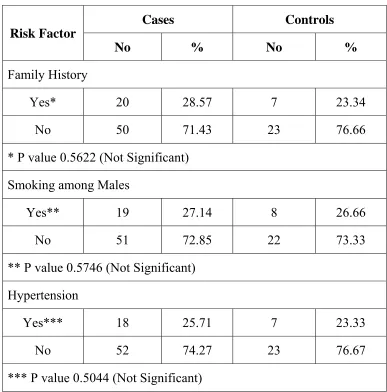
TO SELECTED CARDIOVASCULAR RISK FACTORS
Analysis of cases and controls in relation to selected
[image:53.612.120.507.231.623.2]cardiovascular risk factors are provided in Table 6 given below.
Table 6 : Selected Cardiovascular Risk Factors
Risk Factor
Cases Controls
No % No %
Family History
Yes* 20 28.57 7 23.34
No 50 71.43 23 76.66
* P value 0.5622 (Not Significant)
Smoking among Males
Yes** 19 27.14 8 26.66
No 51 72.85 22 73.33
** P value 0.5746 (Not Significant)
Hypertension
Yes*** 18 25.71 7 23.33
No 52 74.27 23 76.67
*** P value 0.5044 (Not Significant)
There was no significant difference between cases and controls
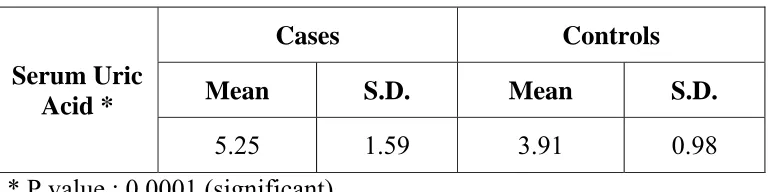
DISTRIBUTION OF CASES AND CONTROLS IN RELATION
TO SERUM URIC ACID LEVEL (SUA):
Serum uric acid in the study population and control varied from
2.8 to 8.3 and 2.9 to 5.3 mg/dl respectively. The mean and standard
deviation of uric acid among cases was 5.25 ± 1.59 while in control it
was 3.91 ± 0.98 respectively.
[image:54.612.124.511.354.450.2]The details are shown in the table 7 given below.
Table 7 : Serum Uric Acid level in diabetics and controls
Serum Uric Acid *
Cases Controls
Mean S.D. Mean S.D.
5.25 1.59 3.91 0.98 * P value : 0.0001 (significant)
The serum uric acid level of diabetics was very much elevated
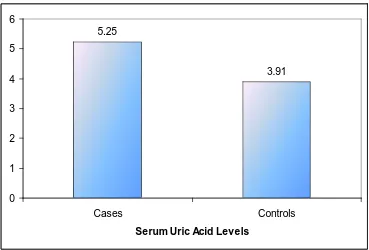
Fig : 3 – Mean Serum Uric Acid levels in cases and controls
5.25
3.91
0 1 2 3 4 5 6
Cases Controls
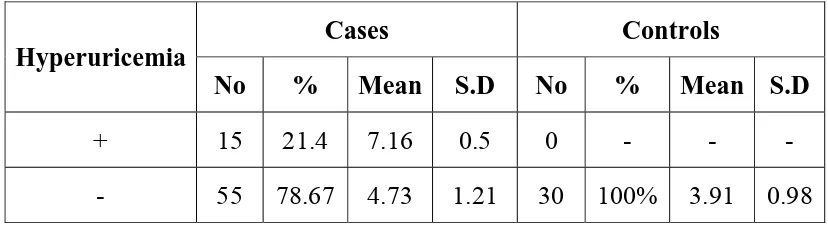
ANALYSIS OF HYPERURICEMIA IN CASES AND
CONTROLS
Hyperuricemia is defined as SUA level ≥ 8 mg/dl in males and
≥6 mg/dl in females. 15 cases had hyperuricemia while none in
[image:56.612.107.521.300.414.2]controls. The results are displayed in table 8 given below:
Table 8 : Hyperuricemia in Cases and Controls
Hyperuricemia
Cases Controls
No % Mean S.D No % Mean S.D
+ 15 21.4 7.16 0.5 0 - - -
- 55 78.67 4.73 1.21 30 100% 3.91 0.98
*P = 0.0001 (Significant)
This table clearly shows that the prevalence of hyperuricemia is
Fig. 4 : Hyperuricemia in Cases and Controls
15
0 55
30
0 10 20 30 40 50 60
Cases Controls
Present
ANALYSIS OF GENDER DISTRIBUTION WITH SERUM
URIC ACID AMONG THE CASES
The mean value of serum uric acid was 5.06 ± 1.64 in males and
[image:58.612.119.514.296.380.2]5.63 ± 1.12 in females and details are given in table 9 below.
Table 9 : Serum Uric Acid values in relation to gender among
cases
Sex No Mean S.D. P Value
Male 43 5.06 1.64
0.0196 Female* 27 5.93 1.12
*P Value = 0.0196 (Significant)
In the study group mean uric acid values were higher in females
SERUM URIC ACID VALUE IN RELATION TO BMI IN
CASES
The mean value of serum uric acid was 6.13 ± 1.45 in those
with BMI > 25. It was significantly higher than compared to those
having BMI < 25. The mean value of serum uric acid in BMI < 25
was 4.13±1.23.
[image:59.612.155.475.415.503.2]The details are shown in table 10 given below:
Table 10 : Uric Acid with regard to BMI among cases
BMI No. Mean S.D.
< 25 34 4.13 1.23
> 25* 36 6.13 1.45
* P Value = 0.0001 (Significant)
Fig. 5 : SERUM URIC ACID VALUE IN RELATION TO BMI
IN CASES
4.13
6.13
0 1 2 3 4 5 6 7
BMI < 25 BMI > 25
SERUM URIC ACID VALUE IN RELATION TO WAIST HIP
RATIO (WHR)
Uric acid level increases with increased WHR. The WHR
abnormality was considered in 33 cases based on, WHR above 1.0 for
men, above 0.8 for women and correlated with uric acid level was
[image:61.612.144.482.354.446.2]significant details are shown in table 11 given below:
Table 11 : Waist Hip Ratio and Hyperuricemia
WHR
Abnormality No. Mean S.D.
Yes* 33 5.93 1.37
No 37 4.63 1.3
SMOKING AND SERUM URIC ACID AMONG THE CASES
(ONLY IN MALES)
The mean value of serum uric acid among smokers was
5.03±1.69 when compared to non smokers 5.32±1.42, but the
difference was not significant statistically, this is shown in table 12
[image:63.612.151.476.357.443.2]given below:
Table 12 : Uric Acid Values in relation to Smoking (only in males)
Smoking No. Mean S.D.
Yes* 19 5.03 1.69
No 51 5.32 1.42
* P Value = 1.5472 (Not Significant)
SERUM URIC ACID VALUES IN HYPERTENSIVE PATIENTS
The mean serum uric acid level in the hypertensive group
(6.45±1.15) was significant more than non hypertensive group
(4.83±1.43) in the cases and the results are shown in the table 13 given
[image:64.612.155.475.296.381.2]below:
Table 13 : Serum Uric Acid values in relation to Hypertension
HT No. Mean S.D.
Yes* 18 6.45 1.15
No 52 4.83 1.43
SERUM URIC ACID LEVEL IN RELATION TO LIPID
PROFILE ABNORMALITY
The mean serum uric acid level in patients with lipid profile
abnormality was 6.67±0.94, while it was 4.75±1.44 in patients without
lipid profile abnormality and it was highly significant. The results are
[image:65.612.156.472.358.446.2]shown in table 14 given below:
Table 14 : Serum Uric Acid value in relation to lipid profile
abnormality
Lipid Profile
Abnormality No. Mean S.D.
Yes* 18 6.67 0.94
No 52 4.75 1.44
Table 15 : CAD and Hyperuricemia
Type of CAD
No. of Patients
Total no. of
Hyperuricemia Sex %
Ischaemia 16 4 2M + 2F 25%
Infarction 8 4 1M + 3F 50%
This table was showing number of patients with Ischaemia – 16.
Of these only 4 had hyperuricemia with equal sex distribution (1:1).
Number of patients with infarction was 8. Of these only 4 had
hyperuricemia, one male and three female patients (1:3).
Percentage of hyperuricemia in infarction is higher than in
ischaemia, and female patients were more involved in CAD than
SERUM URIC ACID VALUE IN RELATION TO DURATION
OF DIABETES
Mean value of Serum uric acid level was higher in longer
duration (9-12 years) of diabetes 6.87±1.03, when compared to shorter
duration (2-4 years) of diabetes 4.31±1.08. This is shown in table 16
[image:67.612.156.475.327.439.2]given below:
Table 16 : Duration of Diabetes and Hyperuricemia
DOD No. Mean S.D.
2-4 years 12 4.31 1.08
5-8 years 37 5.01 1.891
9-12 years* 21 6.87 1.03
* P Value = 0.001 (Significant)
Uric acid level increases with increasing duration of diabetes
Fig 7 : Duration of Diabetes and Hyperuricemia
4.31
5.01
6.87
0 1 2 3 4 5 6 7
M
e
a
n
U
ric
A
c
id
2-4 years 5-8 years 9-12 years*
DISCUSSION
Diabetes is the most common risk factor for cardiovascular
disease, and it is present in nearly 25% adults and increases in
prevalence with age.2
Hyperuricemia is one of the components of metabolic
syndrome. “In the absence of gout the presence of hyperuricemia in
patients with type 2 diabetes mellitus is an important marker as well as
an added risk factor for atherosclerosis.”7
In this study the relation between serum uric acid level and
diabetes was examined. Uric acid is a marker for CAD in combination
with other risk factors among diabetics.
Though uric acid level and age was independent it is possible
that duration of the illness may have an impact on uric acid levels.
In the present study females have higher uric acid level when
while in females it was 5.93±1.13, and the difference was statistically
significant in this study. The possible reasons for such difference may
be attributable to increased BMI and increased WHR among women.
In the present study serum uric acid correlated well with body
mass index (BMI). The mean uric acid in those subjects with BMI >
25 was higher than those with BMI < 25 (6.13±1.45 Vs 4.13±1.23)
and the difference was statistically significant.
Rathmann et al., assessed the various components of insulin
resistance syndrome in young black and white adults. They concluded
that body mass index showed strongest positive correlation with the
uric acid among insulin resistant components.62
Waist hip ratio is an important measure of obesity, especially
central obesity. Intrabdominal fat has significant implication for
morbidity than subcutaneous fat present in buttocks and extremities.40
Abdominal obesity is a component of metabolic syndrome.
abnormal. In this study patient with higher waist hip ratio had higher
uric acid level when compared with low waist hip ratio.
The mean uric acid value in patients with waist hip ratio
abnormality and patients without waist hip ratio was 5.93±1.38 and
4.63±1.3 respectively and the difference was statistically significant.
Strong epidemiologic data have linked serum uric acid to
hypertension in humans and experimental animal data suggests
hyperuricemia causes hypertension.63,64 The Olivetti heart study had
shown a independent positive association between serum uric acid and
development of hypertension.
When the level of serum uric acid in hypertensive patients was
compared with non-hypertensive patients in cases, the difference was
significantly higher in the present study.(6.45±1.15 vs 4.83±1.43)
Elevated triglycerides is the most important risk factor in
acceleration of atherosclerosis. There is a significant relationship
dyslipidemia was noticed as a risk factor in those with CAD, who had
significantly elevated serum uric acid levels. (6.67±0.94 vs 4.75±1.44)
“Uric acid stabilizes the platelet aggregation and enhances
thrombotic tendency,” thus suggesting hyperuricemia as a strong
predictor of myocardial infarction and stroke.66
Patients with Poor metabolic control and longer duration of
diabetes were more susceptible to develop various complications
including hyperuricemia.67 Our study also shows that higher level of
serum uric acid was seen in patients with longer duration of diabetes
when compared with shorter duration of diabetes, 6.87±1.03
(9-12yrs) vs 4.31±1.08 (2-4yrs) This difference was statistically
significant.
Uric acid >4 mg/dl should be considered as a “Red flag” in
those patients at risk for cardiovascular disease.58 In this study 78.57%
of diabetic patients have serum uric acid level >4 mg/dl, while only
30% of the control have serum uric acid >4mg/dl. In these patients the
clinician should strive to utilize global risk reduction programme to
reduce the complications of atherogenic process. The details in
Table 17 : Cases and Controls in relation to Uric acid
Serum Uric Acid
Cases Controls
No % No %
< 4 mg. 15 21.43 21 70
> 4mg. 55 78.57 9 30
P = 0.0001 (Significant)
Fig. 8 : Cases and Controls in relation to Uric acid
15
21 55
9
0 10 20 30 40 50 60
Cases Controls
< 4 mg
[image:73.612.132.501.408.659.2]The association of serum uric acid with cardiovascular disease
has been appreciated for nearly half a century. However, its role as a
cardiovascular risk factor remains controversial.68 In an epidemiologic
follow up study an association between serum uric acid and
cardiovascular disease was shown. The PIUMA study69 also
concluded that raised serum uric acid is a powerful risk marker for
subsequent cardiovascular disease and all cause mortality.
Of the 70 cases of type 2 diabetes mellitus, hyperuricemia was
observed in 15 patients which accounts for 21.43% of cases. Canon70
showed a prevalence of hyperuricemia in 25% of longstanding
uncontrolled diabetes. But in this study many of the cases were on
treatment which might have affected the results.
A large body of evidence links uric acid with metabolic
syndrome of insulin resistance, obesity, hypertension and
dyslipidemia. In this study relationship between obesity, hypertension,
CONCLUSION
¾ Uric acid was significantly elevated in diabetic population.
¾ The serum uric acid level was independent of age and smoking
status in males.
¾ Significant correlation was noticed between serum uric acid and
BMI as well as WHR.
¾ Significant elevation of uric acid level was observed more
among females.
¾ Elevated uric acid levels were significantly noticed among those
with hypertension, dyslipidemia, coronary artery disease and
chronicity of the diabetes.
¾ Uric acid level above 4 mg/dl in diabetic population (considered
as a “Red flag” sign) was a marker or risk factor for CAD,
SUMMARY
Diabetes mellitus is strongly associated with hyperuricemia.
The role of uric acid as a independent risk factor for cardiovascular
disease is a matter of controversy. The present study was proposed to
assess the uric acid status in patients with diabetes mellitus and to find
out its association with age, gender, BMI, WHR, smoking and CAD.
With rigid criteria, patients were selected carefully and evaluated on
social, clinical and laboratory aspects after getting institutional, ethical
clearance and informed consent. 30 healthy age, sex matched
individuals were kept as control. There were 43 males and 27 females
in the study group and 18 males and 12 females in the control group.
There was no significant difference among cases and controls in
relation to age.
In study group, BMI below 25 was seen in 34 cases (48.57%),
BMI above 25 seen in 36 cases (51.42%) which was significantly
more than controls. BMI had significantly correlated with
in diabetics, which also correlated with elevated serum uric acid
significantly.
Elevated serum uric acid level was noticed more among those
who had hypertension dyslipidemia, coronary artery disease and they
were significant. Patients with longer duration of diabetes also had
elevated uric acid level.
The factors contributing to hyperuricemia in diabetes are,
1. Hyperinsulinemia acutely reduces urinary uric acid and sodium
excretion.
2. Hyperinsulinemia imposes a chronic antinatriuretic and anti
uricosuric effect on the kidney.
3. Microvascular disease in diabetes mellitus causes local tissue
ischemia and decreased renal blood flow leading to ischemia
with associated lactate production that blocks urate secretion in
proximal tubules. Increased uric acid synthesis occurs due to
increased purine metabolism, ischemia induced increased
Routine annual estimation of uric acid among diabetics from the
identification of diabetes will help the clinician to find out the
changing trends of uric acid level which is likely to be influenced by
control of blood sugar and development of hypertension, such cases
should be carefully monitored for CAD as well as other vascular
episodes.
Since uric acid is a confounding factor and multiple factors are
involved for elevated uric acid. A meticulous control of blood sugar,
hypertension, dyslipidemia among diabetics will bring down elevated
uric acid level in diabetics.
Let us have a Moto of,
“Assess diabetics for risk factors;
Assist to control them and
Arrest the development of complications”
Diabetes
1 52 M 6 20.6 0.86 Y N N N 136 222 N N N N N N 4.2
2 69 M 10 27.8 1.08 Y Y Y Y 122 203 N N MI Y Y N 8.1
3 43 M 2 19.6 0.73 N N N N 123 186 N N N N N N 2.8
4 55 M 5 20.2 0.80 N N N N 109 173 N N N N N N 3.8
5 62 M 8 28.8 1.12 Y N N N 137 233 N N N N N N 3.0
6 51 M 3 21.9 0.86 N Y N Y 119 173 N N MI N N N 4.6
7 61 M 7 23.2 0.80 Y N N N 149 200 N N N N N N 3.5
8 47 M 3 20.4 0.78 N Y N N 107 187 N N N N N N 3.7
9 62 M 6 23.7 0.84 N N Y Y 158 253 N N I N Y N 4.8
10 44 M 4 23.3 0.83 N N N N 172 192 N N N N N N 4.0
11 71 F 12 27.7 0.91 N N Y N 105 202 N N MI Y Y Y 6.2
12 59 F 8 27.3 0.89 N Y N Y 137 170 N N I N N N 5.3
13 72 F 14 27.4 0.93 N N Y Y 135 223 N N I Y Y N 6.1
14 53 F 5 21.4 0.80 N N N N 164 222 N N N N N N 5.8
19 55 F 7 24.8 0.84 N Y N N 123 157 N N N N N N 4.0
20 66 F 10 28.3 0.92 N N N N 135 157 N N N Y Y N 5.8
21 43 M 2 19.6 0.76 Y N N N 139 192 N N N N N N 3.8
22 67 M 7 20.4 0.80 Y Y N Y 159 201 N N I N N N 4.6
23 63 M 9 27.4 0.82 Y N N Y 151 243 N N I N N N 5.8
24 72 F 12 27.2 0.92 N N Y N 119 231 N N N Y Y N 6.3
25 59 M 10 27.4 1.14 Y Y Y Y 147 243 N N I N N N 8.1
26 57 F 6 28.2 0.81 N N Y N 145 174 N N N N N N 4.6
27 62 F 6 24.5 0.92 N N N N 127 126 N N N N N N 4.0
28 63 M 7 27.4 1.02 Y Y Y Y 109 223 N N MI N N N 6.5
29 60 F 10 27.3 1.12 N Y N N 133 211 N N N N Y N 6.1
30 58 F 9 28.4 1.10 N N N Y 114 216 N N I Y N N 5.7
31 61 M 7 22.3 0.80 Y N N N 152 247 N N N N N N 3.2
32 63 M 8 27.2 0.84 N N Y N 120 196 N N N N N N 4.6
33 69 M 10 27.4 1.02 N Y Y Y 107 176 N N I Y Y N 8.1
38 63 M 7 27.0 1.02 N N N N 137 211 N N N N N N 8.2
39 66 F 6 27.8 1.00 N Y N N 111 209 N N N N N N 5.4
40 61 M 6 23.8 0.88 N N N N 142 231 N N N N N N 3.0
41 62 M 6 20.8 0.80 Y N N N 117 199 N N N N N N 3.1
42 72 M 10 27.8 0.92 N Y Y Y 121 201 N N I Y Y Y 6.7
43 57 M 7 20.2 0.80 N N N N 106 192 N N N N N N 3.2
44 44 M 4 20.0 0.80 N N N N 109 157 N N N N N N 2.8
45 71 F 8 29.0 1.08 N N N Y 151 245 N N MI Y N Y 7.7
46 54 M 7 27.4 0.92 N Y N N 149 211 N N N N N N 5.2
47 63 M 7 27.8 0.88 N N N N 108 238 N N N Y N N 3.8
48 57 M 6 20.1 0.80 N N N N 117 187 N N N N N N 3.6
49 67 M 10 28.7 0.96 Y N N Y 138 147 N N MI N N N 6.6
50 69 M 12 27.8 1.00 N N Y Y 161 191 N N I Y Y N 6.6
51 59 M 9 21.3 0.78 N N N N 152 301 N N N N N N 4.6
52 72 M 10 27.6 0.92 N Y Y N 145 203 N N N Y N Y 6.6
57 48 F 6 21.2 0.80 N N Y N 146 180 N N N N N N 8.0
58 47 M 5 20.6 0.78 Y N N N 142 302 N N N N N N 3.1
59 62 M 7 27.4 1.07 N N N Y 150 251 N N I N N N 6.3
60 55 M 3 23.2 0.92 Y N N N 109 178 N N N N N N 4.7
61 65 M 8 27.8 1.02 N Y N N 115 203 N N N N Y N 6.0
62 63 F 7 29.4 0.80 N N N Y 126 241 N N I N N N 4.2
63 72 F 14 29.0 1.09 N Y Y N 152 199 N N N Y Y Y 6.1
64 51 F 3 23.1 0.84 N N N N 132 173 N N N N N N 6.4
65 50 F 6 21.4 0.87 N N N N 106 161 N N N N N Y 5.5
66 44 M 3 19.6 0.78 Y N N N 119 172 N N N N N N 2.8
67 49 F 3 20.1 0.81 N N N N 137 253 N N N N N N 5.9
68 72 M 12 28.4 1.09 Y Y N N 139 171 N N N Y Y Y 8.3
69 45 F 7 24.7 1.06 N N N N 151 189 N N N N N N 4.9
S.
No. (Yrs.) Age Sex DOD BMI WHR Smoking Family History of Diabetes Systemic Hyper Tension IHD
BS
(F) (PP) BS Parameters Renal USG Abd ECHO / ECG Lipid Profile Abnormality Retino Pathy Nauro pathy Sr.Uric acid
1 54 M 6 20.6 0.83 Y Y N N 92 154 N N N N N N 3.7
2 46 M 3 19.4 0.80 N N N N 78 142 N N N N N N 5.2
3 61 M 8 20.3 0.81 N Y N N 106 148 N N N N N N 2.9
4 64 M 10 25.4 0.84 N N Y N 110 147 N N N N N N 3.6
5 41 F 2 18.6 0.78 N N N N 110 167 N N N N N N 3.6
6 59 F 7 21.4 0.82 N N N N 120 172 N N N N N N 4.5
7 67 M 8 22.4 1.10 Y Y Y N 112 161 N N N N N N 5.5
8 52 M 3 20.6 0.81 Y N N N 118 147 N N N N N N 3.2
9 63 M 8 24.7 0.88 N N N N 120 162 N N N N N N 3.7
10 60 F 4 23.8 0.87 N N N N 116 139 N N N N N N 3.8
11 55 F 3 25.7 0.80 N N Y N 86 168 N N N N N N 4.3
12 49 F 3 19.6 0.78 N N N N 92 167 N N N N N N 5.2
13 44 M 3 18.4 0.82 Y N N N 118 149 N N N N N N 3.8
18 49 F 23 20.6 0.84 N N N N 112 142 N N N N N N 3
19 51 F 3 21.4 0.86 N N N N 119 167 N N N N N N 3.7
20 55 M 3 20.8 0.80 N Y Y N 106 143 N N N N N N 4
21 66 F 10 25.8 0.87 N N N N 111 168 N N N N N N 3.4
22 62 M 9 23.2 0.83 N N N N 107 167 N N N N N N 3.6
23 64 M 8 25.6 0.82 Y Y N N 120 148 N N N N N N 3.8
24 47 M 2 20.0 0.84 N Y N N 110 151 N N N N N N 3.7
25 53 F 6 19.6 0.76 N N N N 105 170 N N N N N N 3.3
26 64 F 5 20.3 0.80 N N N N 96 164 N N N N N N 3.1
27 73 M 2 20.4 0.81 Y N Y N 98 170 N N N N N N 5.2
28 74 M 2 19.6 0.80 N N N N 102 181 N N N N N N 5.1
29 63 F 7 18.4 0.80 N N N N 100 176 N N N N N N 3.1