This is a repository copy of Right-first-time dyeing: a design of experiments approach for
the optimisation of dyeing-processes using hard water.
White Rose Research Online URL for this paper:
http://eprints.whiterose.ac.uk/146658/
Version: Accepted Version
Article:
Faisal, S, Tronci, A, Ali, M et al. (2 more authors) (2019) Right-first-time dyeing: a design of
experiments approach for the optimisation of dyeing-processes using hard water. Pigment
& Resin Technology, 48 (5). pp. 449-455. ISSN 0369-9420
https://doi.org/10.1108/PRT-05-2019-0045
Copyright © 2019, Emerald Publishing Limited. This is an author produced version of a
paper published in Pigment & Resin Technology. Uploaded in accordance with the
publisher's self-archiving policy.
[email protected] https://eprints.whiterose.ac.uk/
Reuse
Items deposited in White Rose Research Online are protected by copyright, with all rights reserved unless indicated otherwise. They may be downloaded and/or printed for private study, or other acts as permitted by national copyright laws. The publisher or other rights holders may allow further reproduction and re-use of the full text version. This is indicated by the licence information on the White Rose Research Online record for the item.
Takedown
If you consider content in White Rose Research Online to be in breach of UK law, please notify us by
2
Right-first-time dyeing: A design of experiments
approach for the optimisation of dyeing-processes
using hard water
S. Faisala1, A. Troncib, M. Alia, E. Bashirc, L. Lind
a Textile Engineering Department, NED University of Engineering & Technology, Karachi
75270, Pakistan.
b Department of Mechanical, Chemical and Materials Engineering, University of Cagliari,
Cagliari 09124, Italy.
c Batch: 2014-15, Industrial Chemistry Department, NED University of Engineering &
Technology, Karachi, 75270, Pakistan.
d Department of Colour Science, University of Leeds, Leeds LS2 9JT, United Kingdom.
1 Textile Engineering Department, NED University of Engineering & Technology,
University Road Karachi-75270, Pakistan; phone: +922199261261-8; fax: +922199261255;
Email: [email protected]
Acknowledgement
The authors wish to thank NED University of Engineering & Technology for moral
support. Authors also wish to acknowledge Archroma Pakistan for their continuous
assistance.
Purpose - Owing to the persistent water scarcity for more than two
decades now, the textile industry in Pakistan is forced to rely on
high-mineral-content ground water for use in textile wet processing.
Furthermore, the limited amount of municipal water that is at the disposal
of the textile industry is also high in mineral content. Thus, on the large
scale, water hardness has become an acute problem for the textile
3
have crucial effects. However, to-date, no systematic study has been
conducted on this aspect of textile dyeing.
Design/methodology/approach - In this study, 32 full factorial design
was used to optimise the dyeing conditions to achieve right-first-time
dyeing in hard water. Thus cotton fabric was dyed with Red Reactive dye
(of dyebath concentration at 5, 10 and 15 g/L respectively) in prepared
hard water (of hardness at 10, 40 and 70 dH) respectively. Analysis of
variance, coefficient of determination (R2) and p-values for the models
were used to evaluate the adequacy of the predictive models. The surface
plots of the effects were studied to further examine the interactions of two
independent variables. Derringer’s desirability function was used to
determine the optimum levels of each variable.
Findings - Three levels for both independent variables generate
second-order polynomial models to predict the colour strength, lightness,
red/green, yellow/blue and total colour difference values of dyed cotton.
The obtained predictive models point out the considerable influence of both
water hardness and dye concentration on right-first-time dyeing.
Originality/value - Such a finding enabled the dye-mill to produce the
correct shade at water hardness of 10dH and 15g/L dye concentration,
without the need for corrective reprocessing.
Keywords: Right-first-time dyeing; water hardness; reactive dyeing;
colorimetric properties; 32 full factorial design; optimisation
Introduction
Textile sector contributes to approximately 60% of Pakistan s total exports, making it the
8th largest exporter of textiles in Asia and 12th largest exporter globally (Shah et al., 2014).
4
70% of local industrial water consumption. Water consumption in Pakistan’s textile
sector is estimated to be 50 million m³ per day which is significantly higher than the
international average (Kapfensteiner and Azhar, 2017). Thus, it is evident that the textile
sector of Pakistan needs to improve its water-use efficiency. In addition, a scientific
understanding of the effects of hard water on water intensive processes such as dyeing
will help in overcoming the stated problem in a sustainable manner.
Introduced in 1970, the concept of right-first-time production in textile dyeing
sector means that every batch or lot of dyed fabric should be the correct shade, every
time, as assessed against the target shade, without the need for corrective reprocessing
or adjustment during the process (Park and Shore, 2009; Ammayappan et al., 2016; Rasel
et al., 2018). The benefits of achieving the right-first-time are very significant including
for instance, reduction in water and energy consumption, reduction in effluent
generation along with time and colour saving (Parton, 1994). Right-first-time dyeing is
a difficult and daunting task for a dyer and requires great control over dyeing
parameters such as quality of dyestuff and auxiliaries, concentration of salt and alkali,
time and temperature, and water quality (Park and Shore, 2009; Rasel et al., 2018; Roy
Choudhury, 2013; Khatri et al., 2015).
The hardness of water (presence of Ca+ and Mg+ ions; expressed in terms of
German Degree Hardness) is a particularly critical factor in shade matching and it can
prevent dye-houses from achieving a high level of right-first-time production (Ahmed,
2005; Jain and Mehta, 1991; Ammayappan et al., 2016; Uddin and Atiquzzaman, 2014).
It is reported that presence of calcium and magnesium ions in water can cause dye
precipitation and aggregation which result in shade variation, faulty dyeing and loss in
colour strength (Ahmed, 2005; Tullio, 1977). Further, carbonates and hydroxides of
5
interaction with alkalis and heating during dyeing and soaping. These precipitates are
sticky, adhere readily to fabric surface and results in unlevelled dyeing, white patches
and poor shade matching (Anis and Eren, 2002; Hossain, 2014).
Textile sector of Pakistan is facing an acute problem of water hardness because
the two main sources of water, i.e., groundwater and municipal water, both contains
large amounts of mineral content (Faisal et al., 2019). Therefore, the lack of
right-first-time dyeing (target shade not achieved the first right-first-time after the first attempt of dyeing) are
very frequent and leads to the necessity of corrective reprocessing such as re-dyeing or
stripping which unnecessarily increases the additional consumption of resources such
as dyestuff and auxiliaries, time, and also increases the cost of production (Dawson,
2012; Collishaw et al., 1993). Corrective reprocessing also consumes additional water,
energy and generates more effluent (Ozturk and Cinperi, 2018; Roy Choudhury, 2013;
Dawson, 2012; Collishaw et al., 1993).
Amongst many classes of textile dyestuffs, the reactive dyes contribute about
50% of the total market share due to their wide-ranging shade gamut, flexibility in
application, and the outstanding fastness properties (Lewis, 2014). They are widely used
in coloration of cotton, silk, wool and regenerated cellulosic fibres (Khatri et al., 2015;
Khatri et al., 2011).
The effects of water hardness on right-shade-first-time when dyeing with
reactive dyes is well established and extensively studied (Jain and Mehta, 1991; Kan,
2008; Shinde et al., 2015; Rahman et al., 2016; Khalil and Sarkar, 2014; Chapatwala et al.,
1994; Ishtiaque et al., 2000; Sampath, 2001; Faisal et al., 2019). However, to our
knowledge, no previous work has reported systematic optimisation of dyeing-process
for right-first-time dyeing in hard water. Thus, the main aim of the present study is to
6
not be avoided in certain scenarios as discussed in the preceding text. In the present
work, 32 full factorial design was employed to design experiments in an attempt to
systematically understand the quantitative effects of water hardness and concentration
of dye on shade variation of the dyed fabrics and optimise such dyeing process
parameters.
Experimental
Materials and reagents
Magnesium sulphate heptahydrate (MgSO4.7H2O) and anhydrous calcium chloride
(CaCl2) were purchased from Merck (Germany) and used as received. Drimaren Red
HF-CD (CI number confidential, unknown), Solidokol NM and Revatol S (mild oxidising
agent) were kindly provided by Archroma (Pakistan). Sodium bicarbonate, sodium
hydroxide (36Be), sodium chloride and soda ash of commercial grades were also
provided by Archroma (Pakistan). Scoured, bleached and mercerised 100%
cotton fabric (130 g/m2; plain weave) supplied by Lucky Textile Mills was used in this
study.
Preparation of Stock Solution
Stock Solution A was prepared by dissolving 39g of anhydrous calcium chloride (CaCl2)
in distilled water and made up to a volume of 1000 mL to get 13554 ppm of stock solution
of calcium. Likewise, Stock solution B was prepared by dissolving 43.93g of magnesium
sulphate heptahydrate (MgSO4.7H2O) in distilled water and made up to a volume of
1000 mL to get 4148 ppm of stock solution of magnesium.
Preparation of Standard Hard Water
100g of solution A, 50g of solution B and 1.24g of sodium bicarbonate was dissolved in
7
of 15dH. The dilution to obtain water of various hardness was calculated by following
Equation 1;
2 2 1 1
v
c
v
c
(1)Where c1 is concentration of the prepared standard hard water; v1 is the volume of the
standard hard water; c2is the required concentration of hard water and v2 is the final
volume of required hard water. The hardness of the prepared water was checked by
titrating it against standard 0.01M EDTA solution and adjusted if required.
Dyeing
Dyeing and rinsing of fabric samples was conducted with hard water dyebath and hard
water respectively. Cotton fabric samples were padded with a pad liquor containing 5,
10 and 15 g/L of Drimarene Red HF-CD, respectively, and 10 g/L of solidokol NM. After
drying at 120C, the pre-padded fabric samples were padded again with pad liquor
containing 250 g/L of sodium chloride, 20 mL/L of sodium hydroxide 36 Be, 20 g/L of
soda ash and 10 mL/L of Revatol S, followed by steaming at 102 C for 60s. The fabric
samples were then rinsed with cold water, soaped using 2 g/L Ladipur RSK at boil for
10 min, and finally rinsed with cold water until no further colour bleed and then dried
under laboratory conditions.
Colour Measurements of Dyed Fabric
The colorimetric data (%R, CIELAB coordinates) of the dyed fabric samples was
measured using Datacolor spectrophotometer 650 using 10 observer with a D65
illuminant. Each dyed fabric sample was folded to four layers and measurements were
made at five different locations. Total colour difference (E) was calculated on the basis
8
2 0 2
0 2
0
)
(
*
)
(
*
)
*
(
L
L
a
a
b
b
E
(2)Where L* denotes lightness, a* denotes the red/green value and b* denotes the
yellow/blue value of the measured fabric samples dyed in hard water and L0, a0 and b0
are the lightness, the red/green and the yellow/blue values of the target fabric samples
dyed in distilled water using the same recipe.
The corresponding colour strength (K/S) value was calculated at max using Equation 3;
R R S
K
2 ) 1 ( /
2
(3)
Where K is the absorption coefficient, S is the scattering coefficient and R is the
reflectance of the dye fabric sample.
Experimental Design
On the basis of the authors’ previous work (Faisal et al., 2019), a two factors three levels
(32) full factorial design was employed to study, predict and optimise the influence of
process variables, such as water hardness (10, 40 and 70 g/L) and dye concentration (5,
10 and 15 g/L), on the colour strength and colorimetric properties of dyed cotton
samples. The water hardness (x1) and dye concentration (x2) were chosen as the critical
independent variables. The low, intermediate, and high levels of each variable were
designated as −1, 0, and +1, and given in Table 1. The design of experiments and
observed responses data are summarised in Table 2.
Place Table 1 here.
Place Table 2 here.
The use of three levels for each independent variable allows the generation of a
second-order polynomial equation to correlate the predictors and the responses, which
encompass linear, quadratic and interactive effects of the process variables (Ishtiaque et
9
by means of Minitab 17 statistical software tool. The generalised form of the
second-order polynomial equation that was employed is given in Equation 4 (Montgomery,
2017): j i j i ij i k i ii k i i
ix x xx
y
2
1 1
0 (4)
Where y is the response variable; xiand xjare the independent variables affecting the
response; 0, i, ii and ijare the regression coefficients for intercept, linear, quadratic
and interaction terms, respectively.
Results and Discussion
Mathematical Modelling
The results obtained from the 32 full factorial experiments for dyeing process were
evaluated by multiple regression analysis. A relationship between the response and
predictors has been expressed by a second-order polynomial equation which will help
to predict the colour strength and colorimetric properties (L*a*b* and E) of the dyed
fabric in different sets of combinations. Five predictive models were generated to
understand and predict the interactive correlation between each response and the
predictors (x1 and x2). The final models obtained in terms of coded variables are given in
Equations 5, 6, 7, 8 and 9;
2 1 2 2 2 1 2
1 1.719 0.161 0.211 0.068 090 . 0 533 . 3
/S x x x x xx
K (5)
2 1 2 2 2 1 2
1
6
.
260
0
.
262
1
.
217
0
.
530
848
.
0
002
.
52
*
x
x
x
x
x
x
L
(6)2 1 2 2 2 1 2
1 4.958 0.243 0.888 0.528 847 . 0 162 . 42
* x x x x xx
a (7)
2 1 2 2 2 1 2
1 0.214 0.103 0.444 0.130 352 . 0 458 . 11
* x x x x xx
b (8)
2 1 2 2 2 1 2
1 0.843 0.261 0.875 0.345 810
. 0 561 .
1 x x x x xx
E
10 Adequacy of Predictive Models
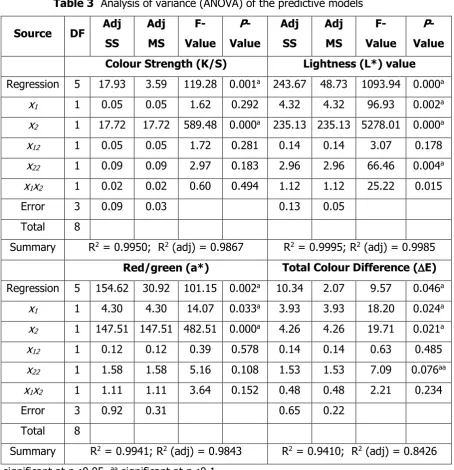
The adequacy of the predictive models was assessed by analysis of variance (ANOVA),
coefficient of determination (R2) and p-values for the model and the results are shown in
Table 3. From Table 3, it is observed that, under 95 % confidence levels, the significant
model terms for K/S was x2; for L* value x1, x2 and x22; for a* and E value x1 and x2. In
case of R2, it was 0.9950, 0.9995, 0.9941 and 0.9410 for K/S, L*, a* and E, respectively,
which indicates that these models fit the experimental data very well. From Table 3, it is
also evident that the p-value of predictive models was p<0.001 for K/S, L* and a* values
and p<0.05 for E, which implied that these models were significant at the 95%
confidence level. However, predictive model for b* value was not statistically significant
(p>0.05, data not shown).
Place Table 3 here.
Effect of Independent Variables on Responses
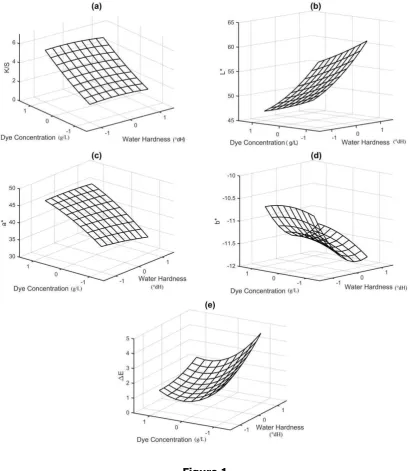
The regression coefficients of the predictive models and their statistical significance
values are presented in Table 4. In addition, 3D surface plots were constructed using
developed models (Equations 59) to examine the relationship between each response
(K/S, L*, a*, b* and E respectively) and the two independent variables, which are
shown in Figure 1.
Effect on Colour Strength (K/S)
Higher K/S value indicates greater depth of the colour of dyed fabric surface (Yuen et
al., 2004). According to Table 4, water hardness had a negative effect on its linear and
quadratic terms whereas the concentration of dye significantly (p<0.05) increased the
colour strength in a linear manner. The interactive effects between water hardness and
concentration of dye showed a negative effect on colour strength. It is clearly indicated
11
as the concentration of dye increases. The effect of the water hardness can be attributed
to the presence of elevated amount of calcium and magnesium ions in the dye liquor
that will increase the potential barrier at the interface between cotton fibre and dye liquor
(Kan, 2008). This increase in potential barrier will resist dye anions passing the interface
to enter the fabric surface, resulting in a decrease in dye absorption and hence decrease
in colour strength. The decrease in colour strength at higher water hardness level is also
attributed to the presence of precipitates of calcium carbonate and magnesium
hydroxide. It was reported earlier (Jain and Mehta, 1991) that reactive dyes have strong
affinity for these precipitates and are responsible for loss in colour strength.
Place Table 4 here.
Place Figure 1 here.
Effect of Independent Variables on Colorimetric Properties
In CIELAB colour space, L* is an approximate measurement of lightness (Becerir, 2011).
The higher the L* value the lighter the shade. The results in Table 4 clearly show that
both water hardness and concentration of dye significantly (p<0.05) affected the
lightness value. Thus, water hardness showed a positive effect on its linear and quadratic
terms and concentration of dye affected the lightness negatively in a linear and
positively in quadratic manner showing a curvilinear decrease in L* value. The
interactive effects between water hardness and concentration of dye showed a negative
effect. As shown in Figure 1b, it is clear that the L* value of dyed samples increases with
increasing water hardness and decreases with increasing dye concentration. The L*
values showed similar relationship to the colour strength indicating that as the water
hardness increases the dyed samples become lighter. This increase in L* value of dyed
12
precipitates or chalky stains of calcium carbonate and magnesium hydroxide on surface
of dyed samples (Shinde et al., 2015; Saleem and Amin, 2017).
In CIELAB colour space, positive a* value depicts shift towards red shade and negative
value shows shift towards green shade (Becerir, 2011). It can be seen from Table 4 that
water hardness exhibit strongly negative and concentration of dye exhibit strongly
positive effect on the a* value of dyed samples. It can be seen from Figure 1c that a* value
of dyed samples decreases (shifts toward green shade) with increasing water hardness
indicating that the dyed samples become greener in shade. Moreover, with increasing
dye concentration the a* value increases which signifies that dyed samples become
redder in shade.
In CIELAB colour space, positive b* value illustrates shift towards yellow shade and
negative value elucidates shift towards blue shade. It can be observed from Table 4 that
neither water hardness and nor concentration of dye have a significant (p>0.05) effect on
the b* value of the dyed samples. However, water hardness showed a negative effect on
its linear and quadratic terms whereas concentration of dye showed a positive effect in
its linear and quadratic terms. The interaction term of water hardness and concentration
of dye showed a positive effect. From Figure 1d, it is apparent that b* value decreases
with increasing water hardness indicating that the samples become bluer or less yellow
in shade. The results of CIELAB colour coordinates suggests that as the water hardness
increases the dyed samples appeared lighter, greener (less red), and bluer (less yellower)
because calcium and magnesium ions stimulates the formation of an insoluble
complexes which causes shade variation.
The colour difference (E) takes into account the L*, a* and b* values of the target and
the dyed samples. It is generally used as a pass or fail criterion for assessing shade and
13
dyeing process (Parton, 1994). From Table 4 it can be seen that both water hardness and
concentration of dye have significant (p<0.05) effect on the colour difference of the dyed
samples. It was also observed that water hardness showed a positive effect on its linear
term and a negative effect on its quadratic term whereas concentration of dye showed a
negative effect in its linear term and a positive effect on its quadratic term. The
interaction terms of both water hardness and concentration of dye showed a positive
effect. Also, E was significant among the hardness levels and dye concentrations
trailed. In addition, Figure 1e shows that higher E values were recorded for higher
water hardness level and lower dye concentration, as the results of the changes in L*, a*
and b* values of the dyed samples.
Simultaneous Optimization of Colour Strength and Total Colour Difference
Attempts to obtain a set of an optimal conditions to achieve both maximum colour
strength (K/S) and minimum total colour change (E) followed. For usual practice,
target values are identified based on literature or common industrial practice and used
to set the optimisation process. However, in this study, the predictive models previously
found for colour strength and E were employed to obtain specific optimum conditions.
Simultaneous optimisations of the responses are commonly performed by means of
Desirability Functions (Costa et al., 2011). Among all the proposed methods, the authors
chose to carry out the optimisation using the Derringer’s method (Derringer and Suich,
1980), due to its good reliability and the requirement of substantial mathematical and
statistical expertise to implement. This method searches for the values of independent
variables that simultaneously satisfy the pre-set requirements according to the chosen
predictive models, through the evaluation of a specific (weighted) combination of colour
strength and E’s equations. Finally, the optimal conditions will result from the pair of
14
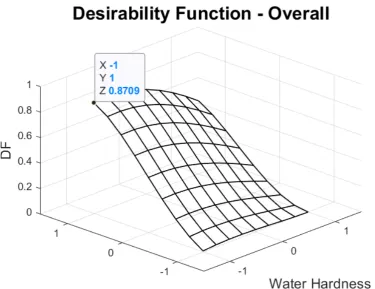
Function. Using the 32 factorial results, the optimum level of parameters was obtained
which indicated that water hardness of -1 level i.e. 10 dH and a dye concentration of +1
level i.e. 15 g/L giving a K/S value of 5.46 and a E value of 0.699 with an overall
desirability value of 0.8709 (Figure 2). This combination of optimised values could be
considered, in this specific case under investigation, as the optimum and feasible and
taken in account in further studies to be validated as best conditions for right-first-time
dyeing in hard water.
Place Figure 2 here
Conclusion
In this research, the influence of water hardness and the dye concentration of the
dyebath on right-first-time production have been studied through a set of 32 full factorial
design. As a result of the analysis and interpretation of the experimental data obtained,
second-order equations as mathematical models were developed with a particular
attention to their fitting performances. These models were later employed in the
prediction and simultaneous optimisation of the conditions of dyeing-process in hard
water by means of the Desirability Function. By focusing on R2, which were found to
exhibit more than 95% confidence level of the models, the efficiency of the second-order
equations in the description of the relationships between the independent variables and
the responses has been demonstrated. In particular, the analysis of variance presented
extremely high R2 of 0.9950, 0.9995, 0.9941 and 0.9410 for colour strength, *L, a* and E
respectively, confirming an adequate fit of the developed equations with the
experimental data. Such models were used to obtain a set of optimal dyeing conditions
that result in highly accurate colour matching of the dyed fabric samples with the target
fabric samples. The optimum conditions were found to be 10 °dH and 15g/L for water
15
and E, which resulted from the combination of the optima of independent variables,
were calculated to be 5.46 and 0.699 respectively. Further studies and consistent
experimental campaigns will be necessary to validate this assumption, which will surely
be a future development of this work.
References
AHMED, N. S. E. 2005. The use of sodium edate in the dyeing of cotton with reactive dyes. Dyes and Pigments, 65, 221-225.
AMMAYAPPAN, L., JOSE, S. & RAJ, A. A. 2016. Sustainable production processes in textile dyeing. In: MUTHU, S. & GARDETTI, M. (eds.) Green Fashion: Environmental Footprints and Eco-design of Products and Processes. Singapore: Springer.
ANIS, P. & EREN, H. A. 2002. Comparison of alkaline scouring of cotton vs. alkaline pectinase preparation. AATCC Review, 2, 22-26.
BECERIR, B. 2011. Assessment of the results of different color difference formulae under different illuminants by wash fastness tests. Fibers and Polymers, 12, 946-956.
CHAPATWALA, M. N., KAPADIA, P. J. & GANDHI, R. S. 1994. Effect of water hardness and total dissolved solids on dyeing of polyester and cationic dyeable polyester. Colourage, 41, 29-41.
COLLISHAW, P. S., PHILLIPS, D. A. S. & BRADBURY, M. J. 1993. Controlled coloration: a success strategy for the dyeing of cellulosic fibres with reactive dyes. Journal of the Society of Dyers and Colourists, 109, 284-292.
COSTA, N. R., LOURENÇO, J. & PEREIRA, Z. L. 2011. Desirability function approach: a review and performance evaluation in adverse conditions. Chemometrics and Intelligent Laboratory System, 107, 234-244.
DAWSON, T. 2012. Progress towards a greener textile industry. Coloration Technology, 128, 1-8.
DERRINGER, G. & SUICH, R. 1980. Simultaneous optimization of several response variables. Journal of Quality Technology, 12, 214-219.
FAISAL, S., FAROOQ, S., HUSSAIN, G. & BASHIR, E. 2019. Influence of Hard Water on Solubility and Colorimetric Properties of Reactive Dyes. AATCC Journal of Research, 6, 1-6.
16
ISHTIAQUE, S., PARMAR, M. & CHAKRABORTY, M. 2000. To study the structural behaviour of natural coloured cotton and its interaction with different chemicals. Colourage, 47, 15-24.
JAIN, A. K. & MEHTA, K. S. 1991. Control water hardness to minimize colour matching variations. ATIRA Communication on Textiles, 25, 105-111.
KAN, C. W. 2008. Influence of water hardness on acid dyeing with silk. Fibers and Polymers, 9, 317-322.
KAPFENSTEINER, C. & AZHAR, M. 2017. Water Efficiency in the Textile Industry. Faisalabad: Ministry of Textile Industry
KHALIL, E. & SARKAR, J. 2014. Effect of hardness of water on fixation and total wash off percentage of reactive dyes when applied to cellulosic fiber. International Journal of Scientific and Research Publications, 4, 73-76.
KHATRI, A., PEERZADA, M. H., MOHSIN, M. & WHITE, M. 2015. A review on developments in dyeing cotton fabrics with reactive dyes for reducing effluent pollution. Journal of Cleaner Production, 87, 50-57.
KHATRI, Z., MEMON, M. H., KHATRI, A. & TANWARI, A. 2011. Cold Pad-Batch dyeing method for cotton fabric dyeing with reactive dyes using ultrasonic energy. Ultrasonics Sonochemistry, 18, 1301-1307.
LEWIS, D. M. 2014. Developments in the chemistry of reactive dyes and their application processes. Coloration Technology, 130, 382-412.
MONTGOMERY, D. C. 2017. Design and analysis of experiments, New Jersey, John Wiley & Sons.
OZTURK, E. & CINPERI, N. C. 2018. Water efficiency and wastewater reduction in an integrated woolen textile mill. Journal of Cleaner Production, 201, 686-696.
PARK, J. & SHORE, J. 2009. Evolution of right-first-time dyeing production. Coloration Technology, 125, 133-140.
PARTON, K. 1994. Right-first-time dyeing - the dye manufacturer's role. Journal of the Society of Dyers and Colourists, 110, 4-5.
RAHMAN, M., ISLAM, A. & BISWAS, J. 2016. Effects of Water Hardness on Dyeing of Cotton Fabrics with Different Types of Reactive Dyes and Shade Percentages. International Journal of Materials Science and Applications, 5, 254-260.
RASEL, M., AHMED, M. T., HASAN, M., ULLAH, A., ABIR, H. R., HAQUE, K. M. H. & BHUIYAN, M. N. H. 2018. A Sustainable Approach to Meeting the Quality of Product in Textile Dyeing Industry; Right First Time (RFT). American Journal of Chemistry and Material Science, 5, 78-84.
17
SALEEM, F. & AMIN, S. 2017. Study of Cotton Fabric Dyeing by Reactive Dyes in Various Water Hardness Systems. Journal of Chemical Society of Pakistan, 39, 6-10.
SAMPATH, M. R. 2001. Frequently encountered problems in textile wet processing and a diagnostic approach for prevention/solutions. Colourage, 48, 58-62.
SHAH, S. A. S., SYED, A. & SHAIKH, F. M. 2014. Impact of Textile Industry on Pakistan Economy. Romanian Statistical Review Supplement, 62, 43-59.
SHINDE, T., MARATHE, R. & DORUGADE, V. A. 2015. Effect of water hardness on reactive dyeing of cotton. International Journal on Textile Engineering and Processes, 1, 27-34.
TRONCI, A. 2017. Optimization of dyeing fixing process on silk fabrics through DOE analysis. Journal of Natural Fibers, 14, 736-746.
TRONCI, A., ORRÙ, P. F. & BUONADONNA, P. 2018. Product quality and energy consumption optimisation of dyeing fixing process by steaming through DOE analysis: a cotton case study. International Journal of Management and Decision Making, 17, 467-487.
TULLIO, V. 1977. Hard water-tolerant dye solutions.
UDDIN, M. G. & ATIQUZZAMAN, A. S. M. 2014. Estimation of Total Hardness of Bath Water in Knit Dye Houses in Bangladesh and Study of Its Effects. International Journal of Textile Science, 3, 59-63.
18
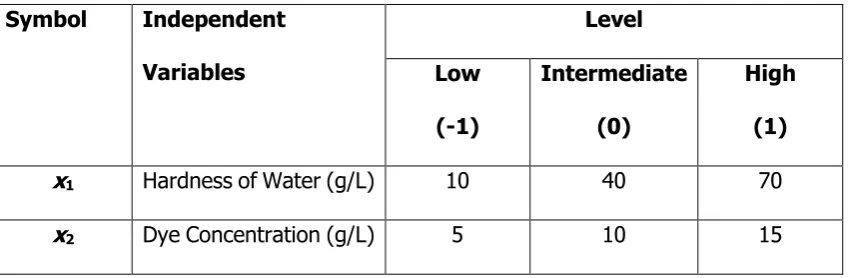
Table 1 Independent Variables and Levels (coded and uncoded) used for 32 Full
Factorial Design
Symbol Independent
Variables
Level
Low
(-1)
Intermediate
(0)
High
(1)
x1 Hardness of Water (g/L) 10 40 70
19
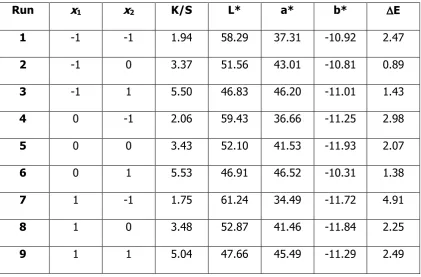
Table 2 32 Full Factorial Design Matrix and Observed Responses
Run x1 x2 K/S L* a* b* E
1 -1 -1 1.94 58.29 37.31 -10.92 2.47
2 -1 0 3.37 51.56 43.01 -10.81 0.89
3 -1 1 5.50 46.83 46.20 -11.01 1.43
4 0 -1 2.06 59.43 36.66 -11.25 2.98
5 0 0 3.43 52.10 41.53 -11.93 2.07
6 0 1 5.53 46.91 46.52 -10.31 1.38
7 1 -1 1.75 61.24 34.49 -11.72 4.91
8 1 0 3.48 52.87 41.46 -11.84 2.25
20
Table 3 Analysis of variance (ANOVA) of the predictive models
Source DF Adj
SS
Adj
MS
F-Value
P
-Value
Adj
SS
Adj
MS
F-Value
P
-Value
Colour Strength (K/S) Lightness (L*) value
Regression 5 17.93 3.59 119.28 0.001a 243.67 48.73 1093.94 0.000a
x1 1 0.05 0.05 1.62 0.292 4.32 4.32 96.93 0.002a
x2 1 17.72 17.72 589.48 0.000a 235.13 235.13 5278.01 0.000a
x12 1 0.05 0.05 1.72 0.281 0.14 0.14 3.07 0.178
x22 1 0.09 0.09 2.97 0.183 2.96 2.96 66.46 0.004a
x1x2 1 0.02 0.02 0.60 0.494 1.12 1.12 25.22 0.015
Error 3 0.09 0.03 0.13 0.05
Total 8
Summary R2 = 0.9950; R2 (adj) = 0.9867 R2 = 0.9995; R2 (adj) = 0.9985
Red/green (a*) Total Colour Difference (E)
Regression 5 154.62 30.92 101.15 0.002a 10.34 2.07 9.57 0.046a
x1 1 4.30 4.30 14.07 0.033a 3.93 3.93 18.20 0.024a
x2 1 147.51 147.51 482.51 0.000a 4.26 4.26 19.71 0.021a
x12 1 0.12 0.12 0.39 0.578 0.14 0.14 0.63 0.485
x22 1 1.58 1.58 5.16 0.108 1.53 1.53 7.09 0.076aa
x1x2 1 1.11 1.11 3.64 0.152 0.48 0.48 2.21 0.234
Error 3 0.92 0.31 0.65 0.22
Total 8
Summary R2 = 0.9941; R2 (adj) = 0.9843 R2 = 0.9410; R2 (adj) = 0.8426
21
Table 4 Statistical parameters of predictive models
Coeffici
ent
K/S L* a* b* E
estim ate p -valu e estim ate p -value estim ate p -value estim ate p -val ue estim ate p -valu e
0 3.533 0.00
0a 52.00 2 0.0 00a 42.16 2 0.0 00a -11.45 8 0.4 84
1.561 0.02
0a
1
-0.090 0.29
2
0.848 0.0
02a -0.847 0.0 33a -0.352 0.1 90
0.810 0.02
4a
2 1.719 0.00
0a
-6.260 0.0
00a
4.958 0.0
00a
0.214 0.3
80
-0.843 0.02
1a
11
-0.161 0.28
1
0.262 0.1
78 -0.243 0.5 78 -0.103 0.7 93
0.261 0.48
5
22 0.211 0.18
3
1.217 0.0
04a
-0.888 0.1
08
0.444 0.3
06
0.875 0.07
6aa
12
-0.067 0.49 4 -0.530 0.0 15
0.528 0.1
52
0.130 0.6
46
-0.345 0.23
4
a significant at p<0.05, aa significant at p<0.1;
0 is intercept; 1 and 2 are linear
regression coefficients for x1 and x2; 11 and 22 are quadratic regression coefficients for