{MS
eurostat
OFICINA ESTADÍSTICA DE LAS COMUNIDADES EUROPEAS
DE EUROPÆISKE FÆLLESSKABERS STATISTISKE KONTOR
STATISTISCHESAMT DER EUROPÄISCHEN GEMEINSCHAFTEN
ΣΤΑΤΙΣΤΙΚΗ ΥΠΗΡΕΣΙΑ ΤΩΝ ΕΥΡΩΠΑΪΚΩΝ ΚΟΙΝΟΤΗΤΩΝ
STATISTICAL OFFICE OF THE EUROPEAN COMMUNITIES
OFFICE STATISTIQUE DES COMMUNAUTÉS EUROPÉENNES
ISTITUTO STATISTICO DELLE COMUNITÀ EUROPEE
BUREAU VOOR DE STATISTIEK DER EUROPESE GEMEENSCHAPPEN
SERVIÇO DE ESTATÍSTICA DAS COMUNIDADES EUROPEIAS
L-2920 Luxembourg - Tél. 43011 - Télex: Comeur Lu 3423
B-1049 Bruxelles, bâtiment Berlaymont, rue de la Loi 200 (bureau de liaison) — Tél. 2351111
Las publicaciones de Eurostat están clasificadas por temas y por series. La clasificación se encuentra al
final de la obra. Para mayor información sobre las publicaciones, rogamos se pongan en contacto con
Eurostat.
Para los pedidos, diríjanse a las oficinas de venta cuyas direcciones f i g u r a n en la página interior de la
contracubierta.
Eurostats publikationer er klassificeret efter emne og serie. En oversigt herover findes bag i hæftet.
Yderligere oplysninger o m publikationerne kan fås ved henvendelse til Eurostat.
Bestilling kan afgives til de salgssteder, der er anført på omslagets side 3.
Die Veröffentlichungen v o n Eurostat sind nach Themenkreisen und Reihen gegliedert. Die Gliederung ist
hinten in jedem Band aufgeführt. Genauere A u s k ü n f t e über die Veröffentlichungen erteilt Eurostat.
Ihre Bestellungen richten Sie bitte an die Verkaufsbüros, deren A n s c h r i f t e n jeweils auf der dritten
Umschlagseite der Veröffentlichungen zu finden sind.
Οι εκδόσεις της Eurostat ταξινομούνται κατά θέμα και κατά σειρά. Η ακριβής ταξινόμηση αναφέρεται στο
τέλος κάθε έκδοσης. Για λεπτομερέστερες πληροφορίες σχετικά με τις εκδόσεις, μπορείτε να απευθύνεσθε
στην Eurostat.
Για τις παραγγελίες μπορείτε να απευθύνεσθε στα γραφεία πώλησης, των οποίων οι διευθύνσεις αναγράφονται
στη σελίδα 3 του εξωφύλλου.
Eurostat's publications are classified according to themes and series. This classification is indicated at the
end of the publication. For more detailed information on publications, contact Eurostat.
Orders are obtainable f r o m the sales offices mentioned on the inside back cover.
Les publications de l'Eurostat sont
classées par thème et par série. Cette classification est précisée à la fin
de l'ouvrage. Pour des informations plus détaillées sur les publications, contactez l'Eurostat.
Pour les commandes, adressez-vous aux bureaux de vente dont les adresses sont indiquées à la page 3
de la couverture.
Le pubblicazioni dell'Eurostat sono classificate per tema e per serie. Tale classificazione è precisata alla
fine dell'opera. Per informazioni più dettagliate sulle pubblicazioni rivolgersi all'Eurostat.
Per eventuali ordinazioni rivolgersi a uno degli uffici di vendita i cui indirizzi figurano nella 3
apagina
della copertina.
De publikaties van Eurostat zijn ingedeeld naar onderwerp en serie. Deze indeling is achter in het boek
opgenomen. Voor nadere informatie over de publikaties kunt u zich wenden tot Eurostat.
Gelieve bestellingen op te geven bij de verkoopbureaus, waarvan de adressen op bladzijde 3 van de
omslag zijn vermeld.
As publicações do Eurostat estão classificadas por tema e por série. Esta classificação está indicada
no f i m da obra. Para mais informações sobre as publicações é favor contactar Eurostat.
This publication is also available in the following language:
FR: ISBN 92-825-7732-5
Cataloguing data Can be found at the end of this publication
Manuscript completed in October 1987
For all information concerning this publication, contact:
A. Ryan — T e l . Luxembourg 4 3 0 1 1 , ext. 4215
Luxembourg: Office for Official Publications of the European Communities, 1987
ISBN 92-825-7731-7
Catalogue number: CA-49-87-793-EN-C
© ECSC-EEC-EAEC, Brussels · Luxembourg, 1987
Reproduction is authorized, except for commercial purposes, provided the source is
acknowledged.
CONTENTS
I. Introduction,
II. Conditions and methods,
1. Scope and Locations 7
2. Standard consumers 8
3. Definition of the price Levels recorded 11
4. Tariff voltage 12
III. Units of vaLue 15
1. The European currency unit (ECU) 15
2. The Purchasing power standard (PPS) 16
3. Prices in "current" PPS and "constant" PPS 16
4. Prices series 17
IV. Taxes 19
1. GeneraL indirect tax 19
2. Specific taxes 20
V. ELectricity prices in the various countries 25
1. FR of Germany 26
2. France 28
3. ItaLy 31
4. Netherlands 33
5. Belgium 35
6. Luxembourg.... 37
7. United Kingdom 39
8. Ireland 42
9. Denmark 44
10. Greece 47
11. Spain 48
12. Portugal 50
SYMBOLS AND ABBREVIATIONS
/
Nil
0
Data less than half the unit used
No data available
%
Per cent
Volt
Kilovolt (= 1 000 V)
Ki Lovoltampere
Kilowatt
Hour
Ki lowatthour
V
kV
kVA
kW
h
kWh
GWh
n
DM
FF
Lit
HFL
BFR
LFR
UK£
IR£
DKR
DR
PTA
ESC
PPS
ECU
Pf
cent
cent
Ρ
Ρ
ére
Gigawatthour (10 kWh)
Number
German mark, Pfenning = 1/100 DM
French franc, Centime
Italian Lira
Dutch guilder, cent
Belgian franc
Luxembourg franc
Pound sterling, penny = 1/100 UK£
Irish pound, penny = 1/100 IR£
Danish crown,
¿re
= 1/100 DKR
Greek drachma
Peseta
Escudo
Purchasing power standard
European currency unit
EUR 12
Total of the member countries of the
European Communities
I. INTRODUCTION
The present publication is a complete updating of the study "Electricity
Prices 1980-1986" published by Eurostat in 1986.
It contains the most recent prices, valid in 1987 together with a time
series going back to 1980.
The text concerning each country has been limited to a description of
recent tariff changes affecting prices in January 1987 and a short
analysis of the results. In some instances reference is made to
"Electricity prices 1980-1986" or "Electricity prices 1980-1985" wherein
a more detailed description of the tariffs may be found and which also
describe the structure of the electricity industry.
II.
CONDITIONS AND METHODS
1. SCOPE AND LOCATIONS
The present study aims to show the actual price of electricity paid by
the consumer in the member countries of the European Community.
The prices are recorded at the beginning of each year based on the
tariffs, contracts, conditions and rules in force at that time.
It is concerned with the actual price paid by the electricity consumer,
corresponding to the invoiced delivery price to the consumer at the
beginning of each year including any eventual rebates and subsidies. Our
consumers are defined as those who purchase electricity for their own
use and exclude those who offer it for resale. We have not considered
the bulk price paid by the electricity distributors.
As regards consumers, the study considers all types of customers
supplied through the public distribution network with low, medium and
high-voltage electricity. In the interests of simplified presentation,
consumers are subdivided into two groups, one for domestic and the other
for industrial users. The survey does not cover certain industrial
consumers :
(i) who themselves produce part of their electrical energy requirement;
(ii) who purchase electricity under special contract terms because of
their exceptionally high power requirements and consumption demand.
These exceptions are mainly steelmaking and chemical enterprises,
enterprises engaged in the production of aluminium and other metals by
electrolysis, railways, etc.
Most of these enterprises consume over 10 million kWh annually. They are
few in number, but nevertheless consume an appreciable part of the total
electrical energy supplied.
The prices were recorded in the following towns or conurbations :
FR of Germany
France
Italy
Netherlands
Belgium
Luxembourg
United Kingdom
Ireland
Denmark
Greece
Spain
Portugal
: Hamburg, Hanover, Düsseldorf, Frankfurt am Main,
Stuttgart, Munich, Western Zone, Southern Zone.
: Lille, Paris, Marseille, Lyon, Toulouse, Strasbourg.
: Northern and central Italy, southern Italy and the
islands.
: Rotterdam (GEB), North Holland (PEN), North Brabant
(PNEM).
: The country as a whole (standard national tariff).
: Grand Duchy (Cegedel).
: London, Glasgow, Leeds, Birmingham.
: Dublin.
: Copenhagen (KB), North Zealand (NESA).
: Athens (standard national tariff).
: Madrid (standard national tariff).
: Lisbon.
Certain towns selected are representative of larger regions which is
indicated in the chapter concerning each country.
2. STANDARD CONSUMERS
The survey is based on the system of standard consumers, i.e. the prices
are recorded for certain levels of electricity consumption and under
certain conditions of supply, chosen as being representative of the
population of electricity consumers. These standard levels of
consumption remain fixed from one year to the next and for all the
countries, this being one of the primary conditions for spatial and
temporal comparability of prices.
Two families of standard consumers are taken
Five domestic standard consumers (supply at low voltage) coded D to D
have been taken :
Annual consumption kWh Approx.
Standard subscribed Standard dwelling
consumer Total (of which night) demand in kW
600
1 200
3 500 (1 300)
7 500 (2 500)
20 000 (15 000)
^ 3
3 - 4
4 - 9
50m 2 rooms+kitchen
70m 3 rooms+kitchen
90m 4 rooms+kitchen
6 - 9 100m 4 rooms+kitchen
> 9 120m 5 rooms+kitchen
As a guideline these standard consumers may be expected to possess the
following household facilities and appliances :
D Lighting, .radio, television, refrigerator, small electric
appliances;
D, as for D plus washing machine or dishwasher;
b a
D D, as for D, with washing machine and dishwasher plus storage water
heater;
D "all-electric" system with water heater and electric central
e
heating operating on a storage basis.
Seven industrial standard consumers (for voltage see point 4) coded I
to I
g
Stand
have
ard
consumer
a
jb
T
c
jd
_ e
been
Ani
taken :
lual
1
2
10
consumption
kWh
30 000
50 000
160 000
250 000
000 000
000 000
Ma
ximum demand
in
2
kW
30
50
100
500
500
500
Annual load
factor h
The maximum demand is the maximum offtake in any quarter of an hour
recorded in one year, expressed in kilowatts (kW). The price of supply
is calculated for cos
V
= 0.9. The annual load factor determines the
regularity of consumer offtake of electricity from the grid during the
year. The longer this time the more even the pattern of consumption
during the 8 760 hours of the year. It indicates the number of hours in
which the consumer would reach his annual consumtion level if the demand
level were permanently equal to maximum demand.
Additional
applied :
details are sometimes needed before the tariffs can be
(i) In the case of tariffs based on half hourly maximum demand, the
maximum demand of the standard consumer is multiplied by a
coefficient of 0.98.
(ii) In the case of tariffs based on a maximum demand expressed in kVA
an adjustment is made by dividing the standard consumer's maximum
demand in kW by the coefficient c o s V
=0.90.
(iii) In the case of tariffs based on maximum demand readings more
frequent than once a year the standing charge is multiplied by
the following coefficients :
Table of power correction coefficients
Standard consumers
Annual load factor
Maximum monthly demand
Maximum two-monthly
demand
Maximum three-monthly
demand
a b
: 1 000h
0,81
0,83
0,86
I
c
1 600h
0,83
0,85
0,88
X
d
2 500h
0,85
0,87
0,90
X
e
Jf
4
000h
0,90
0,91
0,95
\
6 000h
0,96
0,97
0,98
Average of the three
highest values for
max. monthly demand
0,94
0,95
0,96
0,98
0,99
Average of the two
highest values for
max. monthly demand
Annual max. demand
(basic principle)
0,96
1
0,97
1
0,98
1
0,99
1
0,995
1
A harmonized table for consumption during "off-peak" periods has also
been compiled in order to be able to calculate prices when tariffs vary
according to the time of the day (e.g. lower tariff during the night).
Stande
consutr
_
Β
íb
_ c
Id
e
Jf
g
rd
er
Annual
load
factor
h
1 000
1 000
1 600
2 500
4 000
4 000
6 000
Annual
consumption
1 000 kWh
30
50
160
1 250
2 000
10 000
24 000
2
7
ch
7 h
0
0
11
197
438
190
140
Annual
an
to
2
8
consunr
ption (
in 1 000
ged at off-peak rates accorc
the
8 h
0
0
13
225
500
500
160
average dai ly
off-peak peri
9 h
0
0
16
262
580
2 900
9 120
10 h
0
0
19
300
660
3 300
10 080
duration
ode
11 h
0
0
22
338
740
3 700 4
11 040 12
kWh)
ing
of
12 h
0
0
25
375
820
100
000
If off peak rates are charged during other periods, for example all day
Sunday we have only taken one half as supplementary off peak hours.
Such cases are mentioned as they occur in our study.
Account has not been taken of changes in tariff parameters during the
course of a year. In other words no weighted price is calculated for a
year.
3. DEFINITION OF THE PRICE LEVELS RECORDED
All prices are shown per unit of electricity sold, that is per kilowatt
hour (kWh). The results represent the unit price actually paid at the
beginning of each year and take account of the relevant tariff,
parameter, index, etc. applicable as from 1 January. In the case of
tariffs or contracts with short term indices (month, quarter) it is the
index which is in force during January which is applied. This means
that any changes in the tariff structure during the year are not taken
into account, i.e no price weighting is applied to the year. The prices
include meter rental, the standing charge and the commodity rate. They
do not include the initial installation charge to the consumer.
If there are several possible tariffs, it is the tariff which is most
advantageous to the consumer that is taken into account, after the
elimination of the tariffs which are not used in practice or which
apply only to a marginal or negligible number of users.
In the case of a consumer having two separate meters or a switch meter
(e.g. to record night and day consumption), the price reflects total
consumption.
Account has been taken of special tariff or supplementary arrangements
which may exist for reactive power.
Three price levels are shown :
(i) the price net of tax;
(ii) the price excluding VAT but including all other taxes;
(iii) the selling price (inclusive of all taxes).
The price excluding tax is obtained directly from the tariffs or
contracts.
The price excluding VAT includes, where payable, other specific taxes
which is interesting in cases where VAT is deductible.
The price inclusive of all taxes corresponds to the sum paid by the
consumer.
"Taxes" is used here to mean fiscal and para-fiscal levies applying
directly to electricity at the stage of sale at the consumer. These
taxes may be levied at the national, regional, local or municipal
level, etc. by the State, regional or local administrations,
professional associations, etc.
On the other hand, the taxes Levied before the saLe of the electricity,
such as taxes on companies, profits, wages, etc., which are obviously
part of the production or distribution costs, are not calculated
separately. They remain an integral part of the price excluding tax.
The results for each country are shown in national currencies at
current prices, i.e. at face value.
For the purposes of international comparison, it was necessary to use a
representative common monetary unit which would create a minimum of
distortion in both space and time. Accordingly, the present study uses
the purchasing power standard (PPS). The comparative tables are also
shown in European currency units (ECU).
These units of value are explained in the following chapter.
4. TARIFF VOLTAGE
The voltage at which electricity is supplied to the consumer is an
element which may affect the industrial price levels. The higher the
voltage, the lower the price. But in this case, the consumer has to
bear the expense of the electricity transformer (the investment cost or
the rental).
In practice the supply voltages vary according to the grid and the
tariffs. According to our general definitions, the voltage taken into
account is the one at which electricity is commonly supplied to the
consumer.
Where several supply voltages coexist for the same category of users
it is the most representative (greatest number of users) which is
considered.
The table below gives the tariff voltages according to which the
prices for the industrial standard consumers have been calculated.
Voltage applied to industrial standard consumers
kV
Standard consumers
FR of Germany
- Süd Gebiet
- Hamburg, Hannover,
Düsseldorf, Frankfurt
- West Gebiet
Stuttgart, München
France
Italy
Netherlands
- GEB
- PEN
- PNEM
Belgium
Luxembourg
United Kingdom
Ireland
Denmark
Greece
Spain
Portugal
l
a
*b
h
*d
:
e
lf
x
g
0,38
0,38
20
10
10
0,38
0,38
15
/
/
40-130
¿
50
0,38
0,38
10
25
10
10
0,415
10/15
10/15
0,38
0,40
0,38
<
11
65
11
10
</ 10
6,6
"> 1-36
38
10
20
36-7
> 1
¿
60
22
2,5
III.
UNITS OF VALUE
To permit comparisons between countries, prices expressed in national
currencies need to be converted to a common unit. In this study two
common units are used :
(i) the European currency unit (ECU);
(ii) the purchasing power standard (PPS).
1. THE EUROPEAN CURRENCY UNIT (ECU)
The ECU is a basket-type currency unit based on the market exchange rates
of a certain amount of each of the Community currencies, weighted
according to the gross national product and intra-Community trade of each
Member State.
In 1984, this weighting was revised on the accession of Greece and will
remain in force until further notice.
The new composition of the ECU basket is as follows:
DM 0.719 LIT 140 FF 1.31 DKR 0.219 HFL 0.256
IR£ 0.00871 BFR 3.71 UK£ 0.0878 LFR 0.14 DR 1.15.
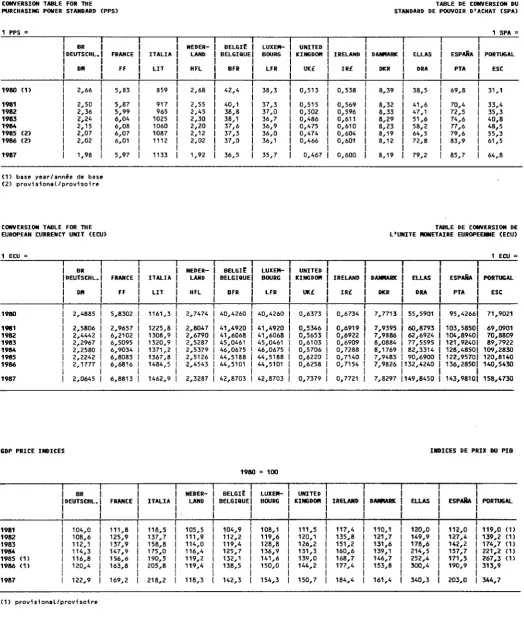
The conversion rates for the ECU against the national currencies in
January of each year are given in a table in the Statistical Annex.
The definition of the ECU is such that it reflects fluctuations in
exchange rates and is suitable for measuring the prices and values of
international flows of goods and services. Data expressed in ECU
therefore permit the comparison of prices in terms of money changed at a
bank. Such currency conversion at the market exchange rates, however, has
the disadvantage that it fluctuates in time under the influence of many
factors which are independent of internal price movements :
(i) capital transfers;
(ii) political decisions;
(iii) regulations;
(iv) speculation;
THE PURCHASING POWER STANDARD (PPS)
The PPS is a reference unit so calculated that its value in relation to
the various national currencies is proportional to the purchasing power
parities (PPP) between these currencies.
The purchasing power parities reflect the ratios between price levels in
the different countries. The ratios between the prices expressed in
national currencies are calculated for each of the products included in
the uses of the GDP. If these ratios are suitably weighted, one obtains
mean price ratios, the most general of which is the mean calculated for
the GDP and known as the PPP at GDP level.
Such parities would be adequate to express all the data in real terms in
the currency of any one of the countries considered. The method ensures
that they are transitive and unaffected by the country chosen as a basis
of reference. For Community calculations another reference unit known as
the PPS is used. It is defined by applying the price ratios to the GDP of
the various countries expressed in national currency and adjusting the
parities so that the value of the GDP of the Community as a whole in 1975
is identical whether expressed in ECU or PPS. Only the proportion
accounted for by each country will be different.
When prices are converted to PPS using the GDP parity, the result may be
interpreted as follows :
If one gigajoule of energy costs 10 PPS in country A and 5 PPS in country
B, this means that after allowance has been made for the differences
between the general level of prices in the two countries, this gigajoule
of energy is twice as expensive in country A as in country B.
This conclusion is independent of market exchange rates, which are
influenced by factors other than the level of prices (movements of
capital, speculation, interest rates, political decisions, etc.).
The conversion rates for the years covered by the study are given in a
table in the annex. They were revised when the base year was changed.
PRICES IN CURRENT PPS AND CONSTANT PPS
The price surveys required to calculate purchasing power parities are not
carried out every year. The most recent available is that for 1980 an
another is planned for 1985. Since the parities are price ratios,
however, their value for the other years may be estimated by
extrapolation using the movement of the GDP price indices for the various
countries, referred to as the Community average. These are known as
"current parities".
The data can also be converted into base year PPS. If price series
deflated by the GDP price index for each country are expressed in base
year PPS, one obtains an indication of the change in prices for the
product in question in relation to the general level of prices in the
country. The data so calculated can also be compared between countries,
giving the same results in relative terms as will be obtained using
current prices and current PPP, since the latter are extrapolated using
the same indices, namely, the GDP price indices for each country and the
average Community index.
Calculation using deflated PPS is thus carried out as follows :
1. The prices of the time series in current national currency are divided
by one hundredth of the GDP price index of each of the years
concerned;
2. This deflated series is converted to PPS using the conversion factor
of the base year 1980.
PRICE SERIES
In the light of the foregoeing, the results of this survey of Community
prices are given in three forms :
1. a series of current prices in the national currency for each country;
2. a series in current ECU using the conversion rates for January of the
year concerned;
IV. TAXES
In the Community, sales of electricity are subject to a general indirect
tax, value added tax (turnover tax applicable to domestic consumption
only, in Greece up to and including 1986).
Furthermore, specific taxes are Levied in seven countries.
The prices inclusive of all taxes shown in this study comprise all the
taxes mentioned above. In the tables in the annex, the amount of any
specific taxes can be calculated from the difference between the
tax-exclusive and VAT-excLusive price, while the difference between the
total tax-inclusive price and VAT-exclusive price gives the amount of
value-added tax (or turnover tax for Greece) in national currency per
kWh.
1. GENERAL INDIRECT TAX
In general, VAT is calculated and applied to the price exluding VAT but
including any specific taxes, these being part o"f the basis of
assessment. France constitutes an exception since VAT is computed on the
price excluding specific taxes.
The rates are as follows :
Value-added tax on electricity sales
January
FR of Germany
France
ItaLy
(domestic)
Italy
(non-domestic)
Netherlands
Belgium
Luxembourg
United Kingdom
Ireland
Denmark
Greece
Spain
Portugal
1980
13
17,6
6
14
18
16
5
0
0
20,25
8(1)
-**
1981
13
17,6
8
15
18
16
5
0
0
22
8(1)
-~*
1982
13
17,6
8
15
18
17
5
0
0
22
8(1)
-~
1983
13
18,6
8
18
18
17
5
0
0
22
10(1)
-—(% c
1984
14
18,6
8
18
19
17
6
0
0
22
10(1)
-^ .
if price
1985
14
18,6
9
9/18
19
17
6
0
0
22
10(1)
-™"
before
1986
14
18,6
9
9/18
19
17
6
0
0
22
10(1)
12
8
VAT)
1987
14
18,6
9
9/18
In Italy, the new VAT rates depend on the activity; 9 % for extractive
and manufacturing industries, including printing and publishing, and
18 % for other non-domestic activities. In this study 18% has been
applied for simplicity's sake to standard consumers I and I. and 9% to
I -I .
c g
VAT is dedúctile for industrial and commercial consumers registered for
the purposes of value added tax.
2. SPECIFIC TAXES
(a) Federal Republic of Germany
Since 1 January 1975 a compensatory tax (Ausgleichsabgabe) has been
Levied to promote the use of Community coal in power stations, the rates
of which vary according to region :
(% of price before tax)
1980 1981 1982 1983 1984 1985 1986 1987
Hamburg
Hannover
Düsseldorf
Western Zone
Frankfurt/Main
Stuttgart
München
Southern Zone
5.1
4.3
5.3
5.3
4.1
4.0
4.0
4.0
5.1
4.2
5.3
5.3
4.0
4.0
4.0
4.0
4.7
4.0
4.8
4.8
3.8
3.7
3.9
3.9
3.8
3.3
4.0
4.0
3.2
3.1
3.2
3.2
3.9
3.4
4.0
4.0
3.2
3.2
3.2
3.2
3.9
3.4
4.0
4.0
3.3
3.1
3.3
3.3
3.6
3.2
3.7
3.7
3.1
2.9
3.1
3.1
4.9
4.5
5.0
5.0
4.3
3.9
4.3
4.3
Federal average 4.5 4.5 4.2 3.5 3.5 3.5 3.3 4.5
(b) France
The rates and basis for the assessment of municipal and departmental
taxes on electricity supplies were modified by the law of 29 December
1984 though the change only came into effect in March 1985 and affected
prices in our study in January 1986. The basis of assessment is now as
follows :
Subscribed demand
kVA
kW
% of tax
excl. price
Standard
consumers
¿L 36
36250
;> 250
C 32,
32.4225
7 225
80
30
0
D D I
I* I
e
a
α
g
Previously the taxes were applied to 80% of the tax exclusive price for
low voltage supplies (standard consumers D D ) .
a K M
a e
The maximum rate permitted by the law is 12% with however an exception
for Paris. The following table summarises the rate of the municipal and
departmental taxes during the period studied :
%
Locations
Li lie
Pari s
Marsei Lle
Lyon
TouLouse
Strasbourg
(c) Italy
Muni ci
1980/85
8
13.2
8
8
8
""
paL tax
1986/87
8
13.2
8
8
8
™
Depart
1980/85
1
4
2
4
mental tax
1986/87
2
4
4
4
4
Tot
1980/85
9
13.2
12
8
10
4
aL
1986/87
10
13.2
12
12
12
4
Electricity consumption is subject to a State tax. (imposta erariale),
the rates of which have been as follows since 1981
:
LIT/kWh
Region
Domestic
Nondomestic
C
200 OOOkWh/month >200 000 kWh/month
North and centre
1.10
South and islands
0.55
1.10
0.55
0.65
0.325
Certain
types
of
consumption
are
exempt
from
this
tax
Furthermore, at the end of 1982 local taxes were introduced as follows:
(LIT/kWh)
Users
Municipalities Provinces
1983 1984 1985 1986/87 1983 1984 1985 1986/87
Domestic
for the block 10 11 12 13
>75 kWh/month
Non-domestic
<1 OOOkW/month 4 4.5 5 5.5 4 4.5 5 5.5
All these taxes are included in the basis of assessment to VAT.
(d) Denmark
A special government tax on electricity was introduced in April 1977,
the rates of which were as follows :
1.1.80-29. 6.80 8 «Jre/kWh 1.1.83-31.12.85 15.50 «5re/kWh
30.6.80-14. 6.82 12.50 ¿re/kWh 1.1.86-31.12.86 19.00 «Jre/kWh
15.6.82-31.12.82 14.30 ¿re/kWh 1.1.87-... 32.50 «5re/kWh(D
(1) reduced to 29.0 o>e/kWh for consumption in excess of 4 000 kWh/year
for homes with electric heating (D ) .
This tax is included in the assessment to VAT and is deductible in the
same way as VAT.
(e) Greece
From 1984 until 31.12.86 a stamp duty of 1.2 % which is taken into
account in calculating turnover tax was applied to the tax exclusive
selling price of electricity to domestic consumers only.
(f) Spain
Several specific taxes were applied during the period 1980-1985. These
taxes which were abolished on 31.12.85 may be summarised as follows :
Period
1/1980
1/1981
1/1982
1/1983
1/1984
1/1985
Sector
Households
Industry
Households
Industry
Households
Industry
Households
Industry
Households
Industry
Special tax
PTA/kWh
-0.23
0.23
0.27
0.27
0.29
0.29
0.35
0.35
IGTE
%
1.5
5.0
1.5
5.0
1.5
5.0
6
6
6
6
Provincial tax
%
0.075
0.250
0.075
0.250
0.075
0.250
0.3
0.3
0.3
0.3
Municipal tax
%
1.5
1.5
1.5
1.5
1.5
1.5
1.5
1.5
-The three proportional taxes are calculated on the tax exclusive price
and are not cumulative. The IGTE is a general transaction tax. The
municipal tax is a charge for the area occupied by the aerial or
underground lines within the urban conurbations. This tax is not shown
separately from October 1984 onwards. Instead it is taken as a general
cost and included in the tariffs, nevertheless the distributors continue
payment of the tax to the communes. Only consumers within the urban
territory were subject to this tax. A large number of medium and large
industries outside this area were therefore exempt. On average the
effective rate was only 0.8% for industry in general and 0.6% for
industn'y supplied in high voltage (>1kV).
For simplicity in this study we have taken the full rate of the
municipal tax (1.5%) for all domestic and small industrial/commercial
consumers ^ " I ) whilst the other industrial standard consumers (IJ-1 )
were considered to be outside the urban territory.
9From 1 January 1986 the various taxes were replaced by value added tax.
g) Portugal
An inspection tax which is included in the basis of assessment to VAT is
levied at the following rates :
Households Industry
V. ELECTRICITY PRICES IN THE VARIOUS COUNTRIES
1. FR of Germany
2. France
3. Italy
4. Netherlands
5. Belgium
6. Luxembourg
7. United Kingdom
8. Ireland
9. Denmark
10. Greece
11. Spain
F.R. GERMANY
a) Household prices - tariffs
A detailed description of the tariff system may be found in "Electricity
prices 1980-1985".
b) Household prices - analysis
The prices for the 8 cities surveyed are shown in tables 1-4 in annex.
With the exception of Dusseldorf, Western Zone and Stuttgart tax
exclusive prices remained unchanged from January 1986 to January 1987.
However in all regions the compensatory tax (Ausgleichsabgabe) increased
slightly (+1%) whilst VAT remained unchanged resulting in increases of
1-4% in the tax inclusive prices.
The total increase between 1980 and 1987 ranged from 32-60% depending on
the level of consumption and the region with the larger consumers
generally bearing the largest increases. Nevertheless electricity is
more expensive in real terms for all consumers in 1987 than in 1980 as
inflation, as measured by the implicit GDP price index was only 23% in
the same period.
Tariff degressivity, which remains wide has been reduced slightly from
69-76% in 1980 to 67-75% in 1987 (comparison price D /D ) .
a e
The range between extreme prices varies from 9-27% according to the
level of consumption in 1987, being more pronounced for "heating" users
(D ) than for the small consumers (D , D. ) and has grown since 1980.
This is due to the independence of companies to formulate their tariffs
based on costs.
c) Industrial prices - tariffs
"Electricity prices 1980-1985" contains a detailed description of the
tariff system.
d) Industrial prices - analysis
However the total increases since 1980 ranged from 32-54% which in the
light of inflation of only 23% has meant that for many consumers
electricity is twice as expensive in real terms in 1987 than in 1980.
Regional price differences are greater for the small consumers (24%
between extreme prices for I ) than for the large consumers (14% for
I,) and result from the liberty of the distribution companies to
establish their tariffs based on costs.
For international comparison we have chosen Düsseldorf to ensure
harmonization with household prices and other sources of energy (gas
prices for example).
Tariff degressivity has changed Little throughout the period studied
with the standard consumer I paying 42-53% less per kWh than I .
2.
FRANCE
a) Household prices - tariffs
The "blue" tariff introduced after the revision of the tariff system is
still in effect, though it was modified on 16 April 1986 (valid in
January 1987).
Normal tariff
Off peak hours option
Standard Subscribed Standing Commodity Standing Commodity rate
consumers demand charge rate charge
kVA FF/year c/kWh FF/year Peak hours Off peak
hours(2)
O
6
9
12
15
18
24
30
36
(1)
1
1
1
133.92
399.84
769.20
125.60
482.00
838.40
-60.11
Î
I
49169
681.00
1 103.40
551.24
1 999.08
2 446.92
682.44
917.96
153.48
1
3
4
6
(1) small supplies tariff
(2) 8 hours
Standard consumers D , D, and D are charged according to the off peak
hours option.
For more details see Electricity prices 1978-1984, ISBN 92-825-5166-0.
b) Household prices - analysis
The prices for the 6 cities surveyed are given in tables 9-11 in annex.
Tax inclusive prices in Paris have evoLved as follows with minor
differences for the other cities due to different tax rates :
% 1987/1986
% 1987/1980
+35
-1
+ 59
-1
+70
-1
+73
-1
+ 75
-1
c) Industrial prices - tariffs
The tariff system introduced on 15 February 1984 remains in force at
the beginning of 1987 with the following rates introduced on 16 April
1986.
There are three tariffs for professional and industrial uses :
Tariff
Professional
Yellow
Green
Application
Low voLtage
low voltage
med.voltage
4 36kVA
36-250kVA
> 225 kVA
Standard consumers
I
I. , I
Ι ,,Ι ,Ι,,Ι
a
b' c
d' e' f' g
Professional tariff
Standing charge per month
Commodity rate c/kWh
Demand
---kVA
W i t h o u t
W i t h o f f - p e a k
F i r s t b L o c k
uS u r p l u s
O f f - p e a k
Q ¿ Jo f f - p e a k
6 - 2 4
4 1 . 1 6 FF
4 5 . 0 8 FF
5 3 . 0 8
4 9 . 6 9
2 8 . 4 2
+ 1 1 . 1 6 FF/kVA
+ 1 3 . 3 3 FF/kVA
> 24
4 8 . 0 2 FF
6 8 . 6 1 FF
-
4 9 . 6 9
2 8 . 4 2
+ 1 9 . 1 2 FF/kVA
+ 2 1 . 9 6 FF/kVA
(1)
The first block is 25 times the subscribed demand, rounded off in
f ?. units of 3 kVA.In principle, off-peak hours are 22-6 h.
The yellow and green tariffs can be summarised as follows :
Commodity rate c/kWh
Annua I
Load factor
standing
winter
summer
charge
High peak Peak off-peak Peak Off-peak
hours
hours
hours
hours
- YeLLow
FF/kVA
1> 4 000 h
362.64
/
60.40
27.34
17.58
9.76
- Green
FF/kW
> 6 000 h
4 000-6 000 h
1 800-4 000 h
839.72
548.19
345.93
41.71
60.96
106.58
32.64
44.64
54.21
23.16
24.13
25.26
< 1 800 h
111.59
148.60 74.88 33.67
13.25 9.35
16.04 9.49
17.33 10.35
21.36 11.76
Reactive energy penaly = 12.00c/kVarh
Rounded up in multiples of 6 kVA up to 108 kVA and in multiples of
12 kVA thereafter.
The tariff periods are now the same for the yellow and green tariffs.
Summer extends from April to October. The winter peak covers four hours
per day (9-11 h and 18-20 h) from December to February whilst off peak
hours comprise eight hours per day and the whole of Sunday. In order to
calculate prices a complete breakdown between tariff periods is
necessary. The following which results from the average distribution in
France has been applied.
%
Load factor
1 000 h 1 600 h 2 500 h 4 000 h 6 000 h
Winter high peak
Winter peak hours
Winter off-peak hours
Summer peak hours
Summer off-peak hours
/
55.5
-44.5
-§
I
43.38
2.81
50.31
3.50
6.44
30.60
9.28
41.52
12.16
5.17
26.55
12.15
38.68
17.45
4.13
22.38
15.73
34.88
22.87
TOTAL
100
100
100
100
100
d) Industrial prices - analysis
Tables 12 and 13 in annex show the prices for the 6 cities surveyed.
VAT exclusive prices in Paris have evolved as folLows which is typical
of the country as a whole.
% 1987/1986 -1
% 1987/1980 +124
+90
-1
+ 81
-1
+71
-1
+62
-1
+65
-1
+61
-1
ITALY
a) Household prices-tariffs
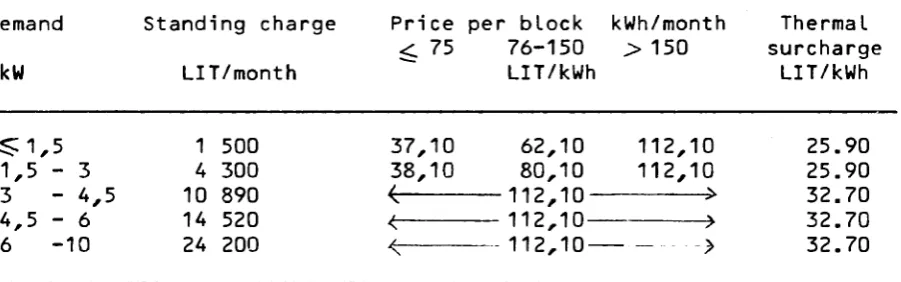
The tariffs in force in January 1987 are as follows
Demand Standing charge
kW LIT/month
P r i c e
<C 75
p e r b l o c k
7 6 - 1 5 0
LIT/kWh
kWh/month
> 150
Thermal
s u r c h a r g e
LIT/kWh
2 > 1 , 5
1,5 - 3
3 - 4 , 5
4 , 5 - 6
6 - 1 0
1 500
4 300
10 890
14 520
24 200
3 7 , 1 0
38,10
<.
<r
<r
62,10
80,10
1 1 2 , 1 0
112,101 112,101 2 , 112,101 0
-1 -1 2 , -1 0
1 1 2 , 1 0
>
2 5 . 9 0
2 5 . 9 0
3 2 . 7 0
3 2 . 7 0
3 2 . 7 0
[image:33.595.63.514.186.327.2]b) Household prices - analysis
Table 14 in annex gives the prices recorded.
The trend of price increases since 1980 was broken during 1986 when
prices feLL by 9-23% between January 1986 and January 1987, due mainly
to the decreases in the thermal surcharge. However the increases
recorded since 1980, ranging from 104-131% were broadly in line with
inflation of 118% in the same period.
The progressive nature of the tariff system leads to a situation where a
large consumer using 7 500 kWh per year (D .) pays twice as much per kWh
as a small consumer using 600 kWh per year TD ) . This combined with the
absence of a night tariff mitigates against the use of electricity for
space heating which is rare and the market accounted for by natural gas
and heating oiL which are more competitively priced. Thus no price is
shown for the standard consumer D .
e
Prices in the south and islands remain slightly lower, solely on account
of the lower treasury tax since tax-exclusive prices are the same
throughout the country because of the standard national tariff. The tax
burden increases with consumption, representing 10 % of the price paid
by a small consumer (D ) and 18% for a Large consumer (D.) in 1987.
a o
c) Industrial prices - tariffs
LIT/kWh
! Medium voltage
Low voltage | 500 kW | 500 kW 3000 h | 500 kW 3000 h
36.60 I 32.70 I 33.20 I 3.10
d) Industrial prices - analysis
The prices are shown in table 15 in annex.
It should be noted that the analysis is based on the price excluding VAT
but including the specific taxes.
Between January 1986 and January 1987 prices fell by 17-23%.
The tariffs are standard over the national territory with the exception
of small non-domestic users whose demand does not exceed 30 kW; a rebate
is accorded to those in the southern zone and the islands. This gives
rise to regional price differences of the order of 19% in 1987. For
other users, the difference between regions is minimal and derives
exclusively from tax abatement.
Increases of 68-173% were experienced between 1980 and 1987 whilst the
implicit gross domestic product price index rose by 118% thus making
electricity more expensive in real terms for the standard consumer I in
1987 than in 1980.
a
4. NETHERLANDS
a) Household prices - tariffs
A detailed description of the tariff system is given in Electricity
prices 1980-1986. The tariffs for small users, valid at the beginning of
1987 are shown below :
Rotterdam North Holland North Brabant
- Standing charge HFL/year
(single meter
(supplement for double meter
- Commodity rate Cents/kWh
(day
(night and off peak
- fuel cost variation Cents/kWh
69.36
47.16
13.2
6.1
6.05
57
33
11.4
4.9
n ;
5.14
67.80
28.20
8.9
4.2
6.2
(
Definition (
(
Supplements to
standing charge
night
off peak
Mon.-Fri.
22h30-8h
Saturday
Sunday
X2
if 3 phase
and >35 A
8h between - 23h30
and - 8h30
2h between - 11h30
and
-
17h15
+ 432HFL/year
if 23,1kVA
(2))
23h-7h
+ 216 HFL/year
if^ 35 A
(1) minimum consumption 600 kWh/year
(2) applied to the "all electric" consumer (D )
b) Household prices - analysis
The prices for the three zones surveyed are shown in tables 16 and 17 in
annex and have evolved as follows :
Rotterdam
North Holland
North Brabant
D. D
b c
D
e I
D
a
The larger decreases/lower increases enjoyed by the larger consumers
have served to increase tariff degressivity. The difference between
extreme prices has risen from 34-52% in 1980 to 45-56% in 1987. Whilst
North Brabant remains the cheapest region the lower decreases in 1986
have narrowed the gap to 18-24% between it and the most expensive.
Electricity
taken into
at 3 020 kWh/year.
in 1987 is cheaper in real terms when inflation of 20% is
account, however the average consumption remains low,
c) Industrial prices - tariffs
A detailed description of the tariff system may be found on pages 49-50
of Electricity prices 1980-1986.
d) Industrial prices - analysis
Tables 18 and 19 show the prices for the three zones surveyed which have
evolved as follows :
Rotterdam !
North Holland|
North Brabant|
I
a
-11
-19
+ 12
% 1987/1986
*b
h
*d
X
e
-15 -20 -22 -25
-20 -26 -31 -35
+13 -12 -14 -15
J
f
-28
-37
-15
*g
-29
-39
-15
X
a
0
+23
+21
X
b
-3
+18
+22
% 1987/1980
Ir
c d e
IH
I
a-12 -3 -3
-11 -18 -23
-3 -5 -6
*f
-7
-27
-6
h
-13
-30
-9
Regional price differences have decreased from 34-53% in 1980 to 18-48%
in 1987, North Brabant being the cheapest with the exception of standard
consumer I .
g
Whilst regional price differences are large so also is
prices between small and large consumers in the same area,
reduction in unit price between a small consumer (I_)
consumer (I )
g
a.
is of the order of 56-66% (tariff degressivity).
the range of
In 1987, the
and a large
5. BELGIUM
a) Household prices tariffs
Following a recommendation by the "Comité de contrôle de l'électricité
et du gaz", lowvoltage tariff standing charges, night and social tariff
commodity rates were lowered from 1 January 1987. A special social
tariff for those of modest means was also introduced. The new values are
as follows :
Tariff
Standing charge
BFR/year
Commodity rate
BFR χ kWh
Normal
Social
Daynight
Exclusive
night
Erasable peak
1
·
2 2 0
^ d b
N
DB
( 1
·
2 2 0
W
6 8 5 > N
D B
685 Ν
685 Ν
DB
DB
1.994
3.620
day
1.994
night 0.775
0.560
0.720
X
ndb
N
DB
+
° ·
6 8 5 N
c
X
ndb
N
DB
+
° ·
6 8 5 N
c
indb
C
+
0563 »<
*ndb
N
DB
+
°
5 6 3 N
c
^ d b
N
DB
+
° ·
6 8 5 N
c
The application of the tariffs and the indices remains as described in
Electricity prices 19801985.
The values of the indices are as follows in January 1987 :
•ndb
1.1440
Ν
DB
1.5900
Ν,
1.2642
[image:37.595.49.529.143.396.2]b) Household prices analysis
Table 20 in annex gives the prices for Brussels which are valid for the
whole country. The tax inclusive price trend has been as follows :
% 1987/1986
I
% 1987/1980
i
- 5
+ 37
- 5
+ 50
- 6
+47
- 6
+45
- 9
+34
c) Industrial prices tariffs
replacement of day/night commodity rates by peak/off peak, the latter
being extended to include Sundays and public holidays;
reduction in off peak commodity rate of two part A tariff;
introduction of a new seasonal tariff, of interest to consumers who
can reduce their demand at peak times.
The two part tariffs can be summarised as follows :
Two part A (motive power)
|
Two part Β
Standing
BFR χ kW χ
Sept.-April 184.6 I ,, Ν
charge
|
month
Hay-Aug.
175.4 I . N
m,
Nov.-Feb.445 I .. DxN-,,.
ndh
DH
Mar.Apr. 356 I ,, D x N
n ur.
,
"dh
DH
Sept.Oct.
[image:38.595.69.546.126.406.2]May-Aug. 312 1 ^ D x N
D HCommodity |BFR χ kWh Peak
| 1.017 I
Ν
+ 0.642 Ν
| 0.367 I
d hN
D H+0.642 N
crate
|
Off peak
0.494 ï" .. N
n u+ 0.542 N°
0.291 ï" ,, N
n u+ 0 . 5 4 2 N°
1
ndh DH
c
'
ndh DH
c
Ceiling
1 BFR
1(1.278+1.017D) I ,, N„„ + 0.642N
ndh DH
c
price
i
|
-Minimum
| BFR
|
3770 Ν /month
ι
ι
""
price
Meter
| BFR/month
single 525 Ν
J
|
double 585 Ν
)H
DH
The application of the tariffs and the definition of the indices remains
unchanged from "Electricity prices 19801985.
The following offpeak consumptions were applied :
kWh
.___d___.
364 500
e
744 500
.3.
29 200
3 722 500
11 092 000
The values of the indices in January 1987 were
X
ndh
1
·
2 3 9 0
N
D H
1.4900
Ν
c
1.2642
d) Industrial prices analysis
Table 21 in annex gives the prices for Brussels which are valid for the
whole country. The VAT exclusive price trend has been as follows :
% 1987/1986 |
4
4
5
7
9
9
% 1987/1980 i +45
+44
+39
+38
+35
+40
a.
8
+47
G.D. LUXEMBOURG
a) Household prices - tariffs
A new two period household uses tariff was introduced on 1 January 1987
which is of interest to consumers using less than 5 000 kWh/year during
the day. The following tariffs were thus applied to our standard
consumers :
Standard
consumer
D D,
a b
D
c
d e
Meter rental
LFR/month
32
100
75
Standing charge
LFR/month
120 X E
B
—
200 X E
B
Commodity
LFR/kWh
2.83 X E
B
8.48 X E
R
2.83 Χ E"
1.41 X E„
2.87 X E
R
1.41 Χ E*
B
rate
Peak *
Day
Night
Day
Night
* Peak = 6h per day between 16.00 and 22.00 from 1 January to 31 March
and 1 October to 31 December.
The value of the index E was 1.390 in January 1987. A non indexed
rebate of 0.108 LFR/kWh applies since January 1986.
b) Household prices - analysis
The prices are given in table 20 in annex.
Between January 1986 and January 1987 prices for all household consumers
rose by 1%. The rebate of 0.108 LFR/kWh was a factor in keeping the
increase below the rate of inflation (4%) during last year.
Tariff degression remains stable, the largest standard consumer
(electrical heating D ) paying one third of the unit price paid by the
smallest CD ) . This degression is very marked, resulting mainly from the
low night prices offered.
c) Industrial prices - tariffs
No changes have been made to the medium and high voltage tariffs since
the publication of "Electricity prices 1978-1984". The values of the
indices were as follows in January 1987 :
E
M1.430 E
H1.465
A non indexed rebate of 0.108 LFR/kWh applies since January 1986.
d) Industrial prices - analysis
The results for the three levels of power reduction are shown in tables
21 and 22 in annex.
Between January 1986 and January 1987 prices rose by 2-3% which
continues the trend since 1984 of increases below the rate of inflation.
Tariff degressivity has increased during the period studied in 1980 a
large consumer (I ) paid 46% less per kWh than a small consumer I which
has increased
9to 61% in 1987.
aOver the period 1980-1987 current VAT exclusive prices rose by 41-145%
depending on the level of consumption and the power reduction. Inflation
registered a 54% increase in the same period, thus for all consumers
with the exception of I electricity is more expensive in constant
terms.
9UNITED KINGDOM
a) Household prices - tariffs
The table below summarises the tariffs for three of the area boards
surveyed introduced in October 1986 and valid in January 1987 :
Area
Standard domestic tariff
Quarterly standing j Unit
charge £ ! rate
jp/kWh
Economy seven tariff
Quarterly standing ! Day | Night
charge £ I ratej rate
I I (ï)
London
Midlands
Yorkshi re
10.00
9.20
9.00
5.75I 1.90
5.70I 1.90
5.77| 1.90
(1) 7 hours per night generally between 24.00 and 08.00, to be specified
by each board
b) Household prices - analysis
The prices for the four area boards surveyed are given in tables 23 and
24 in annex.
Whilst prices in London fell by 1-5% between January 1986 and January
1987 the rises experienced in other areas were below the rate of
inflation (+6%) as the summary below shows :
% 1987/1986
I
% 1987/1980
London
Glasgow
Bi rmingham
Leeds
I - ï
+4
+2
I + 3
-2
+1
+1
+3
-3
+2
0
+1
-4
+1
0
+1
-5
-1
-3
-2
| +67 +63 +57 +55 +54
| +85 +77 +76 +73 +68
I +71 +71 +69 . +62
I +81 +76 +68 . +56
However the total rises since 1980 have exceeded inflation for the
period, as measured by the implicit GDP price index which rose by 51%.
This overall trend may be traced to 1980 as since then price rises have
been in line with or below inflation.
c) Industrial prices - tariffs
Small industrial consumers I and I. (except I. Leeds) supplied in low
voltage are charged according to the following simple tariff :
I
London
Birmingham
Leeds
Quarterly fixed charge
£ |
8.50
First 1000 kWh/quarter p/kWhj
6.68
Balance
p/kWhj
5.72
6.40
7.32
5.52
7.40
7.49
5.61
The maximum demand tariffs shown below apply to larger industrial
consumers I (also I. Leeds) low voltage,
I J ~ I
Qhigh voltage :
London
Birmingham
Leeds
Standing charge
£/month
Availability charge
E/kVA/month
Demand charge
E/kW/aonth Apr.-Oct.
Nov., Feb.
D e c , Jan.
Har.
Energy : day
p/kWh
night p/kWh
Fuel price
adjustment
voll
low
15.00
0 . 9 0
( 1 )0.10
4.10
7.00
1.70
3
'
9 8( 2 )
1.95
V ;0.00035
rage
high
51.00
O.75W
NIL
3.85
6.70
1.50
3.72
1.87
0.00033
voll
low
12.00
0.78
N U
(3)
2·
3 07.09
l d ;NIL
4.06
1.93
0.00035
:age
high
50.00
0.52
NIL
3.86
1.84
0.00033
voll
low
NIL
50 : 0.90
Excess:0.74
N I
b)
6 . 0 0 ^
JNIL
4.34
1.97
0.00035
:age
high
NIL
500 : 0.67
Excess:0.56
N I L
(3)
l·
9 05.95
l J JNIL
4.03
1.87
0.00033
(1)
40 - 100 kVA, multiples of 10 kVA
100 - 250 kVA, "
" 25 kVA
250 - 1000 kVA, »
» 50 kVA
over 1000 kVA, »
■' 100 kVA
(2) supplement £ 0.50/month
(3) £/kVA/month
The unit charge per kWh is increased, or decreased as is the case in
January 1987 by the appropriate amount shown above for each Ip by which
the monthly fuel cost is more or less than 5200 p. Monthly fuel cost is
the cost per tonne of fuel supplied to the CEGB during the month.
As already mentioned above,
standard consumer I.-Leeds is charged
according to the Low voltage maximum demand tariff as the demand exceeds
the Limits of the simple tariff normally applied to small industrial
consumers. A small night consumption (4.375%) has also been considered,
contrary to our standard definitions as this reflects normal practice.
Finally, to calculate the demand charges a breakdown of typical load
patterns is necessary :
Demand
M.D.
factor
Apr
May
Jun
Jul
Aug
Sep
Oct
Nov
Dec
Jan
Feb
Mar
-l b
0.98
76%
90%
100%
98%
90%
I
c
0.98
88%
76%
73%
69%
73%
74%
81%
87%
90%
94%
100%
91%
l
ö
0.98
92%
92%
100%
96%
90%
I
e
0.98
96%
98%
100%
94%
90%
X
f
0.98
96%
98%
100%
94%
90%
I
a
0.98
99%
100%
98%
97%
97%
d) Industrial prices - analysis
The prices for the 4 regions surveyed are shown in tables 25 and 26 in
annex and have evolved as follows :
I
ï.
% 1987/1986
% 1987/1980
London | -6 -6 -1 -2 -2 -2 -2 |
Glasgow i +2 +3 +2 +1 + 1 + 1 0 |
Birmingham! 0 0 - 2 - 2 -3 -3 -4 ¡
Leeds | +2 +3 +1 0 0 0 - 1 !
+32 +59 +43 +42 +43
+64 +75 +76 +73 +62 +64
+31 +56 +59 +61 +63
+66 +64 +58 +57 +56 +54
Despite the fact that prices fell for many consumers or that increases
were below the rate of inflation for others electricity is more
expensive for the majority of consumers in 1987 than in 1980 when
inflation of 51% is considered.
8. IRELAND
a) Household prices - Tariffs
There were two reductions in the normal commodity rate in the past year.
A 5.5% reduction in September 1986 was followed by a 3.2% reduction in
January 1987. The corresponding reductions in the night heating
commodity rate were 13% in April 1986 and 9% in January 1987. There were
no changes in the standing charge.
The prices for Dublin are calculated according to the urban domestic
tariff, the rates of which for January 1987 are shown below :
Standard | Standing charge | Commodity rate p/kWh
consumers I per two-month