ORIGINAL
RESEARCH
Defining Optic Nerve Tortuosity
G.T. Armstrong A.R. Localio T. Feygin L. Bilaniuk P.C. Phillips M.J. Fisher B.L. Strom R. Zimmerman
BACKGROUND AND PURPOSE: Optic nerve tortuosity is one of several nonmalignant abnormalities documented on MR imaging in patients with neurofibromatosis type 1 and may be related to the development of optic pathway gliomas. This study seeks an operational definition for optic nerve tortuosity.
MATERIALS AND METHODS: A focus group of 3 pediatric neuroradiologists reviewed 20 MR images of the brain and orbits of patients suspected to have optic nerve tortuosity in the absence of optic pathway glioma and found 6 radiographic factors that occurred frequently. Subsequently, 28 MR images were assessed for the presence of optic nerve tortuosity, using a global assessment question that reflects a neuroradiologist’s confidence in the presence of optic nerve tortuosity, and for the presence of the 6 radiographic factors, to identify a combination of these factors that best predicted a diagnosis of optic nerve tortuosity.
RESULTS: We found perfect inter-rater agreement between 3 readers on the presence/absence of tortuosity in 75% of cases. Lack of congruity of the optic nerves, in more than 1 coronal section and dilation of the subarachnoid space surrounding the optic nerves, when found together are sensitive (89%) and specific (93%) for a diagnosis of tortuosity on the global scale. The absence of these 2 factors, along with absence of deviation of the optic nerve within the axial plane, provides a reliable test to exclude tortuosity.
CONCLUSION:Lack of congruity of the optic nerves in more than 1 coronal section and dilation of the subarachnoid space surrounding the optic nerves together provide an operational radiographic defini-tion of optic nerve tortuosity.
N
eurofibromatosis type 1 (NF-1) is a common neurocuta-neous disorder that affects approximately 1 in 3000 peo-ple worldwide.1Two of 7 clinical diagnostic criteria, as devel-oped by the National Institutes of Health consensus conference, must be met to make the diagnosis of NF-1 in the absence of genetic documentation of disease.2One of these 7 criteria is the presence of an optic pathway glioma (Fig 1). Optic pathway gliomas are the most common central nervous system (CNS) neoplasm in patients with NF-1 and because of their location, vision loss often occurs. CT of asymptomatic patients with NF-1 has shown the prevalence of optic pathway glioma to be 15%–19% at 4 years of age.3-5Approximately 47% of patients with a known optic pathway glioma will de-velop vision loss.6Optic nerve tortuosity is one of several nonmalignant ab-normalities documented on MR imaging in patients with NF-1.7-10The course of the optic nerve exhibits abnormal curva-ture, but the optic nerve itself is not thickened and does not enhance with gadolinium administration and therefore does not meet diagnostic criteria for optic pathway glioma.11 Pre-vious studies have reported the incidence of optic nerve tortu-osity in patients with NF-1 to be between 12% and 31%.5,11
It is unknown whether optic nerve tortuosity is a precursor to the development of optic pathway gliomas. However, be-fore this question can be answered directly, optic nerve tortu-osity must be objectively defined. This study seeks a case
def-inition of optic nerve tortuosity by relating a global assessment question that reflects a neuroradiologist’s confidence in the presence of optic nerve tortuosity to individual radiographic findings that may predict the presence of optic nerve tortuos-ity. A consistent relationship between the global assessment and individual radiographic findings yields an objective case definition of optic nerve tortuosity.
Materials and Methods
We identified 20 MR images of the brain and orbit between the years 2000 and 2005 that were suspected, based on formal reading, to have tortuosity of the optic nerves in the absence of optic pathway glioma. A focus group, involving 3 pediatric neuroradiologists at a tertiary care pediatric hospital that serves as a national referral site for chil-dren with NF-1, reviewed these MR images. Open-ended questions were posed to encourage the participants to describe individual im-ages and to establish patterns seen across multiple imim-ages in an at-tempt to identify a group of radiographic findings that may define a patient with optic nerve tortuosity.
Using the findings of the focus group, an instrument was de-signed, based on previously validated methods used in assessment of chronic pain, to facilitate evaluation of individual MR images for the presence of optic nerve tortuosity (Appendix).12,13This instrument contained a single global assessment question to determine whether on formal reading the radiologist would document the presence of tortuosity. Answers to the global assessment were recorded on a 5-point Likert scale.14The central item on the scale, “Toss-up,” was described as complete uncertainty in regard to the presence of tortu-osity, with absolute certainty reserved for either pole of the scale. In addition, the instrument contained an assessment of the presence or absence of the findings identified by the focus group to occur regu-larly in cases of optic nerve tortuosity. Using this instrument, 3 neu-roradiologists, blinded to identifying information, evaluated the 20 MR images of the brain and orbits previously suspected to have optic nerve tortuosity. In addition, 8 normal MR images were included to
Received May 22, 2006; accepted after revision July 24.
From the Division of Oncology (G.T.A., P.C.P., M.J.F.) and Department of Radiology (T.F., L.B., R.Z.), Children’s Hospital of Philadelphia, University of Pennsylvania School of Medicine, and the Department of Biostatistics and Epidemiology (G.T.A., A.R.L., B.L.S.), Center for Epidemiology and Biostatistics, University of Pennsylvania School of Medicine, Philadelphia, Pa.
assess the readers’ ability to exclude images with normal optic nerves. We anticipated that 28 cases, read by 3 radiologists, would provide 84 individual assessments for tortuosity and thus an adequate sample size to establish sufficient confidence intervals around the final outcomes.
Descriptive statistics were used to quantify agreement among the neuroradiologists for the global assessment of tortuosity and for the presence/absence of the radiographic findings thought to be signifi-cant in the diagnosis of optic nerve tortuosity. Perfect inter-rater agreement occurred when all 3 radiologists agreed on the presence of an individual item.15Majority inter-rater agreement signified that 2 of 3 agreed on an item. A total score was calculated for each case by indicating the number of radiographic factors that an individual reader determined to be present on an individual case (Appendix). A mean total score was calculated for each case and represented the average number of radiographic factors identified by 3 readers on a single case. Four cases had incomplete image sets, precluding calcu-lation of a mean total score.
Two hypotheses were tested. First, we hypothesized that cases de-fined as “definitely tortuous” or “probably tortuous” on the global assessment would have a higher mean total score, signifying a greater number of the 6 radiographic factors present, than cases defined as “toss-up,” “probably not tortuous,” and “definitely not tortuous.”
Second, we hypothesized that a subset of the 6 radiographic findings would accurately pre-dict a diagnosis of “definitely tortuous” or “probably tortuous” on the global assessment. Using multivariable logistic regression, re-ceiver operating characteristic (ROC) curves were created for all possible combinations of the 6 radiographic factors. The concordance statistic (C statistic) was calculated for each ROC curve, and the sensitivity and specificity of each possible combination used as a test for
the diagnosis of tortuosity was
calculated.16(p63-5)Results were then stratified by combinations of factors, being either all present or all absent. Stratum specific likeli-hood ratios were then used to calculate the odds that a given result would appear in a patient with optic nerve tortuosity, as opposed to a patient without optic nerve tortuosity.17Thus, the combination of factors with the highest likelihood ratio is the test that best rules in a diagnosis of optic nerve tortuosity. Likewise, the combination of fac-tors with the lowest likelihood ratio (less than 1) is the test that best rules out tortuosity. The likelihood of making the correct diagnosis regarding the presence of tortuosity after application of a given set of factors (post-test odds of disease) was calculated by multiplying the likelihood ratio by the pretest odds of disease.
This investigation was performed under the approval of the insti-tutional review boards of Children’s Hospital of Pennsylvania and the University of Pennsylvania. All calculations were performed on Stata, version 9.0 (Stata, College Station, Tex).
Results
Six radiographic findings were determined by the participants of the focus group to occur with regularity (Fig 2) and to be relevant to a final diagnosis of optic nerve tortuosity. All 6 items were included on the global assessment instrument (Appendix).
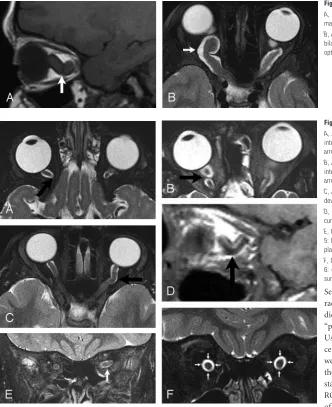
Fig 1.Optic glioma.
A, Sagittal spin-echo image (TR, 643 ms; TE, 12 ms) shows markedly enlarged optic nerve (arrow).
B, Axial fast spin-echo (TR, 6000 ms; TE, 84 ms) image shows bilateral enlargement, along with tortuosity of intraorbital optic nerves (arrow).
Fig 2.Tortuosity of optic nerves
A, Axial fast spin-echo T2-weighted image showing factor 1: interruption of the optic nerve out of the axial plane (tip of arrow) without return.
B, Axial fast spin-echo T2-weighted image showing factor 2: interruption of the optic nerve out of the axial plane (tip of arrow) with return of the nerve into the axial plane.
C, Axial fast spin-echo T2-weighted image showing factor 3: deviation of the optic nerve within the axial plane (arrow).
D, Sagittal T1-weighted image showing factor 4: increased curvature (tip of arrow) in the sagittal plane.
E, Coronal fast spin-echo T2-weighted image showing factor 5: lack of congruity of the optic nerves (arrow) in the coronal plane.
F, Coronal fast spin-echo T2-weighted image showing factor 6: dilation of the subarachnoid space (encircled by arrows) surrounding anterior portion of optic nerves.
PEDIATRICS
ORIGINAL
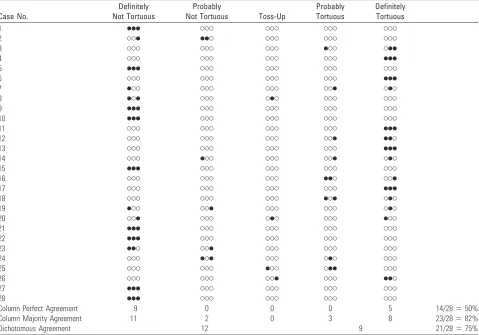
[image:2.585.53.385.42.449.2]Using the single global assessment question from the cre-ated instrument, perfect agreement among the readers on a 5-point Likert scale regarding the presence/absence of optic nerve tortuosity occurred in 14 cases (50%; Table 1). Perfect agreement among radiologists occurred only in the categories “definitely tortuous” and “definitely not tortuous.” Readers were never unanimous on the 3 central items that suggested neutrality or uncertainty. Majority agreement occurred in 23 cases (82%), again with most cases (19) occurring at the poles of the Likert scale, where readers were “definite” about the presence/absence of tortuosity. When the 5-point Likert scale was dichotomized into the more clinically relevant out-come measure of tortuous (“definitely tortuous”⫹“probably tortuous”) versus not tortuous (“definitely not tortuous,” “probably not tortuous,” and “toss-up”), the readers perfectly agree in 75% of the cases. In 4 cases, all 3 readers recorded different readings on the Likert scale, indicating complete disagreement.
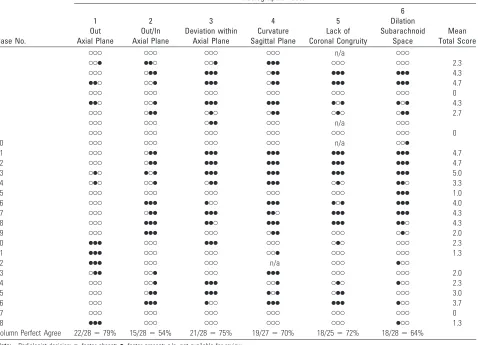
Of the radiographic findings suspected to be components of optic nerve tortuosity, 4 (factors 1, 3, 4, and 5) had at least 70% 3-reader perfect agreement for the presence/absence of the radiographic finding (Table 2). Increased curvature in the sagittal plane (4) was the radiographic finding most com-monly diagnosed (44 times) by the evaluators, followed by factors 3 (40 times), 6 (38 times), 5 (34 times), 2 (33 times), and 1 (24 times).
Four cases had incomplete image sets, which precluded cal-culation of a mean total score. For the 24 cases with a complete set of images, mean total scores ranged between 0 and 5 (Table
2). All cases defined as tortuous (“defi-nitely tortuous”⫹“probably tortuous”; 9 cases) on the global assessment had a mean total score of 4 or greater. All re-maining cases had a mean total score of less than 4. Thus, a cutoff value of 4 for the mean total score (4 of 6 possible radio-graphic items found to be present in a given case) was both 100% sensitive and 100% specific for a diagnosis of tortuosity on the global assessment in this case se-ries. Of the 20 original cases suspected to have tortuosity, 7 were defined as tortu-ous (“definitely tortutortu-ous” ⫹ “probably tortuous”) by the radiologists.
Univariate analysis of the presence of the 6 radiographic factors revealed that dilation of the subarachnoid space sur-rounding the optic nerve (6, odds ratio [OR]⫽29) and lack of congruity of optic nerves on multiple coronal sections (5, OR⫽24) most commonly corresponded with a diagnosis of tortuosity on the global assessment scale (Table 3). Evalua-tion of all possible combinaEvalua-tions of the 6 radiographic factors demonstrated that factors 5 (lack of congruity of the optic nerves across multiple coronal sections) and 6 (dilation of the subarachnoid space surrounding the optic nerve) occurring together are the most sensitive and spe-cific test for detection of an outcome of tortuosity on the global assessment scale (Table 4). Presence of this pair pro-vides the best diagnostic test for ruling in tortuosity (LR⫹ ⫽ 13.3, Table 5). The best test to exclude a diagnosis of optic nerve tortuosity includes additional assessment for radio-graphic factor 3. When radioradio-graphic factors 3, 5, and 6 are all absent, optic nerve tortuosity is excluded in this dataset (LR⫺
⫽0, Table 5). The predictive nature of these items is un-changed when tortuosity is defined to include rather than ex-clude the “toss-up” item on the Likert scale.
Discussion
entity that, before this report, had only been subjectively de-scribed. This definition should reduce interobserver variabil-ity in the diagnosis of optic nerve tortuosvariabil-ity, allowing future assessment of this entity and its relationship to the develop-ment of optic pathway gliomas.
In this study, presence of any 4 of the 6 radiographic factors predicts a diagnosis of tortuosity and less than 4 predicts the absence of optic nerve tortuosity. Evaluation for all 6 factors, however, is cumbersome, because it requires multiple MR im-aging sequences that may not be routinely performed at many institutions. In fact, 4 of our 28 cases (14%) were not complete for evaluation; coronal sequences were the most commonly omitted. Alternatively, lack of congruity of the optic nerves on coronal sequences and the presence of dilation of the sub-arachnoid space (factors 5 and 6) occurring together is ex-tremely sensitive for a diagnosis of optic nerve tortuosity. The likelihood ratio of 13.3 suggests that when these 2 factors are present, the posttest odds of tortuosity are over 13 times higher than the pretest odds of tortuosity with this test result. Thus, if the pretest risk of tortuosity is approximately 20%, as suggested by the literature, and factors 5 and 6 are present, the posttest risk of optic nerve tortuosity is 77%. Therefore, pres-ence of factors 5 and 6 provides increased confidpres-ence in the diagnosis of optic nerve tortuosity.
However, because there is concern that tortuosity may presage tumor growth and vision loss, a screening test should be extremely reliable when it excludes optic nerve tortuosity.
Absence of factor 3 (deviation of the optic nerve within the axial plane) in the context of the absence of factors 5 and 6 provides increased confidence in ruling out optic nerve tortu-osity. In this series, no cases that had absence of these 3 factors were diagnosed with tortuosity (LR⫺ ⫽0). As a result, we recommend that factors 3, 5, and 6 be assessed in all MR im-aging scans obtained to rule out optic nerve tortuosity.
Although factors 3, 5, and 6 (present and absent) provide the ideal screening test for optic nerve tortuosity, coronal sec-tions, necessary for identification of factor 5, were the most commonly omitted sequence in our study and may not be routinely performed in children with NF-1. Therefore, we rec-ommend that all MR imaging series for evaluation of optic nerve tortuosity include coronal sections in addition to axial and sagittal sections and that evaluation include T2-weighted sequences with 2–3-mm cuts through the orbit.
[image:4.585.55.534.58.393.2]An additional concern is the limited agreement among neuroradiologists regarding the presence of dilation of the subarachnoid space surrounding the optic nerve. We hypoth-esize that tortuosity of an optic nerve causes strain on the arachnoid layer of the meninges surrounding the optic nerve, thus creating the potential for enlargement of the subarach-noid space. Our 3 neuroradiologists demonstrated only 64% inter-rater agreement for this entity, raising concern that less experienced radiologists might be even less reliable in their determination of the presence of this entity. However, the presence of dilation of the subarachnoid space surrounding Table 1: 5 item global assessment results by case number for 3 readers
Case No.
Definitely Not Tortuous
Probably
Not Tortuous Toss-Up
Probably Tortuous
Definitely Tortuous
1 ●●● 䡩䡩䡩 䡩䡩䡩 䡩䡩䡩 䡩䡩䡩
2 䡩䡩● ●●䡩 䡩䡩䡩 䡩䡩䡩 䡩䡩䡩
3 䡩䡩䡩 䡩䡩䡩 䡩䡩䡩 ●䡩䡩 䡩●●
4 䡩䡩䡩 䡩䡩䡩 䡩䡩䡩 䡩䡩䡩 ●●●
5 ●●● 䡩䡩䡩 䡩䡩䡩 䡩䡩䡩 䡩䡩䡩
6 䡩䡩䡩 䡩䡩䡩 䡩䡩䡩 䡩䡩䡩 ●●●
7 ●䡩䡩 䡩䡩䡩 䡩䡩䡩 䡩䡩● 䡩●䡩
8 ●䡩● 䡩䡩䡩 䡩●䡩 䡩䡩䡩 䡩䡩䡩
9 ●●● 䡩䡩䡩 䡩䡩䡩 䡩䡩䡩 䡩䡩䡩
10 ●●● 䡩䡩䡩 䡩䡩䡩 䡩䡩䡩 䡩䡩䡩
11 䡩䡩䡩 䡩䡩䡩 䡩䡩䡩 䡩䡩䡩 ●●●
12 䡩䡩䡩 䡩䡩䡩 䡩䡩䡩 䡩䡩● ●●䡩
13 䡩䡩䡩 䡩䡩䡩 䡩䡩䡩 䡩䡩䡩 ●●●
14 䡩䡩䡩 ●䡩䡩 䡩䡩䡩 䡩䡩● 䡩●䡩
15 ●●● 䡩䡩䡩 䡩䡩䡩 䡩䡩䡩 䡩䡩䡩
16 䡩䡩䡩 䡩䡩䡩 䡩䡩䡩 ●●䡩 䡩䡩●
17 䡩䡩䡩 䡩䡩䡩 䡩䡩䡩 䡩䡩䡩 ●●●
18 䡩䡩䡩 䡩䡩䡩 䡩䡩䡩 ●䡩● 䡩●䡩
19 ●䡩䡩 䡩䡩● 䡩䡩䡩 䡩䡩䡩 䡩●䡩
20 䡩䡩● 䡩䡩䡩 䡩●䡩 䡩䡩䡩 ●䡩䡩
21 ●●● 䡩䡩䡩 䡩䡩䡩 䡩䡩䡩 䡩䡩䡩
22 ●●● 䡩䡩䡩 䡩䡩䡩 䡩䡩䡩 䡩䡩䡩
23 ●●䡩 䡩䡩● 䡩䡩䡩 䡩䡩䡩 䡩䡩䡩
24 䡩䡩䡩 ●䡩● 䡩䡩䡩 䡩●䡩 䡩䡩䡩
25 䡩䡩䡩 䡩䡩䡩 ●䡩䡩 䡩●● 䡩䡩䡩
26 䡩䡩䡩 䡩䡩䡩 䡩䡩● 䡩䡩䡩 ●●䡩
27 ●●● 䡩䡩䡩 䡩䡩䡩 䡩䡩䡩 䡩䡩䡩
28 ●●● 䡩䡩䡩 䡩䡩䡩 䡩䡩䡩 䡩䡩䡩
Column Perfect Agreement 9 0 0 0 5 14/28⫽50%
Column Majority Agreement 11 2 0 3 8 23/28⫽82%
Dichotomous Agreement 12 9 21/28⫽75%
the optic nerve remains valid in the prediction of tortuosity despite poor inter-rater agreement, which suggests that any attempt to improve agreement on this item will only increase
its predictive ability. Based on this, further efforts to quantita-tively define dilation of the subarachnoid space in children with NF-1 are necessary.
Conclusion
[image:5.585.57.535.67.412.2]Children with optic nerve tortuosity may be at increased risk of developing tumors of the optic pathway. Thus, it is imper-ative to determine a case definition of optic nerve tortuosity if future evaluation of its relationship to tumor development Table 2: Individual predictors of tortuosity
Case No.
Radiographic Factor
1 Out Axial Plane
2 Out/In Axial Plane
3 Deviation within
Axial Plane
4 Curvature Sagittal Plane
5 Lack of Coronal Congruity
6 Dilation Subarachnoid
Space
Mean Total Score
1 䡩䡩䡩 䡩䡩䡩 䡩䡩䡩 䡩䡩䡩 n/a 䡩䡩䡩
2 䡩䡩● ●●䡩 䡩䡩● ●●● 䡩䡩䡩 䡩䡩䡩 2.3
3 䡩䡩䡩 䡩●● ●●● 䡩●● ●●● ●●● 4.3
4 ●●䡩 䡩䡩● ●●● 䡩●● ●●● ●●● 4.7
5 䡩䡩䡩 䡩䡩䡩 䡩䡩䡩 䡩䡩䡩 䡩䡩䡩 䡩䡩䡩 0
6 ●●䡩 䡩䡩● ●●● ●●● ●䡩● ●䡩● 4.3
7 䡩䡩䡩 䡩●● 䡩●䡩 䡩●● 䡩●䡩 䡩●● 2.7
8 䡩䡩䡩 䡩䡩䡩 䡩●● 䡩䡩䡩 n/a 䡩䡩䡩
9 䡩䡩䡩 䡩䡩䡩 䡩䡩䡩 䡩䡩䡩 䡩䡩䡩 䡩䡩䡩 0
10 䡩䡩䡩 䡩䡩䡩 䡩䡩䡩 䡩䡩䡩 n/a 䡩䡩●
11 䡩䡩䡩 䡩●● ●●● ●●● ●●● ●●● 4.7
12 䡩䡩䡩 䡩●● ●●● ●●● ●●● ●●● 4.7
13 䡩●䡩 ●䡩● ●●● ●●● ●●● ●●● 5.0
14 䡩●䡩 䡩䡩● 䡩●● ●●● 䡩●䡩 ●●䡩 3.3
15 䡩䡩䡩 䡩䡩䡩 䡩䡩䡩 䡩䡩䡩 䡩䡩䡩 ●●● 1.0
16 䡩䡩䡩 ●●● ●䡩䡩 ●●● ●䡩● ●●● 4.0
17 䡩䡩䡩 䡩●● ●●● ●●䡩 ●●● ●●● 4.3
18 䡩䡩䡩 ●●● ●●䡩 ●●● ●●● ●●䡩 4.3
19 䡩䡩䡩 ●●● 䡩䡩䡩 䡩●● 䡩䡩䡩 䡩●䡩 2.0
20 ●●● 䡩䡩䡩 ●●● 䡩䡩䡩 䡩●䡩 䡩䡩䡩 2.3
21 ●●● 䡩䡩䡩 䡩䡩䡩 䡩䡩● 䡩䡩䡩 䡩䡩䡩 1.3
22 ●●● 䡩䡩䡩 䡩䡩䡩 n/a 䡩䡩䡩 ●䡩䡩
23 䡩●● 䡩䡩● 䡩䡩䡩 ●●● 䡩䡩䡩 䡩䡩䡩 2.0
24 䡩䡩䡩 䡩䡩● ●●● 䡩䡩● 䡩●䡩 ●䡩䡩 2.3
25 䡩䡩䡩 䡩●● ●●● ●䡩● 䡩●● 䡩䡩䡩 3.0
26 䡩䡩䡩 ●●● ●䡩䡩 ●●● ●●● ●䡩䡩 3.7
27 䡩䡩䡩 䡩䡩䡩 䡩䡩䡩 䡩䡩䡩 䡩䡩䡩 䡩䡩䡩 0
28 ●●● 䡩䡩䡩 䡩䡩䡩 䡩䡩䡩 䡩䡩䡩 ●䡩䡩 1.3
Column Perfect Agree 22/28⫽79% 15/28⫽54% 21/28⫽75% 19/27⫽70% 18/25⫽72% 18/28⫽64%
[image:5.585.301.533.442.599.2]Note:—Radiologist decision:䡩, factor absent;●, factor present; n/a, not available for review.
Table 3: Univariate analysis of radiographic factors for predicting a diagnosis of tortuosity
Variable
Univariate OR for Prediction of Tortuosity
1 .67 (CI .22–2.1)
2 4.6 (CI 1.7–12.7)
3 14.4 (CI 4.2–49-8)
4 7.9 (CI 2.3–26.6)
5 23.6 (CI 6.5–85.4)
6 28.6 (CI 7.1–114.7)
Note:—OR indicates odds ratio; CI, 95% confidence interval.
Table 4: Radiographic factor combinations that predict a diagnosis of tortuosity
Radiographic Factor Combination
Concordance
Statistic Sensitivity Specificity Factors 5 & 6 .903 89 (CI .79–1) 93 (CI .86–1) Factors 3, 5, & 6 .911 85 (CI .66–1) 93 (CI .86–1) Factors 3 & 6 .898 85 (CI .66–1) 91 (CI .83–.98)
Factor 5 .826 93 (CI .83–1) 80 (CI .64–.94)
Factor 6 .832 93 (CI .83–1) 76 (CI .58–.91)
Factor 3 .780 89 (CI .71–1) 69 (CI .46–.86)
Note:—CI indicates 95% confidence interval.
Table 5: Likelihood ratios of key radiographic factor combinations
Radiographic Factor Combination Likelihood Ratio Factors Present
5 & 6 13.3 (CI 6.4–46.1)
3, 5, & 6 12.7 (CI 6.0–44)
3 & 6 9.6 (CI 4.8–34.2)
5 4.6 (CI 2.3–11.5)
6 3.8 (CI 2.2–9.7)
3 2.8 (CI 1.6–7.1)
Factors Absent
3 .16 (CI 0–.49)
6 .10 (CI 0–.26)
5 .09 (CI 0–2.4)
3 & 6 .07 (CI 0–.27)
5 & 6 .06 (CI 0–.22)
3, 5, & 6 0*
[image:5.585.56.286.453.538.2] [image:5.585.55.286.585.669.2]and vision loss is to occur. In this study, we use an objective, quantitative instrument to demonstrate that dilation of the subarachnoid space surrounding the optic nerve and lack of congruity of the optic nerves across multiple coronal planes provides a reliable case definition of optic nerve tortuosity and identifies a population of patients with NF-1 who should be followed with additional imaging. Coronal images are critical to the diagnosis of tortuosity and should routinely be obtained.
References
1. Littler M, Morton NE.Segregation analysis of peripheral neurofibromatosis (NF1).J Med Genet1990;27:307–10
2. Anonymous.Neurofibromatosis. Conference statement. National Institutes of Health Consensus development conference.Arch Neurol1988;45:575–78 3. Lewis RA, Gerson LP, Axelson KA, et al.von Recklinghausen
neurofibromato-sis. II. Incidence of optic gliomata.Ophthalmology1984;91:929 –35 4. Listernick R, Charrow J, Greenwald M, et al.Natural history of optic pathway
tumors in children with neurofibromatosis type 1: a longitudinal study.J Pe-diatr1994;125:63– 66
5. Listernick R, Charrow J, Greenwald MJ, et al.Optic gliomas in children with neurofibromatosis type 1.J Pediatr1989;114:788 –92
6. Balcer LJ, Liu GT, Heller G, et al.Visual loss in children with neurofibroma-tosis type 1 and optic pathway gliomas: relation to tumor location by mag-netic resonance imaging.Am J Ophthalmol2001;131:442– 45
7. Aoki S, Barkovich AJ, Nishimura K, et al.Neurofibromatosis types 1 and 2: cranial MR findings.Radiology1989;172:527–34
8. Curless RG, Siatkowski M, Glaser JS, et al.MRI diagnosis of NF-1 in children without cafe-au-lait skin lesions.Pediatr Neurol1998;18:269 –71
9. Menor F, Marti-Bonmati L, Arana E, et al.Neurofibromatosis type 1 in children: MR imaging and follow-up studies of central nervous system find-ings.Eur J Radiol1998;26:121–31
10. Raininko R, Thelin L, Eeg-Olofsson O.Non-neoplastic brain abnormalities on MRI in children and adolescents with neurofibromatosis type 1. Neuropediat-rics2001;32:225–30
11. DiMario FJ Jr, Ramsby G, Greenstein R, et al.Neurofibromatosis type 1: mag-netic resonance imaging findings.J Child Neurol1993;8:32–39
12. Farrar JT, Portenoy RK, Berlin JA, et al.Defining the clinically important dif-ference in pain outcome measures.Pain2000;88:287–94
13. Farrar JT, Young JP Jr, LaMoreaux L, et al.Clinical importance of changes in chronic pain intensity measured on an 11-point numerical pain rating scale.
Pain2001;94:149 –58
14. Streiner DL, Norman GR.Scaling responses.In:Health Measurement Scales: A Practical Guide to Their Development and Use.3rd ed. Oxford: Oxford University Press; 2003:29 – 60
15. Streiner DL, Norman GR.Basic concepts.In:Health Measurement Scales: A Practical Guide to Their Development and Use.3rd ed. Oxford: Oxford University Press; 2003:4 –13
16. Rosner B.Probability.In: Rosner B, ed.Fundamentals of Biostatistics, 5th ed. Pacific Grove, Calif: Duxbury Thompson Learning; 2000:45–78
17. Sackett DL, Haynes RB, Guyatt GH, et al.Clinical Epidemiology: A Basic Science for Clinical Medicine, 2nd ed. Boston: Little, Brown and Company; 1991:128 –29 18. Fink A, Kosecoff J, Chassin M, et al.Consensus methods: characteristics and
guidelines for use.Am J Public Health1984;74:979 – 83
19. Holmes GP, Kaplan JE, Gantz NM, et al.Chronic fatigue syndrome: a working case definition.Ann Intern Med1988;108:387– 89