A Framework for Protein-Level
Interpretation of Genetic Associations
and Integration With
Large-Scale DNA Sequencing Analysis
The Harvard community has made this
article openly available.
Please share
how
this access benefits you. Your story matters
Citable link http://nrs.harvard.edu/urn-3:HUL.InstRepos:40046483
Terms of Use This article was downloaded from Harvard University’s DASH repository, and is made available under the terms and conditions applicable to Other Posted Material, as set forth at http://
A framework for protein-level interpretation of genetic associations and integration with large-scale DNA sequencing analysis
A dissertation presented by
Mykyta Artomov to
The Department of Chemistry and Chemical Biology In partial fulfillment of the requirements
for the degree of Doctor of Philosophy
In the subject of Chemistry
Harvard University Cambridge, Massachusetts
Dissertation Advisor: Professor Mark J. Daly Mykyta Artomov
A framework for protein-level interpretation of genetic associations and
integration with large-scale DNA sequencing analysis
Abstract
With recent rapid decrease in exome and genome sequencing price amount of the available sequencing data has dramatically increased. While analysis of common genetic variation has succeeded with GWAS and fine-mapping methodology, systematic large-scale approach to rare protein-coding DNA variation analysis and interpretation is still in its early days. Rare variation, unlike GWAS, enables deep insight into the personalized disease predisposing factors and better understanding of underlying biology and, thus, facilitates potential new drug discoveries. In this thesis, we have focused on developing methods for interpretation of the genetic association results using protein-protein interaction models to aid the prioritization of disease risk genes and provide insights into involved biological pathways.
2,000 samples matched to more than 7,000 controls). We identified common features shared by known cancer predisposing genes and created a strategy for identification of the new cancer driving genes. List of novel candidate genes was created for several cancer phenotypes and some of the candidates were subjected to validation in mouse model successfully proving tumor suppressor activity of the encoded proteins.
Table of Contents
Abstract ... iii
Acknowledgments ... vii
Chapter 1: Introduction ... 1
Linking genetic variation to phenotype ... 2
Architecture of genetic studies ... 3
Protein network analysis ... 8
Summary ... 10
Bibliography ... 13
Chapter 2: Composite model for gene based association tests. A role for genetic susceptibility in sporadic focal segmental glomerulosclerosis ... 15
Abstract ... 16
Introduction ... 17
Results ... 21
Discussion ... 38
Materials and Methods ... 45
Author Contributions ... 50
Bibliography ... 51
Chapter 3: Large-scale exome sequencing data analysis in cancer ... 56
A strategy for large-scale systematic pan-cancer germline rare variation analysis ... 57
Abstract ... 57
Introduction ... 57
Results ... 58
Discussion ... 69
Materials and Methods ... 71
Author contributions ... 75
Bibliography ... 76
Mosaic mutations in blood dna sequence are associated with solid tumor cancers ... 78
Abstract ... 78
Introduction ... 79
Results ... 79
Discussion ... 92
Materials and Methods ... 93
Author contributions ... 99
Bibliography ... 99
Rare variant, gene-based association study of hereditary melanoma using whole exome sequencing ... 101
Abstract ... 101
Introduction ... 102
Results ... 104
Discussion ... 116
Materials and Methods ... 119
Bibliography ... 129
Insight into somatic variation in cancer: gender disparity and mutation burden in metastatic melanoma ... 134
Abstract ... 134
Introduction ... 134
Results ... 135
Materials and Methods ... 141
Author contributions ... 146
Bibliography ... 146
Chapter 4: Statistical framework for biological interpretation and improvement of genetic association studies ... 148
Abstract ... 149
Introduction ... 150
Results ... 153
Discussion ... 160
Author contributions ... 161
Bibliography ... 161
Chapter 5: Discussion ... 163
Summary of results ... 164
Acknowledgments
I am very greatfull to my advisor Mark J. Daly for being a great mentor. My best expectations from my graduate school experience were exceeded dramatically due to Mark accepting me to be a part of his lab. Projects described in this thesis sometimes were not easy to move forward, but his guidance and involvement helped to reach the finish line.
I am also lucky to have tight collaboration with Hensin Tsao and his lab. Hensin, throughout the years of our joint work on melanoma projects was supporting myself and taking all necessary time to make sure that I understand the clinical peculiarities of the cancer genetics.
It was wonderful to be a part of ATGU team. I was fortunate to have amazing colleagues with whom I was sharing the office throughout the time in the graduate school – Elaine Lim, Kaitlin Samocha, Jack Kosmicki and Jackie Goldstein.
Linking genetic variation to phenotype
Human medical genetics studies are focused on finding associations between DNA variation and phenotype. According to central dogma of molecular biology alterations in the protein functions or expression levels that are encoded in DNA are main causes of a phenotype. If a phenotype could be observed due to an alteration of a single gene (and as a result – corresponding protein), such trait is called mendelian. First experimental methods provided very limited information about DNA sequence. Restriction sites in the DNA sequence were used as genetic markers linked to neighboring mutations. Inheritance of such markers could be traced within family. Respectively, markers linked with disease predisposing mutations should segregate with observed phenotype. While finding a disease linked marker is a challenge, it is even more challenging to map marker sequence to a specific location in the genome.
extremely rare2. Majority of diseases are complex – associated with contributions
from multiple genes in combination with environmental factors. Mapping of complex disorder markers within a family is largely impeded because of incomplete penetrance and significantly smaller effect size compared with mendelian traits. This fact promoted methods development for study of genetic markers frequencies in population moving the study design towards case-control approach.
With improvements in sequencing and genotyping technology the list of discovered genetic associations is rapidly expanding. Interpretation of association signals in the scope of disease biology yet remains to be a challenge. Thus, a unified integrative framework reconstructing the trajectory of how a mutation in the DNA sequence affects protein functionality and discovering involved pathways could provide the most valuable information about potential therapeutic target.
Architecture of genetic studies
control groups. General approach is to maximize number of individuals with early onset of severe disease symptoms and family history of a disorder in a case group and minimize in controls3.
Next step is identification of genotypes in both affected and non-affected individuals. Methods, like linkage studies and GWAS were successful in identification of the risk loci, however, they do not have sufficient resolution to highlight individual genes or specific mutations and largely limited to common variation. Success of 1000 genomes4 and HapMap5 projects has contributed important tool for mapping of association signal to a limited set of genes, although not sufficient to identify causal mutations. It is important to mention, that complex disorders usually require great statistical power (i.e. large cohort size) to achieve significant results due to small effect size carried by common variation. Introduction of next generation sequencing methods increased resolution of genetic studies up to individual base pairs. In 2010 this led to the first precise determination of genetic cause of disease of a particular patient. Two mutations in Charcot-Marie-Tooth (CMT) patient were identified in SH3TC2 gene, known cause of CMT. Further sequencing studies showed, that majority of disease associated variants are located in the exome – 1% of DNA sequence that encodes proteins6. Exome sequencing provided cheaper and efficient alternative
problem of association signal mapping to a gene highly challenging in linkage studies is naturally solved due to usage of coding variation for analysis. Though, main advancement brought by next-generation sequencing is ability to study rare variation in population, similarly to common variant analysis in GWAS.
Analysis of rare variation requires more complex approach than GWAS. While individual variants are analyzed in GWAS, contrarily in rare variant studies because of low frequency it is unlikely for any of the individual variants to achieve statistically significant association. Rare variation in a given gene is pooled in case and controls group and burden of alternative alleles is then assessed7.
There are several pitfalls in this approach. First, there is no well-defined threshold for allele frequency to be called “rare”. Commonly used cutoff is 1%, however, frequency of actual causal variation depends on disease genetic profile and prevalence. Second, the stronger effect on the protein functionality is carried by allele the stronger should be selection pressure on the carriers of such alleles. As a consequence frequency of large-effect mutations is expected to be smaller than those with modest effect size. Uniform pooling of rare variants in a gene based association test looses this valuable information.
variable threshold approach does not make implicit assumptions about the relationship between allele frequency and odds ratio, though naturally recovers this property.
However, even in phenotypically relevant genes, many variants will be neutral. Statistical power of rare variant analysis has been even further enhanced with idea of comparing variant distributions between cases and controls8.
Analysis of distribution allows binning of variants into several groups. Variants increasing risk should be more common in cases, protective variants should be more common in controls and neutral ones should be observed in both cohorts at a similar frequency. C-alpha test was developed to detect neutral variation and focus on the most likely functional. While providing sufficient power improvement for rare variation analysis it is not suitable for singletons – variants that are observe only once in the dataset. They do not have a distribution of alleles between cases and controls and in this case C-alpha statistic becomes just a burden test.
Composite approach of common variants GWAS and target sequencing for rare-variation analysis provide more complete information about disease genetics. Genetic studies of Chron’s disease are a great illustration of multi-model association testing9. It is a complex disorder caused by combination of
Chron’s disease were discovered. Completing of allele spectrum in complex disease with targeted rare variation study increases fraction of explained trait heritability.
Identifying type of disease causing variation is critical for most powerful analysis. Numerous variation annotation tools became essential for understanding of the effect carried by a variant. Protein-truncating mutations could carry both loss-of-function effect if found in the beginning of a gene and gain-of-function effect once found in the last exon. However, interpretation of missense variants – resulting in change of a single amino acid, is challenging. As advanced association tests are focusing in identifying and eliminating from analysis likely benign variants, measuring of individual variant functional significance becomes critical. Tools like PolyPhen-210 and SIFT11 use information about protein structure and amino acid conservation to predict severity of disruption in protein functionality. Integration of such predictions with expression data enables transcript-specific annotation.
Development of computational tools for joint variant calling (GATK312–14)
missense constrain Z-score demonstrated great agreement with ClinVar and achieved great performance in filtering out likely benign variation16.
Final step is data interpretation. Despite critical importance of understanding biology underlying observed genetic association this step up until recently was left for experimental molecular biology research.
Protein network analysis
With the exponential growth of expression data numerous disease pathways were discovered – DNA reparation in cancer, insulin secretion and TGF-beta signaling pathways in type II diabetes, etc. For newly discovered risk genes of particular interest becomes identification of functional modules, sharing common cellular function beyond the classical disease pathways.
Protein-protein interaction databases are important reference set for building novel disease pathways. Recently, it has become feasible to experimentally map large-scale protein-protein interaction networks. Reliability of the reported interactions is essential component enabling usage of this data as reference for pathway discovery. High-throughput methods of screening aided assembly of large experimentally derived interactomes like BioPlex17. However,
Group of Kasper Lage at performed extensive analysis of the protein-protein interaction data reported in the literature to create as scored interactome. Scores, in this case, represent reliability of the observed interaction and are derived from number of times that interaction was observed in independent experiments. Such approach does not fully eliminate experimental biases and noise, however, it does provide an estimate of the data robustness. Most recent version of the database – InWeb_InBioMap has several fold more interactions more interactions and better biological relevance than comparable resources. Integration of the protein-protein interactions with GTEX database of gene expression data resulted in construction of tissue-specific references that are better powered for interpretation of the biological data18.
It has previously been observed that different genes harboring causal mutations for the same Mendelian disease often physically interact. To evaluate the degree to which this is true of genes within strongly associated loci in complex disease, computational tool DAPPLE was developed19. It was observed that number of direct protein-protein interactions between genes found in genome-wide significant loci is significantly greater than in non-associated loci. However, choice of genes that DAPPLE should be seeded on was chosen subjectively with no formal metric evaluating what threshold for association signal should be used.
problem of finding the best scoring module of nodes from the reference network was proposed. Originally, this method was used for analysis of protein-protein interactions in microarray data. However, further developments were made in the field of metabolomics. Reference pathways and interactions in metabolomics are known at a much better level of confidence than protein-protein interactions. For example, using original Dittrich algorithm, analysis of the metabolic networks identified key modules responsible for polarization of macrophages22. Search algorithm uses p-values of individual instances (genes, metabolites, etc.) to construct node and edge weighted graph. Until emergence of the gene-based association tests mapping of the genetic association signal to an individual genes was limited. Because of this reason network analysis in genetic studies was not widely used up to date.
Summary
Emergence of the large exome and genome sequencing datasets made analysis of the rare variation in population possible. However, lack of methodology for analysis led to quite few successful rare variant association studies up to date. Moreover, in case of identification of a novel risk gene further interpretation and functional credentialing was left for molecular biologist. For this thesis, we wanted to create a systematic pipeline for analysis of the rare coding variation integrating multiple statistical models and create methods for biological interpretation of the observed associations.
protein truncating variants, missense and ultra-rare (filtered with ExAC database allele frequencies) variation for analysis of group of cases with focal segmental glomerulosclerosis. Proof-of-concept analysis was validated using mouse model and confirmed that even with modest size of case and control cohorts composite approach identifies novel susceptibility genes (Chapter 2).
Next, we tested our rare variant association methodology on the large case-control dataset (about 37,000 samples) of germline variation in cancer. Analysis of the multiple phenotypes of both sporadic and genetically selected cases identified common features of variation observed in known cancer risk genes. Specifically, in cutaneous melanoma cohort we identified a novel causal gene and functional testing confirmed its tumor suppressive activity. To fully explore rare causal variation we looked at blood somatic variation in adult-onset cancers and found intriguing association between solid tumor cancer and burden of mosaic protein truncating variants in blood (Chapter 3).
permutation schemes that would test hypotheses of network non-randomness (Chapter 4).
Bibliography
1. Gusella, J. F. et al. A polymorphic DNA marker genetically linked to Huntington’s disease. Nature 306, 234–8
2. Tsui, L. et al. Cystic fibrosis locus defined by a genetically linked polymorphic DNA marker. Science (80-. ). 230, (1985).
3. Zondervan, K. T. & Cardon, L. R. Designing candidate gene and genome-wide case-control association studies. Nat. Protoc. 2, 2492–501 (2007). 4. Consortium, T. 1000 G. P. A global reference for human genetic variation.
Nature 526, 68–74 (2015).
5. Gibbs, R. A. et al. The International HapMap Project. Nature 426, 789–796 (2003).
6. Lupski, J. R. et al. Whole-Genome Sequencing in a Patient with Charcot– Marie–Tooth Neuropathy. N. Engl. J. Med. 362, 1181–1191 (2010). 7. Price, A. L. et al. Pooled association tests for rare variants in
exon-resequencing studies. Am. J. Hum. Genet. 86, 832–8 (2010).
8. Neale, B. M. et al. Testing for an Unusual Distribution of Rare Variants. PLoS Genet. 7, e1001322 (2011).
9. Rivas, M. A. et al. Deep resequencing of GWAS loci identifies independent rare variants associated with inflammatory bowel disease. Nat. Genet. 43, 1066–1073 (2011).
10. Adzhubei, I. A. et al. A method and server for predicting damaging missense mutations. Nat. Methods 7, 248–9 (2010).
11. Ng, P. C. & Henikoff, S. SIFT: Predicting amino acid changes that affect protein function. Nucleic Acids Res. 31, 3812–4 (2003).
12. Van der Auwera, G. A. et al. From FastQ data to high confidence variant calls: the Genome Analysis Toolkit best practices pipeline. Curr. Protoc. Bioinforma. 43, 11.10.1-33 (2013).
1297–303 (2010).
15. Lek, M. et al. Analysis of protein-coding genetic variation in 60,706 humans. Nature 536, 285–291 (2016).
16. Samocha, K. E. et al. A framework for the interpretation of de novo mutation in human disease. Nat Genet 46, 944–950 (2014).
17. Huttlin, E. L. et al. The BioPlex Network: A Systematic Exploration of the Human Interactome. Cell 162, 425–440 (2015).
18. Li, T. et al. A scored human protein–protein interaction network to catalyze genomic interpretation. Nat. Methods 14, 61–64 (2016).
19. Rossin, E. J. et al. Proteins Encoded in Genomic Regions Associated with Immune-Mediated Disease Physically Interact and Suggest Underlying Biology. PLoS Genet. 7, e1001273 (2011).
20. Dittrich, M. T., Klau, G. W., Rosenwald, A., Dandekar, T. & Muller, T. Identifying functional modules in protein-protein interaction networks: an integrated exact approach. Bioinformatics 24, i223–i231 (2008).
21. Beisser, D., Klau, G. W., Dandekar, T., Muller, T. & Dittrich, M. T. BioNet: an R-Package for the functional analysis of biological networks.
Bioinformatics 26, 1129–1130 (2010).
Chapter 2
Composite model for gene based association tests. A role for genetic susceptibility in sporadic focal segmental glomerulosclerosis
Work presented in this chapter was published as:
Abstract
Introduction
The glomerulus of the kidney is a specialized capillary bed that generates an ultrafiltrate that, after modification by the kidney tubule system, becomes urine. Diseases of the glomerulus often lead to chronic kidney disease, a major health care problem affecting between 5% and 10% of the adult population in developed countries1. Treatment options are limited, in part owing to the poor understanding of the pathogenesis of glomerular disease. Better insights into the root cause of this disease will offer hope for improvement of this situation.
unusual cell that covers the outside of the capillary wall and interdigitates with other podocytes to create small slits that allow the passage of fluid and small solutes into the urinary space. It is now clear that podocyte dysfunction is responsible for FSGS as well as other glomerular diseases such as minimal change disease, membranous glomerulopathy, and congenital nephrotic syndrome. Current models suggest that increased podocyte loss is the primary lesion in FSGS2–5.
Over the past 10 years, various genetic approaches have identified mutations in over 20 podocyte genes as causative or leading to increased susceptibility to FSGS6,7. Mutations in these genes, however, explain only a small fraction of familial and sporadic FSGS cases8–10. A larger fraction of cases
may involve non-Mendelian forms of FSGS that could involve variants in multiple genes that interact together to generate susceptibility to podocyte injury and loss. Further gene discovery in oligogenic disease is challenged, however, by the fact that mutations will be distributed across many genes and be difficult to distinguish from numerous neutral gene variants11,12. A greater understanding of
genetic causes of FSGS has the potential to elucidate molecular pathways that are involved in the disease.
arterionephrosclerosis (hypertensive nephropathy) (odds ratio [OR] = 7), FSGS (OR = 17), or HIV-associated nephropathy (OR = 29) in African Americans15,16 and in South Africans (OR = 89)17. Approximately 13% of African Americans carry 2 variant alleles and are at increased risk for chronic kidney disease. These variants by themselves largely explain the increased frequency of FSGS among African Americans. Despite this, the mechanisms by which APOL1 variants cause or predispose individuals to glomerular damage remain unknown. As these variants are absent from individuals lacking any African ancestry, they are not documented to play a role in FSGS susceptibility in individuals of other ancestries.
Here, we used high-throughput sequencing of DNA from FSGS patients of Northern European ancestry to identify genes that are potentially involved in susceptibility to the disease. The challenge of studying the genetics of sporadic FSGS is the possibility that a large number of genes may be involved and the likelihood that each gene contributes only a small amount of risk for the disease. In addition, the relatively low incidence of FSGS in adult and pediatric populations (~5/million/year)1 and the even fewer number of cases that are confirmed by kidney biopsy preclude the assembly of a cohort of the size required for standard genetic approaches like GWAS, whole-genome sequencing, or exome sequencing18. Thus, most genetic studies of FSGS have been family studies.
Results
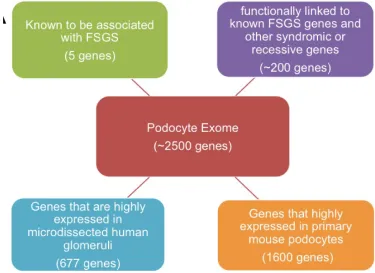
[image:29.612.123.498.203.476.2]We conducted high-throughput DNA-sequencing studies focusing on 2,500 genes (~7 Mb) that are highly expressed in podocytes, reasoning that the genetic susceptibility would be intrinsic to the podocyte (Figure 2.1).
Figure 2.1. 2,500 genes clustered and defined as “podocyte exome”.
We performed sequencing of DNA from 214 patients of European ancestry with biopsy-confirmed FSGS, including 192 patients with sporadic FSGS and 22 with familial FSGS. DNA samples were obtained from patients participating in a multicenter NIH study of biopsy-confirmed FSGS16 and from
patients diagnosed at Washington University. All subjects provided informed consent for the genetic studies. We focused on patients of European ancestry, because a well-characterized control set used for a genetic study of autism but unascertained for kidney disease was available that had a similar genetic ancestry28. A similar control dataset for African or African admixture patients was
not available at the time we performed this sequencing study, which prevented us from including these patients in our analysis.
To validate that our patient sequencing data were comparable to those of our control group, we processed data for both patients and controls in a single batch, with raw data aligned to the human genome29–31. The depth of coverage
was compared between patients and controls, and only those exons covered adequately (>20 times) and similarly in both patients and controls were advanced to the analysis stage. In summary, 16,784 exons and 2,769,942 bp were confidently covered in both patient and control cohorts, resulting in 16,008 SNPs and 1,724 genes analyzed in the final dataset. SNP calls were equally represented in patients and controls.
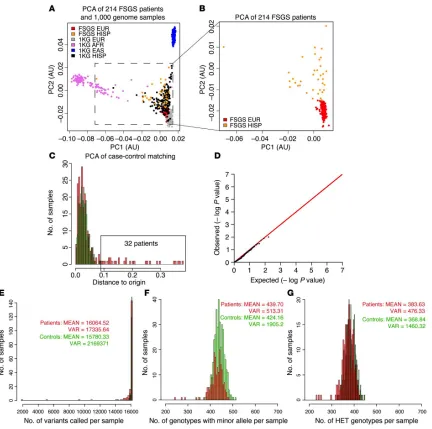
SNPs was less than 95%. The remaining FSGS patients (157 sporadic and 22 familial) had a similar number of SNPs, heterozygous genotypes, and genotypes containing an alternative allele per sample (Figure 2.2, E-G), allowing us to proceed to association analysis.
Figure 2.2. (A) PCA plot of FSGS patients and 1,000 genome samples.
[image:31.612.93.525.179.608.2]Figure 2.2 (Continued) absence of stratification and confirmed the validity and quality of our method for case-control matching. (E) Comparison of the total number of variants per sample showed that patients and controls were similar. (F) Comparison of the total number of heterozygous genotypes showed that patients and controls were similar. (G) Comparison of the total number of heterozygous and homozygous genotypes containing an alternative allele showed that patients and controls were similar. EUR, European; HISP, Hispanic; AFR, African; EAS, East Asian; VAR, variants; HET, heterozygous; PC1, principal component 1; PC2, principal component 2; KG, from 1000 Genomes Database.
Our final dataset contained 179 patients and 378 controls and included 157 sporadic and 22 familial FSGS patients. The accuracy of our analysis strategy was confirmed by resequencing key SNPs using Sanger sequencing and by showing that sequencing the same sample at both the Broad Institute and Washington University gave similar results.
An association test examining single variants (minor allele frequency [MAF] >1%) was performed using Fisher’s exact test. No variants were detected with a P value below the multitest threshold (2x10⁻⁵). The lack of significance is
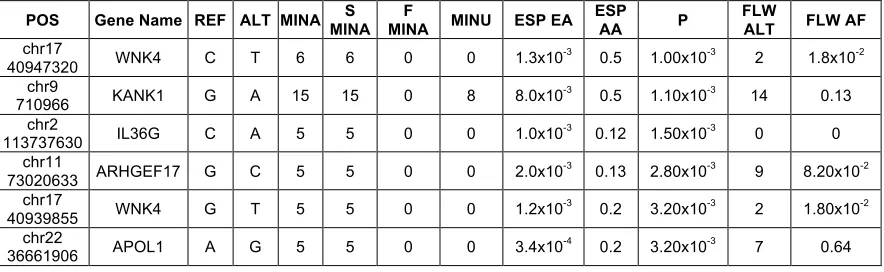
not surprising, given the relatively small size of our sample. This analysis did confirm that the distribution of synonymous and missense variants was similar between patients and controls (Figure 2.2 D). Table 1 shows a list of the 10 highest-scoring variants. All the variants are missense variants. As a follow-up, we analyzed the 32 samples with Hispanic admixture, combined with 23 additional European ancestry samples that were sequenced from the Nephrotic Syndrome Study Network (NEPTUNE) cohort32. This confirmed enrichment of 3
2.1). Interestingly, KANK1 was recently identified as a susceptibility gene for familial nephrotic syndrome33.
Table 2.1. Single variants enriched in patients versus controls and in the
follow-up cohort. POS, chromosome position of the variant; REF, reference allele; ALT, alternative allele; MINA, number of alternative alleles in patients; SMINA, number of alternative alleles in cases with sporadic FSGS; FMINA, number of alternative alleles in cases with familial FSGS; MINU, number of alternative alleles in controls; ESP EA, allele frequencies in European Americans in the NHLBI Exome Sequencing Project; ESP AA, allele frequencies in African Americans in the NHLBI Exome Sequencing Project; P, Fisher’s exact test p-value; FLW ALT, number of alternative alleles in follow-up cohort; FLW AF, allele frequency in the follow-up cohort. The frequency of single variants (MAF>1%) was assessed in patients versus controls and high-scoring variants with odds ratio greater than 2.5 are shown in this table ranked by p-value.
POS Gene Name REF ALT MINA MINA S MINA F MINU ESP EA ESP AA P FLW ALT FLW AF
chr17
40947320 WNK4 C T 6 6 0 0 1.3x10
-3 0.5 1.00x10⁻³ 2 1.8x10⁻²
chr9
710966 KANK1 G A 15 15 0 8 8.0x10
-3 0.5 1.10x10⁻³ 14 0.13
chr2
113737630 IL36G C A 5 5 0 0 1.0x10⁻³ 0.12 1.50x10⁻³ 0 0 chr11
73020633 ARHGEF17 G C 5 5 0 0 2.0x10
-3 0.13 2.80x10⁻³ 9 8.20x10⁻²
chr17
40939855 WNK4 G T 5 5 0 0 1.2x10
-3 0.2 3.20x10⁻³ 2 1.80x10⁻²
chr22
36661906 APOL1 A G 5 5 0 0 3.4x10
-4 0.2 3.20x10⁻³ 7 0.64
[image:33.612.86.528.334.470.2]intermingled with neutral variation (model 2). To discriminate between these 2 models, we analyzed 2 subsets of variants. For the first model, we used the Exome Aggregation Consortium (ExAC)34 browser to identify 5,662 missense and loss-of-function variants in our dataset that are present at a frequency of less than 0.01% in the European population. We then tested the burden of these rare variants in FSGS patients versus controls35. Using this analysis, we found that no
genes reached a level of statistical significance for rare, highly penetrant variants under this model.
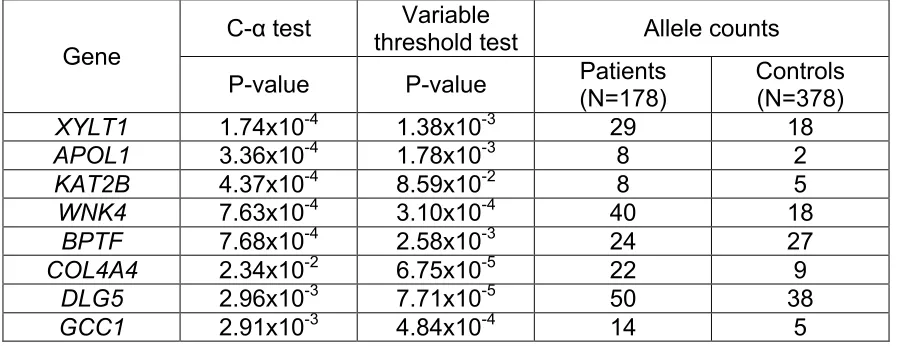
To examine the second model involving low-frequency risk and protective variants, we selected all missense and loss-of-function variants with a MAF of less than 1% and compared their distribution between patients and controls using 2 different rare variant tests: the variable threshold (VT)36 and the C-α test37. Because the effect sizes of variants differ, the accuracy of each method can vary depending on the specific situation. Using a P value of less than 0.05 (Bonferroni-corrected P ≤ 3x10⁻⁵) as a cutoff, no genes were identified that exceeded this value, but 8 genes (WNK4, APOL1, DLG5, GCC1, XYLT1, KAT2B, BPTF, and COL4A4) had P values close to the Bonferroni-corrected
value (P < 6x10⁻⁵ to P < 8x10⁻⁴, Table 2.2). Since the Bonferroni test tends to be conservative and APOL113–15 and COL4A438 are known FSGS genes, we
subset of the same rare variants found in our larger cohort in all of the genes except COL4A4 (Table 2.2), supporting the findings of our rare variant analysis.
Table 2.2. Top genes identified by rare variant analyses. Rare, missense and
nonsense variants (MAF<1%) were pooled for rare variant analysis using variable threshold (VT) and C-α tests. The top genes identified by each test are shown ranked by P-value. Genes with P-values of less than 8x10⁻⁴ were selected
for further analysis.
Gene
C-α test threshold test Variable Allele counts P-value P-value Patients
(N=178)
Controls (N=378)
XYLT1 1.74x10⁻⁴ 1.38x10⁻³ 29 18
APOL1 3.36x10⁻⁴ 1.78x10⁻³ 8 2
KAT2B 4.37x10⁻⁴ 8.59x10⁻² 8 5
WNK4 7.63x10⁻⁴ 3.10x10⁻⁴ 40 18
BPTF 7.68x10⁻⁴ 2.58x10⁻³ 24 27
COL4A4 2.34x10⁻² 6.75x10⁻⁵ 22 9
DLG5 2.96x10⁻³ 7.71x10⁻⁵ 50 38
GCC1 2.91x10⁻³ 4.84x10⁻⁴ 14 5
Since APOL1 and COL4A4 were already known13–15,38, the remainder of
the identified genes (BPTF, DLG5, GCC1, KAT2B, WNK4, and XYLT1) could represent 6 new potential FSGS susceptibility genes. Notably, WNK4 was also identified by single-variant analysis.
[image:35.612.83.532.224.397.2]5,500 Hispanic samples in the ExAC dataset was only 0.5%, this represents significant enrichment, regardless of the Hispanic admixture.
Family studies have identified nearly 30 genes that cause familial FSGS7. To determine whether a set of 20 of these genes are also involved in sporadic FSGS, we assessed the frequencies of predicted damaging, rare coding variants (missense and loss-of-function with a MAF <1%) in these genes in patients and controls. Approximately 36.9% of patients (66 of 179) had at least 1 predicted deleterious rare variant in these 20 genes compared with 3.4% of controls (13 of 378). The distribution of variants between familial and sporadic cases was similar and consistent with previous studies showing that approximately 30% of steroid-resistant nephrotic syndrome patients presenting before the age of 25 have a variant in one of the known disease genes39. There was also a difference in the total number of unique rare variants identified in patients (32.9%, 59 variants in 179 patients) versus controls (3.9%, 15 variants in 378 control subjects). The significance of this finding was tested using a permutation analysis of differences in variants between patients and controls in all potential random groups of 20 genes chosen from our database of 1,724 genes. This showed, however, that 27% of the random sets of 20 genes had a similar or higher burden of rare variants compared with the set of 20 FSGS genes. This suggests that our patient dataset contains additional novel FSGS susceptibility genes with strong genetic effects.
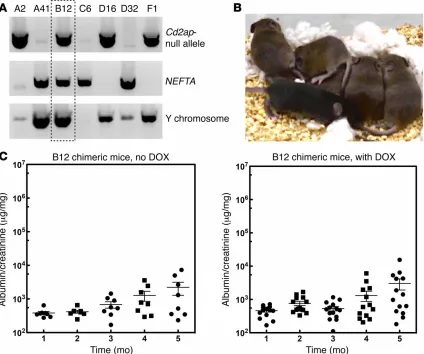
examine the function of candidate genes in vivo. Our strategy involved inhibiting the expression of candidate genes in podocytes from mice on a genetic background that is prone to develop FSGS. Mice that are heterozygous for 2 podocyte genes, Cd2ap and Synpo, develop FSGS with an incomplete penetrance (~25%–50%) and significant albuminuria occurring at about 6 months of age43. Assuming that FSGS is an oligogenic disease, we reasoned that
knocking down a bona fide disease gene in this background would accelerate disease onset.
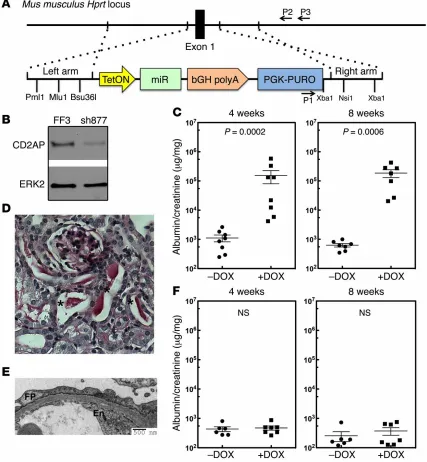
To eliminate variability introduced by random integration of an RNAi transgene, we targeted a single copy of the RNAi transgene into the mouse Hprt1 locus46 that allows the use of 6-thioguanine for efficient selection (Figure
2.4 A).
[image:39.612.92.519.187.649.2]Figure 2.4 (Continued) or sh877. Panel B represents multiple experiments (n = 3) conducted to test the efficiency of the RNAi. (C) Sixteen mice generated with ES cells with the Cd2ap shRNA that was targeted to the Hprt1 locus were treated with or without DOX, and urine was analyzed by measuring the urine albumin/creatinine ratio at 4 and 8 weeks. (D) Histology from a representative Cd2ap RNAi mouse treated with DOX showing protein casts (indicated with asterisks; n >5). (E) Representative electron microscopic image from a Cd2ap RNAi mouse treated with DOX shows podocyte foot process (FP) effacement. En, endothelial cells (n = 9). (F) Thirteen control mice were generated with a control luciferase RNAi targeted to the Hgprt locus. Mice were treated with (n = 6) or without (n = 7) DOX, and urine was analyzed by measuring the albumin/creatinine ratio at 4 and 8 weeks. A 2-tailed Mann-Whitney U test was used to calculate the P values in C and F. A P value of less than 0.05 was considered statistically significant.
Since CD2AP is an FSGS disease gene47 and knockout (KO) mice
develop severe proteinuria48, we validated our system by generating Cd2ap RNAi mice. Multiple Cd2ap-specific RNAis were tested for their ability to inhibit Cd2ap expression (Figure 2.4 B), and the RNAi showing the greatest inhibition (sh877) was embedded into a miR30 sequence that allows for DOX-inducible expression49. An RNAi for the firefly luciferase gene (FF3) was used as a control.
Half of the founder (F0) animals were treated with DOX at 2 weeks of age to induce shRNA transgene expression. All of the DOX-treated mice developed sustained proteinuria that was over 150-fold higher than that seen in the control animals (Figure 2.4 C). Histological analysis of the kidneys revealed protein casts in the tubules (Figure 2.4 D). Electron microscopic examination of the kidney showed widespread foot process effacement, a marker of proteinuria
(Figure 2.4 E), validating that our RNAi strategy could be used to test candidate
with DOX for 8 weeks (Figure 2.4 F), and no abnormalities were detected by electron microscopy or histology.
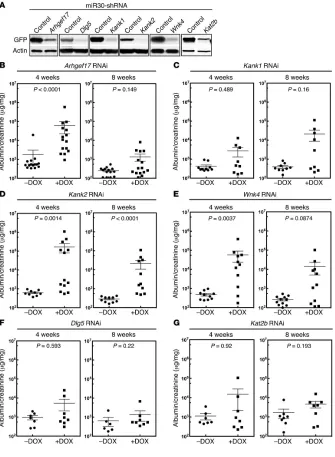
Three of the six genes, WNK4, DLG5, and KAT2B, identified by rare variant analysis were chosen for testing. We also chose the 3 single-variant candidates, KANK1, WNK4, and ARHGEF17. Since WNK4 was present on both lists, a total of 5 genes were selected for analysis. Because the exact mouse ortholog for human KANK1 is unknown, because Kank2 is more highly expressed in mouse podocytes50, and because Kank1 and Kank2 were recently identified as susceptibility genes for nephrotic syndrome, we targeted both Kank1 and Kank2. Multiple shRNAs were generated for the 6 candidate genes. Their efficacy was validated in vitro, and the best one was targeted to the Hprt1 locus
(Figure 2.5 A). Two independent clones for each candidate gene were selected,
and 15–30 mice were generated by laser-assisted microinjection.
Half of each cohort was given DOX, and proteinuria (albumin/creatinine), an indicator of podocyte function, was assessed at 4 and 8 weeks after DOX treatment (Figure 2.5 B–G). All 3 RNAi transgenes, Wnk4, Arhgef17, and Kank2, induced substantial proteinuria, with a level of proteinuria that was significantly higher than that seen in the control mice (Figure 2.5 B–E). In contrast, the Dlg5, Kat2b, and Kank1 RNAi mice did not show statistically significant elevations of
not significant. Thus, Wnk4, Arhgef17, Kank1, and Kank2 mice were positive for proteinuria, while Dlg5 and Kat2b mice were negative for proteinuria.
Figure 2.5. Validation of 5 candidate FSGS disease genes. (A) Validation of
[image:42.612.132.467.155.612.2]Figure 2.5 (Continued) targeted to the Hgprt locus. Essentially pure chimeric mice were generated by laser-assisted microinjection of ES cells into C57BL6 8-cell embryos. Injections generally resulted in cohorts of 14 to 30 animals; smaller cohorts of animals were not used. Mice were divided into 2 groups and treated with or without DOX to induce expression of the RNAi transgene. Urine albumin/creatinine ratios were measured 4 and 8 weeks after DOX treatment. Albumin/creatinine ratios are shown for each cohort of mice at the indicated time points. A 2-tailed Mann-Whitney U test was used to calculate the P values for B– G. A P value of less than 0.0083 was considered statistically significant (multitest penalty was used).
We confirmed the Dlg5 result by obtaining Dlg5-KO mice51 and generating Dlg5, Cd2ap, and Synpo triple-heterozygous mice using conventional breeding.
No kidney dysfunction was detected, confirming our RNAi result. As expected, electron microscopic examination of the kidneys showed podocyte foot process effacement in Arhgef17, Kank1 (12 week-time point), Kank2, and Wnk4 mice, but not in Dlg5 RNAi mice. While the overall morphology was normal, some focal areas of mild foot process effacement could be seen in the Kat2b mice.
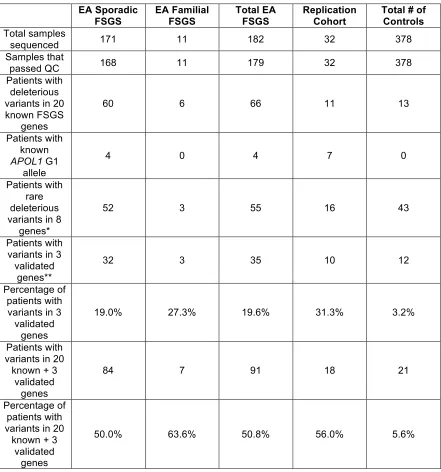
Table 2.3. Variant distribution from sequencing analyses. EA Sporadic
FSGS
EA Familial FSGS
Total EA FSGS
Replication Cohort
Total # of Controls Total samples
sequenced 171 11 182 32 378
Samples that
passed QC 168 11 179 32 378
Patients with deleterious variants in 20 known FSGS
genes
60 6 66 11 13
Patients with known APOL1 G1
allele
4 0 4 7 0
Patients with rare deleterious variants in 8
genes*
52 3 55 16 43
Patients with variants in 3
validated genes**
32 3 35 10 12
Percentage of patients with variants in 3 validated
genes
19.0% 27.3% 19.6% 31.3% 3.2%
Patients with variants in 20 known + 3
validated genes
84 7 91 18 21
Percentage of patients with variants in 20
known + 3 validated
genes
50.0% 63.6% 50.8% 56.0% 5.6%
* - Genes identified by rare variants analyses (Table 2.2).
Discussion
FSGS is a syndrome of diverse etiology that shares a common histologic pattern of focal and segmental glomerular scarring, together with glomerular proteinuria and progressive loss of renal function. The majority of FSGS cases involve primary FSGS, adaptive FSGS, or APOL1 FSGS; less common are viral FSGS, Mendelian FSGS, and medication-associated FSGS. As there are no validated methods to specifically distinguish sporadic (non-familial) FSGS, the present study included subjects with both primary and adaptive FSGS as well as subjects with familial FSGS. Because of the strong predictive power of family history, and because only a small percentage of individuals affected by known etiological factors develop FSGS, the genetic background of the individual is thought to play an important role6.
The critical locus of injury in FSGS is now thought to be the podocyte2, a
terminal-differentiated cell that has limited replication potential52. In the normal kidney, small numbers of podocytes are continuously lost over time4, and when podocyte numbers drop below a critical level, kidney failure inexorably ensues2,5,53. Environmental insults and genetic susceptibility are thought to enhance the rate of podocyte loss, and this increases the probability of developing FSGS. Interpreted this way, the FSGS “lesion” likely represents the common outcome of a wide variety of pathogenetic causes.
the role of mutations in a specific gene may affect only a small number of patients. This substantially increases the challenge of gene identification in any large genetic study. An additional complication is that sporadic FSGS is relatively uncommon, and most patients do not have a biopsy-confirmed diagnosis. This currently precludes the assembly of a large enough cohort for strong statistical analysis. Because of this, most of the FSGS disease genes identified to date are from family studies, from the sequencing of candidate genes based on the phenotype of mouse models, or from admixture linkage studies of African Americans15,19–23,25,47,54–57.
podocytes allowed us to focus on higher-likelihood genes and minimized the multitest penalty.
Genetic analysis of FSGS is challenging because of the potentially broad genetic heterogeneity of the disease and the relatively small number of subjects available for analysis when the subjects’ ancestry needs to be controlled. Rare variant analysis in ethnically admixed populations such as those found in the United States will require new statistical approaches and the development of large, ancestrally matched control datasets. Nonetheless, our work shows that current statistical approaches, combined with focused sequence analysis, can identify candidate genes from a relatively small sample for a syndrome like FSGS that has widely divergent etiologies. While our sample size was sufficient to extract a list of candidate genes using rare variant analysis, a sample size of at least one order of magnitude larger would be necessary to generate statistically significant data for the single variants.
both patients and controls, we were able to eliminate this variable. We validated our approach by establishing a method for case-control genotype matching and removal of any stratification as well as verifying that primary sequencing data from 2 different institutions using the same control DNA sample gave similar results.
Using a P value of less than 0.05, no genes were identified by rare or single-variant analysis that reached genome-wide significance because of Bonferroni’s multiple test correction. Because the Bonferroni test tends to be conservative, we assembled a list of the top 8 genes identified by rare variant analysis and the top 3 genes identified by single-variant analysis with P values that were close to the Bonferroni corrected P value. Supporting the veracity of this analysis, 3 of the genes, APOL1, COL4A4, and KANK1, were already known FSGS susceptibility genes15,16,33,38, and WNK4 was identified on both lists.
samples that we had sequenced subsequent to the original analysis as a confirmatory or follow-up dataset. Our analysis of this second dataset confirmed an increased burden of rare variants in the 6 listed rare variants as well as an increase in 3 common variants (Table 2.1). Since WNK4 was identified by both processes and APOL1, COL4A4, and KANK1 are known genes, at least 7 new candidate genes were identified by our sequencing analysis. While the groups were small, the distribution of variants did not seem to differ significantly between the sporadic and familial FSGS cases.
We were surprised to identify the APOL1 G1 variant in 4 of our subjects and in 7 of the subjects in our follow-up set, as it is rare in non-African populations. The enrichment of this variant in 11 of 208 of our non-African subjects suggests that this particular allele may interact with other variants, leading to susceptibility to FSGS. This is supported by the enrichment of rare, predicted deleterious APOL1 variants in our subjects. The enrichment in our European American subjects with variants that are common in African Americans, but rare in European Americans, was also found in WNK4, KANK1, and ARHGEF17. The absence of neighboring African SNPs suggests that these are ancestral variants and not due to admixture.
Materials and Methods
Sample preparation and sequencing were carried out using standard protocols for targeted capture and Illumina sequencing. In brief, genomic DNA was fragmented to 150 to 200 bp using a Covaris E220 Focused Ultrasonicator. The ends of the fragmented DNA were repaired using a mixture of T4 DNA polymerase, Klenow polymerase, and T4 polynucleotide kinase. Subsequently, adapters for Illumina sequencing were ligated onto the fragments. These libraries were then hybridized to biotinylated DNA probes from regions of interest (manufactured by MyGenostics). After washing away DNA libraries that bound nonspecifically to the probes, DNA of interest was recovered using Dynabeads MyOne Streptavidin T1 (Life Technologies). Resulting DNA libraries were amplified, if needed, for sequencing on an Illumina HiSeq 2500.
genes. The sequencing data were deposited in the NCBI’s Sequence Read Archive (http://www.ncbi.nlm.nih.gov/sra/), under accession number SRP067711.
PCA was performed with Eigenstrat software using the common (MAF >5%) variants found in autosomes only. We computed a Euclidean distance from each point on the PCA plot to the origin and plotted distributions of this parameter for both patients and controls. Using the 3-sigma rule, 30 samples of mixed Hispanic ancestry were identified as outliers and removed from the dataset.
Sample statistics and case-control–matching metrics were computed using PLINK/SEQ analysis software. We used the number of variants called per sample, the number of heterozygous genotypes per sample, and the number of genotypes with minor allele per sample as a metric representing the genetic background of the cohort. The similarity between the genetic background of patients and controls was established by matching the mean and variance of patient and control distributions for every metric. We tested the validity of this approach by running Fisher’s exact test on the common variation and QQ-plot of the P values. This showed no inflation, confirming the absence of any population stratification in the case-control dataset.
Mouse strains. Cd2ap+/– mice were generated previously48. Synpo–/–
mice were obtained from Peter Mundel’s laboratory58. The Nphs1-rtTA3G (NEFTA) strain was a gift from Jeffrey Miner’s laboratory44. The Dlg5+/– mouse
Generation of a male Cd2ap+/–, Synpo+/–, NEFTA+ ES cell line. To
generate a male ES cell line that was sensitized to FSGS, we bred Cd2ap+/– Synpo–/– males with NEFTA+ females. The females were superovulated using
standard methods. After mating, the embryos were isolated at the 8-cell stage (morulae) and cultured overnight in EmbryoMax KSOM medium (MR-121-D; EMD Millipore) microdrops overlaid with mineral oil at 5% CO2 and 37°C. Blastocysts were transferred, 1 per well, into 48-well plates with γ-irradiated mouse embryonic fibroblast (MEF) feeders and standard ES cell media containing 15% ES-qualified FBS (SH30070.03E; Hyclone). The inner cell mass (ICM) was allowed to grow out and was trypsinized after 5 to 7 days, depending on the size and shape of the outgrowth. Cells were cultured until ES colonies were identified. The colonies were expanded and genotyped using standard methods.
Generation of miR30-shRNA knockin transgenic mice. Integration of a
single-copy transgene into the Hprt1 locus using 6-thioguanine was performed as we previously described46 and was modified by the addition of a puromycin
with 6-thioguanine (5 µg/ml) for an additional 48 hours. Surviving ES cell colonies were selected, expanded, and examined by genomic PCR across the right arm (forward primer: 5′-CAAGCCCGGTGCCTGATCTAGATCATAATC-3′; reverse primer: 5′-CTGTAAAGGTCTCTGAACTACCAATTGCAC-3′). Positive ES cells were then stocked for injection.
Laser-assisted microinjection. The ES cells were maintained at the
expansion phase before injection. Eight ES cells were injected into a recipient embryo at the 8-cell stage by following a protocol published previously45. Since the ES cell line produces mice with agouti coat color, albino B6 (C57BL/6J-Tyrc– 2J) mice were used as hosts to allow for direct evaluation of chimerism by coat
color.
Cell culture and lentiviral infection. Immortalized murine podocytes were
maintained and differentiated as described previously25. To examine the knockdown efficiency of CD2AP-sh877, podocytes were infected with lentiviral vectors encoding miR30-sh877. A control lentiviral vector encoding miR30-FF3 that targets firefly luciferase cDNA was used as a control. CD2AP expression was examined by immunoblot analysis of the whole-cell lysates.
Design and validation of the miR30-shRNA constructs for genes of
interest. The shRNA oligo sequences were chosen using an online algorism
the miR30-shRNA construct and its artificial target were cotransfected into HEK293T cells at a molar ratio of 5:1. The expression of EGFP in whole-cell lysates was examined by immunoblot analysis.
Abs. The Abs used for immunoblotting were mouse anti-XFP (632381;
1:10,000 dilution; Clontech); rabbit anti-ERK2 (sc-154; 1:5,000 dilution; Santa Cruz Biotechnology Inc.); mouse anti–β-actin (A2228; 1:10,000 dilution; Sigma-Aldrich); and rabbit anti-CD2AP (generated in our previous study; 1:10,000 dilution).
Albumin-creatinine assay. Mouse urine samples were collected at the time
points indicated in the figures, and urinary albumin (E90-134; Bethyl Laboratories Inc.) and creatinine (DICT-500; BioAssay Systems) were quantified by ELISA according to the manufacturers’ protocols.
Transmission electron microscopy. Portions of kidney cortex were fixed
with 2% paraformaldehyde and 2% glutaraldehyde. Specimen processing, ultrathin sectioning, and imaging were performed by the Electron Microscopy (EM) Core Facility at Washington University.
Study approval. All animal experiments were conducted with the approval
of the Washington University Animal Studies Committee. Because all of the patient samples were deidentified, the Washington University IRB deemed these studies exempt from IRB approval.
Author Contributions
Mykyta Artomov: sequencing data processing, quality-check and analysis,
statistical models development, writing.
Haiyang Yu: conceived general experimental scheme, generated ES cells,
devised the RNAi validation screen and the ES cell-targeting strategy, validation of the candidate genes by testing RNAis, generating ES cells, and phenotyping mice.
Sebastian Brahler: validation of the candidate genes by testing RNAis,
generating ES cells, and phenotyping mice.
Andrey S. Shaw, Robi D. Mitra, M. Christine Stander, Samjay Jain, Ghaidan
Shamsan: piloted and completed methods for exome capture and sequencing.
Metthew G. Sampson, Matthias Kretzler, Jeffrey B. Kopp, Andrey S. Shaw:
determined list of genes to be sequenced.
J. Michael White: generated ES cells, performed laser-assisted microinjection.
Cheryl A. Winkle, Jeffrey B. Kopp, Samjay Jain: provided patient samples and
their selection for this study.
Mark J. Daly: Overall guidance, writing
Andrey S. Shaw: conceived general experimental scheme, overall guidance,
Bibliography
1. D’Agati, V. D., Kaskel, F. J. & Falk, R. J. Focal Segmental Glomerulosclerosis. N.
Engl. J. Med.365, 2398–2411 (2011).
2. Wiggins, R.-C. The spectrum of podocytopathies: A unifying view of
glomerular diseases. Kidney Int.71, 1205–1214 (2007).
3. Wickman, L. et al. Urine Podocyte mRNAs, Proteinuria, and Progression in
Human Glomerular Diseases. J. Am. Soc. Nephrol.24, 2081–2095 (2013).
4. Wharram, B. L. et al. Podocyte Depletion Causes Glomerulosclerosis:
Diphtheria Toxin-Induced Podocyte Depletion in Rats Expressing Human
Diphtheria Toxin Receptor Transgene. J. Am. Soc. Nephrol.16, 2941–2952
(2005).
5. Kim, Y. H. et al. Podocyte depletion and glomerulosclerosis have a direct relationship in the PAN-treated rat. Kidney Int.60, 957–968 (2001).
6. Pollak, M. R. The genetic basis of FSGS and steroid-resistant nephrosis. Semin.
Nephrol.23, 141–146 (2003).
7. Rood, I. M., Deegens, J. K. J. & Wetzels, J. F. M. Genetic causes of focal segmental glomerulosclerosis: implications for clinical practice. Nephrol. Dial.
Transplant.27, 882–890 (2012).
8. Laurin, L.-P. et al. Podocyte-associated gene mutation screening in a heterogeneous cohort of patients with sporadic focal segmental glomerulosclerosis. Nephrol. Dial. Transplant.29, 2062–2069 (2014).
9. Barua, M. et al. Mutations in the INF2 gene account for a significant proportion of familial but not sporadic focal and segmental
glomerulosclerosis. Kidney Int.83, 316–322 (2013).
10. Pollak, M. R. Inherited podocytopathies: FSGS and nephrotic syndrome from a genetic viewpoint. J. Am. Soc. Nephrol.13, 3016–23 (2002).
11. Cirulli, E. T. & Goldstein, D. B. Uncovering the roles of rare variants in common
disease through whole-genome sequencing. Nat. Rev. Genet.11, 415–425
(2010).
14. Friedman, D. J., Kozlitina, J., Genovese, G., Jog, P. & Pollak, M. R.
Population-Based Risk Assessment of APOL1 on Renal Disease. J. Am. Soc. Nephrol.22,
2098–2105 (2011).
15. Genovese, G. et al. Association of Trypanolytic ApoL1 Variants with Kidney Disease in African Americans. Science (80-. ).329, 841–845 (2010).
16. Kopp, J. B. et al. APOL1 Genetic Variants in Focal Segmental
Glomerulosclerosis and HIV-Associated Nephropathy. J. Am. Soc. Nephrol.22,
2129–2137 (2011).
17. Kasembeli, A. N. et al. APOL1 Risk Variants Are Strongly Associated with HIV-Associated Nephropathy in Black South Africans. J. Am. Soc. Nephrol.26,
2882–2890 (2015).
18. Altshuler, D., Daly, M. J. & Lander, E. S. Genetic Mapping in Human Disease.
Science (80-. ).322, 881–888 (2008).
19. Reiser, J. et al. TRPC6 is a glomerular slit diaphragm-associated channel required for normal renal function. Nat. Genet.37, 739–744 (2005).
20. Winn, M. P. et al. A Mutation in the TRPC6 Cation Channel Causes Familial Focal Segmental Glomerulosclerosis. Science (80-. ).308, 1801–1804 (2005).
21. Kaplan, J. M. et al. Mutations in ACTN4, encoding α-actinin-4, cause familial focal segmental glomerulosclerosis. Nat. Genet.24, 251–256 (2000).
22. Brown, E. J. et al. Mutations in the formin gene INF2 cause focal segmental glomerulosclerosis. Nat. Genet.42, 72–76 (2010).
23. Kim, J. M. et al. CD2-Associated Protein Haploinsufficiency Is Linked to Glomerular Disease Susceptibility. Science (80-. ).300, 1298–1300 (2003).
24. Lindenmeyer, M. T. et al. Systematic Analysis of a Novel Human Renal
Glomerulus-Enriched Gene Expression Dataset. PLoS One5, e11545 (2010).
25. Akilesh, S. et al. Arhgap24 inactivates Rac1 in mouse podocytes, and a mutant form is associated with familial focal segmental glomerulosclerosis. J. Clin.
Invest.121, 4127–4137 (2011).
26. Boerries, M. et al. Molecular fingerprinting of the podocyte reveals novel gene
and protein regulatory networks. Kidney Int.83, 1052–1064 (2013).
27. Brunskill, E. W., Georgas, K., Rumballe, B., Little, M. H. & Potter, S. S. Defining
the Molecular Character of the Developing and Adult Kidney Podocyte. PLoS
One6, e24640 (2011).
spectrum disorders. Nature485, 242–245 (2012).
29. Li, H. & Durbin, R. Fast and accurate short read alignment with
Burrows-Wheeler transform. Bioinformatics25, 1754–1760 (2009).
30. DePristo, M. A. et al. A framework for variation discovery and genotyping
using next-generation DNA sequencing data. Nat. Genet.43, 491–8 (2011).
31. Van der Auwera, G. A. et al. From FastQ data to high confidence variant calls: the Genome Analysis Toolkit best practices pipeline. Curr. Protoc. Bioinforma.
43, 11.10.1-33 (2013).
32. Sampson, M. G., Hodgin, J. B. & Kretzler, M. Defining nephrotic syndrome from an integrative genomics perspective. Pediatr. Nephrol.30, 51–63 (2015).
33. Gee, H. Y. et al. KANK deficiency leads to podocyte dysfunction and nephrotic syndrome. J. Clin. Invest.125, 2375–2384 (2015).
34. Lek, M. et al. Analysis of protein-coding genetic variation in 60,706 humans.
Nature536, 285–291 (2016).
35. Li, B. & Leal, S. M. Discovery of Rare Variants via Sequencing: Implications for the Design of Complex Trait Association Studies. PLoS Genet.5, e1000481 (2009).
36. Price, A. L. et al. Pooled association tests for rare variants in exon-resequencing studies. Am. J. Hum. Genet.86, 832–8 (2010).
37. Neale, B. M. et al. Testing for an Unusual Distribution of Rare Variants. PLoS
Genet.7, e1001322 (2011).
38. Voskarides, K. et al. COL4A3/COL4A4 Mutations Producing Focal Segmental
Glomerulosclerosis and Renal Failure in Thin Basement Membrane Nephropathy. J. Am. Soc. Nephrol.18, 3004–3016 (2007).
39. Sadowski, C. E. et al. A Single-Gene Cause in 29.5% of Cases of
Steroid-Resistant Nephrotic Syndrome. J. Am. Soc. Nephrol.26, 1279–1289 (2015).
40. Gee, H. Y. et al. ARHGDIA mutations cause nephrotic syndrome via defective
RHO GTPase signaling. J. Clin. Invest.123, 3243–3253 (2013).
41. Zhou, W. & Hildebrandt, F. Inducible Podocyte Injury and Proteinuria in Transgenic Zebrafish. J. Am. Soc. Nephrol.23, 1039–1047 (2012).
43. Huber, T. B. et al. Bigenic mouse models of focal segmental glomerulosclerosis involving pairwise interaction of CD2AP, Fyn, and synaptopodin. J. Clin. Invest.
116, 1337–1345 (2006).
44. Lin, X., Suh, J. H., Go, G. & Miner, J. H. Feasibility of Repairing Glomerular
Basement Membrane Defects in Alport Syndrome. J. Am. Soc. Nephrol.25,
687–692 (2014).
45. Poueymirou, W. T. et al. F0 generation mice fully derived from gene-targeted
embryonic stem cells allowing immediate phenotypic analyses. Nat.
Biotechnol.25, 91–99 (2007).
46. Yu, H. et al. Rac1 Activation in Podocytes Induces Rapid Foot Process Effacement and Proteinuria. Mol. Cell. Biol.33, 4755–4764 (2013).
47. Löwik, M. M. et al. Focal segmental glomerulosclerosis in a patient
homozygous for a CD2AP mutation. Kidney Int.72, 1198–1203 (2007).
48. Shih, N. Y. et al. Congenital nephrotic syndrome in mice lacking CD2-associated protein. Science286, 312–5 (1999).
49. Stegmeier, F., Hu, G., Rickles, R. J., Hannon, G. J. & Elledge, S. J. A lentiviral microRNA-based system for single-copy polymerase II-regulated RNA interference in mammalian cells. Proc. Natl. Acad. Sci.102, 13212–13217 (2005).
50. Xu, X. et al. Expression of Novel Podocyte-Associated Proteins sult1b1 and
ankrd25. Nephron Exp. Nephrol.117, e39–e46 (2011).
51. Nechiporuk, T., Fernandez, T. E. & Vasioukhin, V. Failure of Epithelial Tube
Maintenance Causes Hydrocephalus and Renal Cysts in Dlg5−/− Mice. Dev.
Cell13, 338–350 (2007).
52. Greka, A. & Mundel, P. Cell Biology and Pathology of Podocytes. Annu. Rev.
Physiol.74, 299–323 (2012).
53. D’Agati, V. D. Podocyte injury in focal segmental glomerulosclerosis: Lessons from animal models (a play in five acts). Kidney Int.73, 399–406 (2008).
54. Antignac, C. et al. NPHS2, encoding the glomerular protein podocin, is mutated in autosomal recessive steroid-resistant nephrotic syndrome. Nat. Genet.24,
349–354 (2000).
55. Gigante, M. et al. CD2AP mutations are associated with sporadic nephrotic
syndrome and focal segmental glomerulosclerosis (FSGS). Nephrol. Dial.
56. Kao, W. H. L. et al. MYH9 is associated with nondiabetic end-stage renal disease in African Americans. Nat. Genet.40, 1185–1192 (2008).
57. Kopp, J. B. et al. MYH9 is a major-effect risk gene for focal segmental glomerulosclerosis. Nat. Genet.40, 1175–1184 (2008).
Chapter 3
Large-scale exome sequencing data analysis in cancer
Work presented in this chapter was published as:
Artomov M., et al. Rare variant, gene-based association study of
hereditary melanoma using whole exome sequencing. Journal of National Cancer Institute.
Accepted.
Gupta S., et al. Gender disparity and mutation burden in metastatic melanoma. JNCI; 107(11); 2015.
Artomov M., et al. Mosaic mutations in blood dna sequence are associated with solid tumor cancers. npj Genomic Medicine.
Accepted
Artomov M., et al. A strategy for large-scale systematic pan-cancer germline rare variation analysis.
A strategy for large-scale systematic pan-cancer germline rare variation
analysis
Abstract
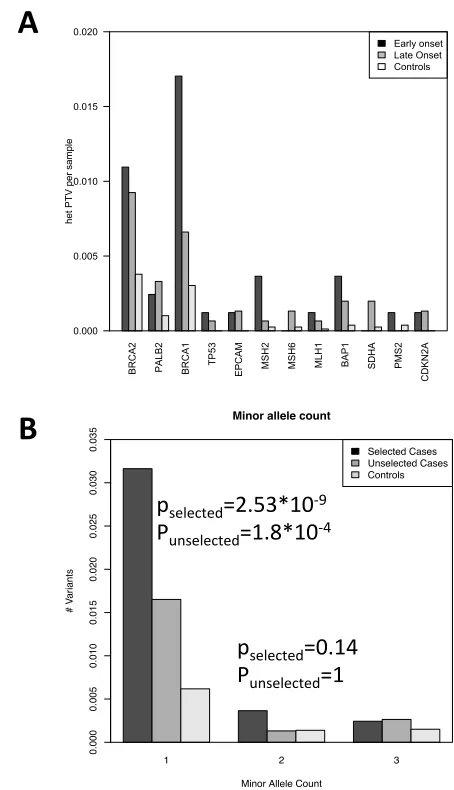
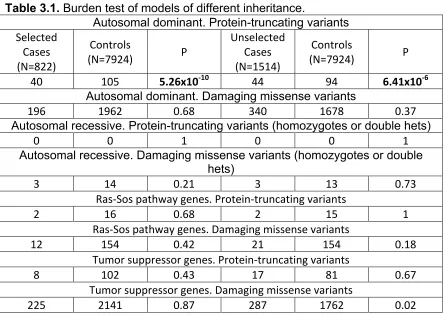
Vast majority of cancer risk genes was identified with tumor-normal tissue comparison. While somatic mutations undoubtedly are the main drivers of the disease onset in sporadic and late-onset cases, patients with early onset and/or familial history of cancer are likely to carry significant inherited risk in their germline DNA. Here we sought to analyze large dataset of genetically enriched cancer cases and unselected cancer cases cohorts with cutaneous and ocular melanoma, colon, breast cancers and identify common features of the risk variation in the germline DNA. We observe that almost entirely statistical signal was driven by singleton protein-truncating variants in the genes tolerant to loss-of-function mutations that followed autosomal dominant inheritance pattern. Interestingly, both unselected and genetically enriched cases show burden of risk variation compared to large pool of matched controls.
Introduction