A Design of Switch Array Antenna with Performance Improvement
for 77 GHz Automotive FMCW Radar
Doo-Soo Kim*, Dong-Hee Hong, Ho-Sang Kwon, and Jin-Mo Yang
Abstract—In this paper, a switch array antenna (SAA) with performance improvement for 77 GHz automotive FMCW radar to detect moving targets and near-field region (NFR) targets is proposed. The SAA generally mitigates hardware complexity, weight and cost, while it has technical difficulties to overcome depending on radar requirements. Firstly, a time-divided transmit by switch array to detect the moving targets causes a phase distortion of echo signals and generates considerably high and periodic side lobes of the SAA beam. In order to suppress side lobes more than 10 dB, a sub-array, a part of the SAA with non-distorted phases, is used to synthesize a compensation beam. Secondly, the SAA to detect the NFR targets, one of the radar requirements, deteriorates a beam performance by a spherical wave. To overcome a partial compensation method is proposed considering beam coverage of the radar operation at each target range. Some of the NFR targets to verify minimum range detection are simulated and the SAA beam gets back main lobe and has side lobes 15∼25 dB suppressed with compensation. With the SAA designed, a detection performance of the radar is simulated. Two targets and radar system parameter are used, and signal processing tasks are included in simulation. Also outdoor test is carried out to verify that the proposed compensation methods enhance the detection performance of the radar with real targets. It is confirmed that the moving targets and NFR targets are well detected because multiple false targets are eliminated with the proposed compensation methods.
1. INTRODUCTION
Generally, the main functions of a radar are detecting and tracking targets, and its required performances depend on applications. Recently, commercial cars introduce automotive radars preventing collision for safety enhancement of drivers [1]. Automotive radars apply transmit-receive modules (TRMs) to an individual element of array antennas and obtain improved performances with digital beam forming (DBF) [2, 3]. In military application, the automotive radars, one of the sensors for unmanned vehicles, are currently developed for autonomous navigation as well as collision prevention to meet differentiated radar requirements. Especially performance requirements, such as expansion of radar detection range and higher target resolution, need an antenna aperture widened and the number of array increased for a high gain and narrow antenna beam. It means that a radar has the risks of hardware complexity, weight and cost by increase of the number of receiving channels. In order to overcome these risks, a switch array structure (SAS) can be considered [4]. The SAS can obtain an expanded array effect with limited number of array elements.
On the other hand, the SAS needs some improvement because it causes performance deterioration of target detection by a beam distortion. The radar generally aims at detection of long-range targets by a plane wave, not near-field region (NFR) targets by a spherical wave. In the NFR with spherical wave formed, the performance deterioration of target detection is inevitable by the beam distortion. However, the detection of NFR targets for the automotive radars with autonomous navigation as well as collision
Received 4 January 2016, Accepted 16 February 2016, Scheduled 4 March 2016
* Corresponding author: Doo-Soo Kim ([email protected]).
prevention against bad weather conditions, such as heavy rain and snow, is indispensable. So the beam distortion of NFR targets should be absolutely improved to guarantee the detection performance of the radar. Especially an array antenna to get a high resolution and narrow beam with several tens of λof an aperture generates a spherical wave within several meters and results in beam distortion seriously. So far, most automotive radars cover small-sized array antennas with below 10λ of the aperture, so nobody raises questions and suggests their solutions on the beam distortion by the spherical wave of NFR targets [4, 6, 7]. Also a time-divided transmit by switch array to detect moving targets causes a phase distortion of echo signals and generates considerably high and periodic side lobes of the antenna beam. Most switch array antennas (SAAs) studied so far result in the same beam distortion of the moving targets as well. However, they focus on standstill targets, so there are no technical approaches on the beam distortion of the moving targets [4, 6]. There was a research on the beam improvement of the moving targets with a special algorithm [7]. However, a processing time to carry out the algorithm is not enough for a real-time radar operation. It means that the radar should get more hardware capabilities with a high-speed signal processing for the real-time operation. Therefore, a compact and simple technical approach useful for the SAA needs to be considered.
There are multiplicative arrays partly similar to the SAS to improve grating lobes [8, 9]. However, an effect of the multiplicative arrays is limited on single target detection, not possible for multiple targets detection simultaneously. When there are multiple targets on different angles at the same range and velocity, there is a possibility to detect false targets due to coupling effects by a product beam between the arrays. The multiplicative arrays should overcome the performance deterioration of the NFR targets detection by the spherical wave as well.
Therefore, this paper proposes the SAA with performance improvement for 77 GHz automotive FMCW radar to detect moving targets and NFR targets. The rest of this paper is organized as follows. Section 2 presents the radar system design covering a system hardware structure and a waveform. Section 3 presents the SAA design with compensation methods to detect the moving targets and NFR targets. Section 4 presents simulation and measurement results of the radar performance with the SAA. Finally, conclusions are discussed in Section 5.
2. RADAR SYSTEM DESIGN
2.1. System Hardware Structure
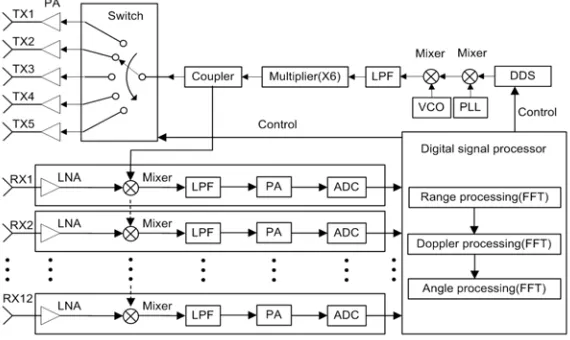
A system hardware structure of the designed radar is presented in Figure 1. The radar system is implemented with the SAS, which widens the antenna aperture and increases the number of array elements, to obtain a high gain and narrow antenna beam with limited hardware capability. The antenna, which is placed separately, consists of 5 transmit array elements and 12 receive array elements. Total 60 virtual array elements are synthesized with the time-divided transmit by switch array at a
transmitter (TX). In order to implement, a transmit array spacing should be multiplied by the number of receive array and receive array spacing. The TX consists of a direct digital synthesizer (DDS), a phase locked loop (PLL), a voltage controlled oscillator (VCO), a mixer, a low pass filter (LPF), a multiplier, a coupler, a switch and power amplifiers (PAs). The waveform is generated by the DDS, which features low spurious output, excellent frequency resolution, direct implementation of frequency, etc. The TX generates Ku-band signals (12∼13 GHz) at the end of LPF, multiplies them by 6 with the multiplier and delivers 77 GHz FMCW signals to the transmit array elements. A receiver (RX) consists of a low noise amplifier (LNA), a mixer, LPF, an intermediate frequency (IF) PA and an analog-to-digital converter (ADC). Received FMCW signals from targets go through down-conversion, filtering (20 MHz), sampling (50 MHz) and are converted to digital signals. A signal processor (SP) consists of two digital signal processing boards.
The SP receives 60 channels data and carries out a high-speed parallel processing for 30 Hz update time of the radar operation. Main functions of the SP are to extract target information, such as range, velocity and angle. In order to reduce processing time, the target information is extracted with Fast Fourier Transform (FFT). The SP controls the DDS and the switch using pulse repetition interval (PRI) as well.
2.2. Waveform Design
The radar waveform is presented in Figure 2, and it is a frequency-modulated continuous wave (FMCW) and sawtoothed chirp. Its frequency bandwidth (BW) is 200 MHz, and pulse width (PW) is 7 us. The antenna transmits a chirp signal and receives an echo of the target. The frequency difference between transmit and receive signals of each chirp is a sum of range and velocity beat frequency. The radar carries out signal processing with 1 chirp set consisting of 5 chirps, because the radar operates with the time-divided transmit by 5 transmit array elements as presented in Figure 1. It means that the switch array radar takes five times of operation time compared to the general array radar. It is at the expense of low cost, light weight and low hardware complexity by the SAS. The SP extracts target information with processing of 64 chirp sets, consisting of 1 burst.
Figure 2. Radar waveform.
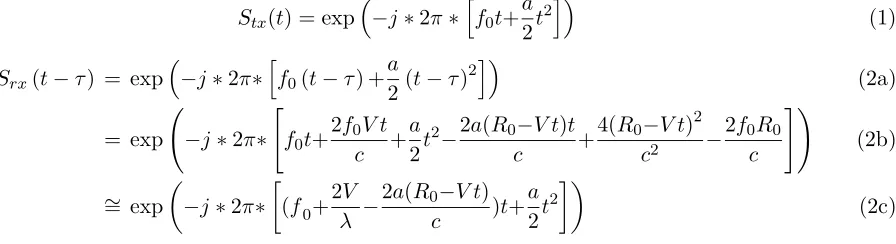
The transmit and receive chirp signals are described in Eqs. (1) and (2a), respectively [10]. Expanding Eq. (2a) with echo time (τ = 2(R0−V t)/c) of targets and eliminating the last two terms
in Eq. (2b), Eq. (2c) is approximately derived. The last two terms in Eq. (2b) are the least dominant and a constant, respectively. Mixing the transmit chirp signal in Eq. (1) and receive chirp signal in Eq. (2c), the range and velocity beat frequency are derived as Eqs. (3) and (4), respectively.
Stx(t) = exp
−j∗2π∗
f0t+a
2t
2 (1)
Srx(t−τ) = exp
−j∗2π∗
f0(t−τ) +a
2(t−τ)
2 (2a)
= exp
−j∗2π∗
f0t+
2f0V t
c + a 2t
2−2a(R0−V t)t
c +
4(R0−V t)2
c2 −
2f0R0
c (2b)
∼
= exp
−j∗2π∗
(f0+
2V λ −
2a(R0−V t)
c )t+ a 2t
2
fr = 2a(R0−V t)/c (3)
fd = −2V /λ (4)
where f0, a, R0, V and c denote the carrier frequency, chirp slope (= BW/P W), initial range of the
target, radial velocity and light velocity, respectively.
3. SWITCH ARRAY ANTENNA (SAA) DESIGN
3.1. SAA with Virtual Array Concept
Figure 3. Virtual array concept.
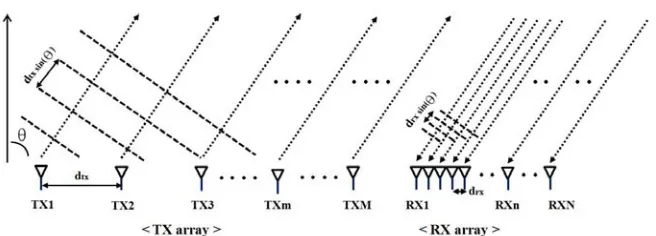
Generally, a virtual array is implemented with the transmit and receive arrays, which are placed separately as presented in Figure 3. The transmit and receive arrays consist of M and N elements, respectively. Putting the transmit array spacing as multiplication by the number of receive array and the receive array spacing, the virtual array is equal to the array consisting of 1 transmit element and M N receive array elements. Array factor derived from equality relation between both arrays is described in Eq. (5).
AF(θ) =
M
m=1
Ame−jk0mdtxsinθs N
n=1
Ane−jk0ndrxsinθs
·ejk0(mdtx+ndrx) sinθ
=
M N
i=1
Biejk0idrx( sinθ−sinθs) (5)
where Am, An, Bik0, dtx, drx, m, n, θs denote the weighting of the transmit array, weighting of
the receive array, weighting of the virtual array, wave number, transmit array spacing, receive array spacing, element number of the transmit array, element number of the receive array and beam scan angle, respectively.
The virtual array concept can be applied in the SAS with time-divided transmit. A synthesized antenna beam with the switch array radar explained in Figure 1 and Eq. (5) is presented in Figure 4. In order to calculate the antenna beam, the receive array spacing (0.6λ), transmit array spacing (7.2λ) and weighting of 60 elements (−35 dB Taylor) with 5 transmit array elements and 12 receive array elements are used. The antenna beam is calculated with Discrete Fourier Transform (DFT) at bore-sight. With the SAS using the virtual array concept, (M +N) real array elements play a role of MN virtual array elements. It is why the automotive radars consider the SAS in system design.
3.2. SAA for Beam Improvement of Moving Targets
3.2.1. Phase Distortion by Time-Divided Transmit
Figure 4. Synthesized antenna beam of virtual array.
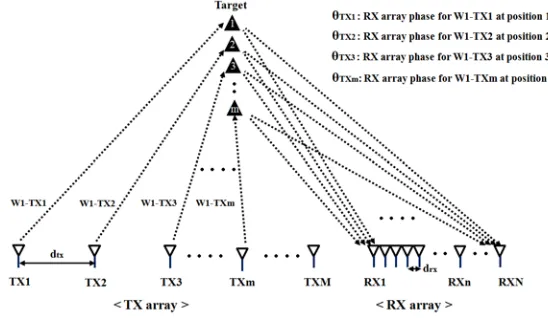
waveform. The time-divided transmit by switch array with the same waveforms described in Section 2 mitigates the hardware complexity because each RX needs only one matched filter, while the time-divided transmit causes a phase distortion at the receive array elements for the moving targets. Figure 5 conceptually shows that the moving targets generate phase distortion at the receive array elements by sequential transmit in the SAS. In Figure 5, Ws-TXm (s = 1 ∼64, m = 1 ∼5) denotes the radar waveform presented in Figure 2. The phase distortion at each receive array element with the movement of targets is derived as Eq. (6). The phase distortion can be calculated with the radial velocity (V), pulse width (P W), element number of the transmit array (m), element number of the receive array (n), number of transmit array (M) and number of receive array (N). In Eq. (6), ‘floor’ means an emission of fractions to get an integer. A same formula can be derived with Eq. (4), the velocity beat frequency, and the time-divided transmit by switch array.
Figure 5. Phase distortion of the receive array for moving targets.
θT Xm(m, n) = exp
−j∗2π∗2V ∗floor
[m−1] +[n−1] N
∗P W
λ
for 1≤m≤M,1≤n≤N (6)
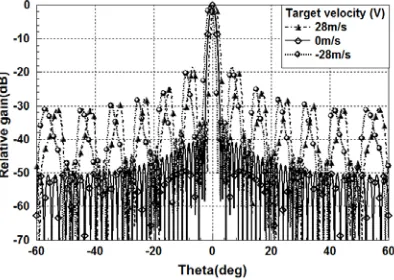
The characteristics of the phase distortion depend on velocity of the moving targets. The phase distortion for the velocities, such as +28, 0, −28 m/s, with the SAA (M = 5,N = 12) is presented in Figure 6. The phase distortion atM N array elements for the velocity of the moving targets generates M−1 times, and eachN array elements receive non-distorted phase signals. Depending on approaching or receding of the targets, the phase distortion at array elements is generated in the opposite way.
Figure 6. Phase distortion for the velocity of moving targets.
Figure 7. Synthesized antenna beam with the phase distortion.
periodic phase distortion with the time-divided transmit by switch array, and the velocity of the moving targets determines the side-lobe angle, side-lobe level and beam accuracy. The antenna beam for the velocity within ±28 m/s has lower side lobes and better accuracy than that shown in Figure 7. The antenna beam has a little accuracy error and can be compensated in the SP easily, while the considerably high and periodic side lobes deteriorate the radar performance with an increased false alarm of targets. Therefore, the side lobes to improve the radar performance should be suppressed.
3.2.2. Side Lobes Suppression Using Sub-Array Beam
The antenna beam of the SAA with the phase distortion by the time-divided transmit can be improved using a sub-array beam. Each N array elements obtain non-distorted phase signals in M N array elements, consisting of M transmit array elements and N receive array elements. It is also confirmed in Figure 6 that the periodic phase distortion ofM −1 times is generated as stairs, and each N array elements get non-distorted signals. When the sub-array beam synthesized with N array elements is applied to get a product beam as Eq. (7), the SAA beam to suppress the side lobes can be finally formed. In Eq. (7), the left parentheses represent the antenna beam of the SAA, consisting of M N array elements, with the phase distortion, and the right parentheses represent the sub-array beam, synthesized with N array elements, with non-distorted phase signals
AF(θ) =
M
m=1
N
n=1
Amnθ(m, n)ejk0(mdtx+ndrx)(sinθ−sinθs) ·
N
n=1
Bnejk0ndrx( sinθ−sinθs) (7)
where θ(m, n), Amn, Bn denote the phase distortion of the SAA in Eq. (6), weighting of M N array
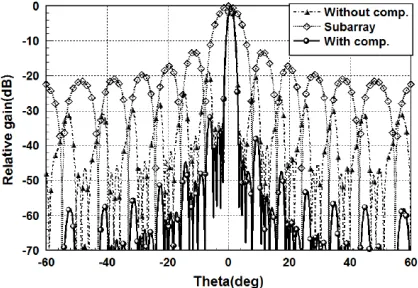
Figure 8. Synthesized antenna beam with/without compensation.
The weighting of the SAA and sub-array are −35 dB Taylor and uniform distribution, respectively. In Figure 8, the side lobes are excellently suppressed more than 10 dB with compensation because the high and periodic side lobes without compensation nearly falls on each null of the sub-array beam. The side lobes of the product beam are not perfectly suppressed because the antenna beam with the SAA is deflected off a little at bore-sight due to the phase distortion. However, the maximum and average side lobe levels of the antenna beam with compensation are highly improved, so the radar performance of the moving targets is finally enhanced with detection rate of false targets decreased.
3.3. SAA for Beam Improvement of Near-Field Region (NFR) Targets
3.3.1. Phase Distortion by NFR Targets
Generally, the amplitude and phase of anE-field radiated from single antenna or an array element with finite size depend on a range and an angle. Figure 9 presents a geometrical arrangement of the array elements to calculate theE-field of each array at observing points. In symmetricaly-axis, theE-field of the array elements at origin (Ao) and adjacent position (A1) can be calculated at the observing point
P. The range between each array element and the observing point P can be calculated by range (r), angle (φ,θ= 90◦) and the position (yn) of y-axis at each array element in spherical coordinate.
The range of array element (A1) with a binomial expansion is derived as Eq. (8) and the rest of
the array elements can be done with corresponding y-axis position of each array element in Eq. (8) as well [5].
R(y1, φ) =r−y1sinφ+
1 r
y12
2 cosφ
2
+1 r2
y13
2 sinφcosφ
2
+· · · (8)
At the observing point P, the relative amplitude and phase of the E-field at each array element determine a purity of the antenna beam. Generally the range from each array element has more influence on the phase than the amplitude and each range forms a relative phase distribution of the array elements differently. Putting a maximum phase difference among the array elements withλ/16, the range (R) to calculate the phase of each array element can be approximated as Eqs. (8a) and (8b) [5]. Eqs. (8a) and (8b) are a plane wave and a spherical wave, respectively. In range of Eq. (8b) the radiating near field is formed.
R(y1, φ) ∼= r−y1sinφf orr≥
2D2
λ (8a)
∼
= r−y1sinφ+
1 r
y21
2 cosφ
2
for 0.62
D3
λ ≤r≤ 2D2
λ (8b)
whereD denotes a size of the antenna, consisting of the array elements.
The angle estimation of the targets is generally carried out at range with the plane wave formed as Eq. (8a). In the NFR with the spherical wave formed as Eq. (8b), the antenna beam with the plane wave assumed has distortion characteristics
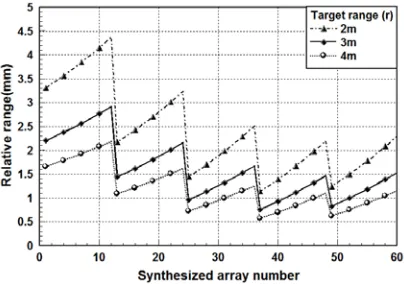
The relative range distribution between the targets and the array elements at bore-sight (φ= 0◦) with (8b) is presented in Figure 10. The SAA designed with 5 transmit array elements and 12 receive
Figure 10. Relative range distribution between targets and the array elements.
Figure 12. Synthesized antenna beam for the NFR targets.
array elements is considered at target ranges 2 m, 3 m and 4 m. Those are representative ranges of minimum detection range required for the automotive radars. The relative phase distribution among the array elements by (8b) is presented in Figure 11. It is confirmed that the phase difference among them for the NFR targets is considerable due to 77 GHz carrier frequency. The synthesized antenna beam for the NFR targets with (8b) is calculated as (9).
AF(φ) =
M N
t=1
Ate−jk0R(yt,φ)e−jk0tdrxsinφs (9)
where At and φs denotes an weighting of M N array elements and a beam scan angle other variables
are identical to Eq. (5).
The synthesized antenna beam for the NFR targets with Eq. (9) is presented in Figure 12. The antenna beam is calculated with DFT at bore-sight. The antenna beam is distorted a little in a shape of main lobe and has higher and periodic side lobes. The antenna beam includes the sub-array beam compensation to suppress side lobes generated by the time-divided transmit discussed Section 3.2. It means that an additional compensation should be considered to improve the antenna beam for the NFR targets.
3.3.2. Beam Compensation of NFR Targets
The relative phase distribution among the array elements is generated differently depending on the angle of the observing point (φ, θ= 90◦) at a fixed target range (r) in the NFR. In other words, each angle of the observing point causes a different phase distribution among the array elements. Therefore beam compensation with FFT-based beam synthesis is not fully possible, while beam compensation with DFT-based beam synthesis is fully possible because each beam is synthesized independently. The designed radar use FFT-based beam synthesis and its antenna beam can be compensated partially considering beam coverage for its operation. The distorted antenna beam for the NFR targets is compensated as Eq. (10). In Eq. (10), the left parentheses represent Eq. (9), and the right parentheses represent the phase compensation of the array elements using a representative angle within beam coverage.
AF(φ) =
M N
t=1
Ate−jk0R(yt,φ)e−jk0tdrxsinφs
·ejk0R(yt,φcom) (10)
whereφcom is a compensation angle, other variables are identical to Eqs. (5) and (9).
Figure 13. Synthesized antenna beam with compensation for the NFR targets (boresight).
Figure 14. Synthesized antenna beam with compensation for the NFR targets (30◦ beam scan).
the NFR targets. However, the outside of ±60◦ has side lobes more increased at bore-sight and 30◦ beam scan. It is inevitable because the designed radar applies FFT-based beam synthesis to the SP to reduce the angle processing time. Increased far side lobes at the outside of±60◦are absolutely low with maximum −30 dB and can be more suppressed with a radiator beam pattern. Therefore, the partial compensation to improve the antenna beam distortion for the NFR targets can be useful to enhance the radar performance.
4. RADAR PERFORMANCE
4.1. Simulation Setup
The detection performance of the radar, including the designed SAA, with and without compensation is verified. Tables 1 and 2 present target information and radar system parameter, respectively. The targets consist of 2 types, and their information includes range, velocity and angle. Target A is standstill and placed at the NFR, while Target B is approaching and placed at the far field region. The radar system parameter given in Table 2 includes some parameters of the designed radar to extract target information.
Table 1. Target information.
Target Range(m) Velocity(m/s) Angle(deg) Remarks
A 3 0 5 Standstill
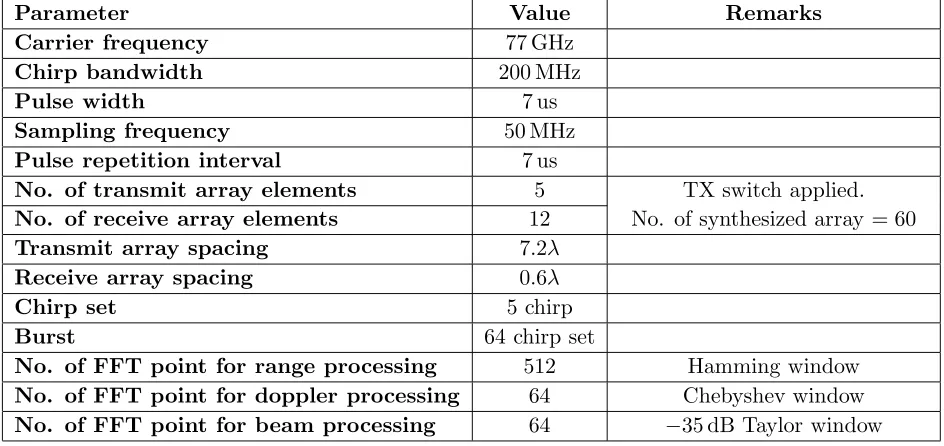
Table 2. Radar system parameter.
Parameter Value Remarks
Carrier frequency 77 GHz
Chirp bandwidth 200 MHz
Pulse width 7 us
Sampling frequency 50 MHz
Pulse repetition interval 7 us
No. of transmit array elements 5 TX switch applied.
No. of synthesized array = 60
No. of receive array elements 12
Transmit array spacing 7.2λ
Receive array spacing 0.6λ
Chirp set 5 chirp
Burst 64 chirp set
No. of FFT point for range processing 512 Hamming window No. of FFT point for doppler processing 64 Chebyshev window No. of FFT point for beam processing 64 −35 dB Taylor window
A signal processing flow of the designed radar is presented in Figure 15. A data cube consists of ADC data (350), chirp sets (64) and synthesized array elements (60) by TX switch. The ADC data are generated with mixing Stx(t), given in Eq. (1), andSrx(t−τ), given in Eq. (2c). A range processing is
carried out with zero-padding and 512 points FFT. A doppler processing is carried out with 64 points FFT. The maximum detection range for simulation is less than 130 m, so we used first 256 range bin data to extract doppler information of the targets. Finally, an angle processing is carried out with zero-padding and 64 points FFT. In each processing, window weighting to prevent false targets by side lobes is applied as Table 2.
Figure 15. Signal processing flow of the designed radar.
4.2. Simulation Results
Figure 16. Range processing result. Figure 17. Doppler processing result.
Figure 18. Angle processing result (Target A). Figure 19. Angle processing result (Target B).
presented in Figures 20 and 21, respectively. The images result from the summation in doppler domain. In order to identify whether those are true targets or not, thresholds are applied to final processing data. In Figure 20, both Target A and Target B generate multiple false targets. Especially Target A is detected as belt-shaped spread targets, so more deteriorates the detection performance of the radar. On the other hand, each target in Figure 21 is focused and detected as a single target. This improvement of the detection performance results from the SAA excellently designed with compensation for the NFR targets and the moving targets as mentioned in Section 3.
4.3. Measurement Results
Figure 20. Range-angle image(w/o compensa-tion).
Figure 21. Range-angle image(with compensa-tion).
Figure 22. Manufactured radar. Figure 23. Measured beam pattern of SAA.
Figure 26. Angle processing result.
Figure 27. Range-angle image(target C). Figure 28. Range-angle image(target D).
means that clutters and noise have some negative influence on the radar performance compared to simulation results. The images of Targets C and D in range-angle domain are presented in Figure 27 and 28, respectively. In order to identify whether those are true targets or not, thresholds are applied to final processing result data. The threshold is 7 dB higher than at the simulation setup considering outdoor test experiences. At Target C, some fault targets occur because some leakage from TX hinders perfect side-lobe suppression. However, this result is better than the simulation result without beam compensation. Target D is recognized as an obviously single target with a little blur. It is confirmed with 77 GHz automotive radar with good detection performance.
5. CONCLUSIONS
SAA to detect the NFR targets, one of the radar requirements, deteriorates the beam performance by the spherical wave. To overcome this deterioration, the partial compensation method is proposed considering beam coverage of the radar operation at each target range because FFT-based beam synthesis generates all of the beams simultaneously. The phase compensation of the array elements is carried out selecting bore-sight as the representative angle to compensate all the distorted beams within beam coverage. Some of the NFR targets to verify minimum range detection are simulated, and the SAA beam gets the main lobe back and has side lobes 15∼25 dB suppressed with compensation. With the SAA designed, the detection performance of the radar is simulated. Two targets and radar system parameter are used, and signal processing tasks are included in simulation. The range, doppler and angle processing are carried out, and in order to identify whether the detected targets are true or not, thresholds are applied to final processing result data. It is confirmed that the moving targets and NFR targets are well detected because multiple false targets are eliminated with the proposed compensation methods. Also outdoor test confirms that the proposed compensation methods improve the detection performance of the radar with real targets, consisting of corner reflector and SUV. This improvement of the detection performance results from the SAA excellently designed with compensation for the NFR targets and moving targets.
REFERENCES
1. Folster, F., H. Rohling, and U. Lubbert, “An automotive radar network-based on 77 GHz FMCW sensors,”Radar Conference 2005, 871–876, May 2005.
2. Lievers, C. M., W. L. van Rossum, A. P. M. Maas, and A. G. Huizing, “Digital beam forming on transmit and receive with an AESA FMCW radar,” Proceeding of the 4th European Radar Conference 2007, 47–50, October 2007.
3. Van Rossum, W. L., C. M. Lievers, A. P. M. Maas, and A. G. Huizing, “Suppression of sidelobe scatterers in an AESA FMCW radar,”Radar Conference 2008, 1–5, 2008.
4. Schneider, M., “Automotive radar — Status and trends,” IEEE-German Microwave Conference 2005(GeMic 2005), 144–147, 2005.
5. Balanis, C. A., Antenna Theory,, 133–151 John Wiley & sons inc., 1997.
6. Lee, M. S. and Y. H. Kim, “Design and performance of a 24-GHz switch-antenna array FMCW radar system for automotive applications,” IEEE Transactions on Vehicular Technology, Vol. 59, No. 5, 2290–2297, 2010.
7. Hu, C., Y. Liu, H. Meng, and X. Wang, “Randomized switched antenna array FMCW radar for automotive applications,” IEEE Transactions on Vehicular Technology, Vol. 63, No. 8, 3624–3641, 2014.
8. Macphie, R. H. and T. H. Yoon, “Grating lobe suppression with a thinned multiplicative receiving array,”Microwave Conference Proceedings, APMC, 2005.