Abstract: Smart grid is an advanced electrical supply system in which data is conveyed bi directionally utilizing computerized correspondence innovation. Observing, investigating, controlling and correspondence happens inside the inventory network accordingly improving proficiency, lessening vitality utilization and so on. A Phasor Measurement Unit (PMU) measures electrical signals in system. PMUs are utilized in the transmission side of the system. These are introduced at different places on the network and are time synchronized utilizing Global Positioning System (GPS). Thus real time synchronized continuous estimations are obtained from different estimation points on the network. PMU helps in automating the system. A system of PMUs called Wide Area Measurement System (WAMS) can be utilized for huge scale monitoring of the network. Power outages and load shedding in the system can avoided.
PMUs can synchronously gauge voltage and current, phase angle, power, energy import & export, frequency, frequency deviations, etc. These parameters can be utilized to tell about the state of the system. The optimal placement of PMUs & Event detection techniques from the synchronized PMU data are determined using MATLAB software. Programming PMUs to detect the events in the system & placing it optimally can help diminish the huge expense and equipment intricacy.
Keywords: A, Event detection, FFT, Monitoring, Optimal placement.
I. INTRODUCTION
Power system reliability plays a vital role in the present scenario. Load shedding & Power outages are serious issues looked in the present world. These issues can be kept away from by appropriately checking and controlling the power system network. Appropriate checking and controlling of intensity lattice should be possible utilizing a PMU. The parameters estimated utilizing PMUs can be transmitted all through the system [1]. Smart grid is a modernized system that utilizations advanced handling and correspondence innovation to distinguish and respond to nearby changes in the system along these lines giving steady and quality power at reasonable rates [1]. In this way fault recognition is improved and permits self recuperating of the system.
Revised Manuscript Received on October 05, 2019.
Kiran R, Department of Electrical & Electronics Engineering, Dayananda Sagar Academy of Technology & Management, Bangalore, India. Email: [email protected]
B. R. Lakshmikantha, Principal, Dayananda Sagar Academy of Technology & Management, Bangalore, India. Email: [email protected]
K.Shanmukha Sundar, Department of Electrical & Electronics Engineering, Dayananda Sagar Academy of Technology & Management, Bangalore, India. Email: [email protected]
The data from the system must be obtained in a synchronized way so as to guarantee uniform dispersion of control over a huge territory. PMUs are introduced all through the transmission side of the network and these PMUs screens the condition of the electrical system.
It screens the status of the breakers, hardware execution, blockage, Black-outs and request reaction events. There are different techniques to decide the phasor parameters. Fig. 1 illustrates a visual summary of the blackouts and major power system disturbances of the past several decades in the world [2].
Fig.1. Major System disturbances and blackouts
II. PHASORMEASUREMENTUNIT
From the time when PMUs were innovated, the method of phasor estimation advanced into the figuring of phasor estimations that are synchronized to a flat out time reference given by GPS [3].
Fig.2. illustrates a generic PMU structure. SCADA was utilized in prior stages. These had a couple of disadvantages like the estimations were not time synchronized, they give just size and there was no information on phase angle[4], it was not dynamic as it was giving one sample in 2- 4 seconds, gives just neighborhood observing and control. These disadvantages are overwhelmed with the development of PMU.
Placement of PMU Optimally and Detection of
Events in Power System
PMUs give time synchronized phasor estimations, both greatness and stage point estimation. The perceptibility is dynamic with expanded goals of up to 10 – 60 samples for each second. They give wide zone observing and control. Checking of network should be possible by understanding sequence of events from synchronized information. A PMU has different functionalities. They give the phasor parameters of the voltage, frequency and current in the network. They check the status breakers and so on. Performances of different types of switchgear in the system are likewise checked with assistance of PMU.
Clog during correspondence of data is stayed away from the system [5] and furthermore the black-out and load shedding are maintained a strategic distance from by constant observing of the system [6]. Figure.2. demonstrates a schematic of a PMU. Phasor parameters can be assessed in various ways. DFT based method; sliding DFT based method & recursive method are few methods to estimate phasor parameters. Fig.3 shows the grading arrangement of WAMS.
Fig.3. shows the grading arrangement of WAMS.
III. POWERSYSTEMSECURITY
Power system stability of current enormous interconnected network is a noteworthy issue for secure activity of the system. Recent real power outages over the globe brought about by system instability in complex and secure system represent the issues confronting secure activity of power system. Prior, stability was characterized as the capacity of the system to come back to typical or stable activity in the wake of having been exposed to some type of aggravation, for example, load increment. This on a very basic level refers to the capacity of the system to stay in synchronism. Anyway current power system work under complex interconnections; controls and much focused on conditions. Further, with expanded mechanization and utilization of electronic hardware, the quality of power has increased most extreme significance, moving spotlight on to the ideas of voltage stability, frequency security, and so forth. The power system is amazingly non-linear and dynamic system, with working parameters persistently differing. Stability is thus a component of the underlying working condition and the idea of aggravation. Power systems are constantly exposed to little unsettling influences as load changes. The system must be in a situation to have the option to modify the changing conditions and work acceptably. The system should likewise withstand bigger aggravations, which may even cause due to disconnection of some faulted components. The characterization of power system security considers:
1) The fundamental system variable in which instability can be watched.
2) The size of the unsettling influence.
3) The time range to be considered for evaluating stability [7].
Since power system devices are designed to be operated within specified limits, most pieces of system are protected
via automatic tool which can cause device to be switched out of the system if those limits are violated. If the device violates those limits (line limits, voltage limits and many others.) continuously, and if there is no alternate action taken, then the whole device or massively a part of it may completely collapse. This is commonly referred as a BLACKOUT.
STRATEGIES OF ENHANCING VOLTAGE STABILITY
Voltage stability of the system can be enhanced through the following strategies:
1) Enhancing the localized reactive power strength (SVC, STATCOM) is effective and comparatively cheap. 2) Compensating the line length reduces net reactance and power flow will increase.
3) Additional transmission line can be erected. It additionally improves reliability.
4) Enhancing excitation of generator, system voltage improves and Q is supplied to the system.
5) By resorting strategic load shedding, voltage is going up because the reactive burden is reduced.
IV. PROBLEMFORMULATION
A. Optimal PMU placement problem
The formulation of optimal placement of PMU problem for a network with N nodes is given by
Xi) * (F(i) cost Fuel Minimize (1) b > X * A : to Subject (2) F speaks about the fuel cost related with arrangement of PMUs on every hub. This expense is related to installation, commissioning & maintenance of PMUs. Variable Xi speaks about the position of a PMU at hub I and matrix A speaks about co-efficient of requirement conditions required for ideal arrangement for complete perceptibility.
“PMU based Topological Observability:
The following simple rules stated below are put together to make the system topologically observable using PMUs, 1. If phasor information of voltage and current are known at one end of a branch, then voltage phasor at another end of the branch can be evaluated by Ohm’s law.
2. When voltage phasors at two different ends of a branch are known, branch current can be evaluated.
3. When zero injection bus is present with no PMU, and only one unknown outgoing current, then that current can be computed using Kirchhoff’s Current Law (KCL).”[7]
A* SEARCH ALGORITHM
B. Event Detection using screening Algorithm
The term event portrays enormous aggravations on the power system and unexpected changes in the power system. Enormous unsettling influences on transmission lines; transmission line trip and reclosing activities; or an enormous and abrupt loss of generation or burden. Huge aggravations energize a solitary or various modes inside the power system; these can be estimated as oscillations in PMU voltage information. These oscillations are commonly between 0.1 Hz and 2.0 Hz, & oscillations will immediately damped out if the system is steady. This data is utilized to recognize events in the PMU information. In many cases, it is hard to check the reason for the detected events. The main driver of a couple of the recognized events can be determined [8].
V. PROPOSEDPMUPLACEMENTMETHOD&
SCREENINGALGORITHM
A. Proposed PMU placement Technique
Fig.4. shows the proposed algorithm for optimal placement of PMUs
The A* PMU arrangement algorithm takes the power system bus information. The yield of this A* algorithm would be the arrangement of hubs that must have a PMU introduced to such an extent that the underlining diagram is totally observable [9]. The calculation iteratively puts a PMU on the hub that has the most noteworthy degree, or most associations, until the power system is totally observable.
B. Screening Algorithm Development
The PMU synchrophasor information comprise of voltage, angle, and frequency for each PMU station and are spared hourly in CSV file. All PMU frequencies and all conceivable voltage angles between PMU stations are dissected [10]. A flowchart portraying the calculation is shown in Figure 4.2. In the flowchart, the signal to be analyzed for the hourly PMU record transferred is allocated to the variable y[11]. The calculation doesn't break down the whole hour of information without a moment's delay, yet rather investigates a window of PMU information, appointed to the variable yWindow. The subroutine examination on the window of information yWindow is applied for each moving window of information until the finish of the whole hour of the signal y [12].
Fig.5. shows the Flowchart used to detect events in power system
FFT“
Any waveform is actually just the sum of a series of simple sinusoids of different frequencies, amplitudes, and phases. A Fourier series is that series of sine waves; and we use Fourier analysis or spectrum analysis to deconstruct a signal into its individual sine wave components. The result is acceleration/vibration amplitude as a function of frequency, which lets us perform analysis in the frequency domain (or spectrum) to gain a deeper understanding of our vibration profile. Most vibration analysis will typically be done in the frequency domain.
The number of discrete frequencies that are tested as part of a Fourier transform is directly proportional to the number of samples in the original waveform. With N being the length of the signal, the number of frequency lines or bins is equal to N/2. These frequency bins occur at intervals (∆f) equal to the sample rate of the raw waveform (Fs) divided by the number of samples (N), which is another way of saying that the frequency resolution is equal to the inverse of the total acquisition time (T).”
VI. CASESTUDY&SIMULATIONRESULTS A. PMU placement Technique
[image:4.595.302.556.71.324.2]The proposed method of optimal PMU placement has been tested on the IEEE 14-bus system & IEEE 30-bus system.
Fig.6. shows the single line diagram of IEEE 14 bus system.
[image:4.595.58.289.243.422.2]
Fig.7. shows the single line diagram of IEEE 30 bus system.
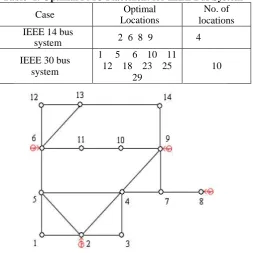
Table- I: Optimal PMU Placement for IEEE Bus System
Case Optimal
Locations
No. of locations IEEE 14 bus
system 2 6 8 9 4
IEEE 30 bus system
1 5 6 10 11 12 18 23 25
29
10
Fig.8. shows the optimal placement of PMU locations in IEEE 14 bus system.
B. Event or disturbance Detection in Power System The event detection algorithm has been tested on 400kv Karnataka state, India network where PMUs are placed. This is a four bus network & the PMU data from each 400kv station is utilized to detect the event, contingency or a disturbance in the network. The buses are Nelamangala 400kv station, Raichur 400kv station, Alipur 400kv station & BTPS 400kv station. The PMU data will be in CSV format & is collected from various 400kv stations. The preprocessing of the data is required in CSV file. The CSV file is analyzed; columns in PMU data are identified. PMUs are able to measure all the electrical parameters & Figure 9 shows the voltage magnitude at 400kv nelamangala station.
[image:4.595.51.272.454.705.2]The phase angle data of a voltage is to be modified in PMU data as phase angle varies from 180 to 180 degrees. The phasors are rotating continuously & not constant. The phase angle increases or decreases & it depends upon the rotation speed.
Fig.9 shows the voltage magnitude at 400kv nelamangala station.
At the point when the voltage phasor is turning at more than nominal speed, the phase angle crosses from 180 to - 180 degrees & the phase angle
[image:4.595.315.544.588.728.2]The phase angle at each PMU station is unwrapped before the distinction in the phase angle
[image:5.595.313.558.53.196.2]between the two stations is taken. The unwrapped phase angle data would now be able to detect the events in the power system.
Fig.10. shows the phase angle at 400kv nelamangala station.
Fig.11. shows the frequency at 400kv nelamangala station.
[image:5.595.64.281.117.348.2]The accepted regulation in India is 5%. Frequency will be varying in the range of 49.5 to 50.5. Figure 11 shows the frequency signal at nelamangala station. Angle differences between all neighboring PMUs are determined & can be accessed & examined.
Fig.12. shows the phase angle differences between BTPS-nelamangala
[image:5.595.55.299.436.552.2]Angle differences between BTPS-nelamangala, alipur-nelamangala & raichur-nelamngala are shown in Figure 12, Figure 13 & Figure 14 respectively
Fig.13. shows the phase angle differences between Alipur-nelamangala
Fig.14. shows the phase angle differences between Raichur-nelamangala
To detect the events from PMU data, a moving windowing technique is used. The size of the window is 20 seconds in length and covers half of the beforehand windowed information. Every window of information is examined for possible potential events with the help of FFT technique.
FFT technique is then applied to the window of information, and max esteems from every investigation window are spared. A case of the most extreme value from the aftereffects of the FFT strategy applied to the above window of information is termed as event.
[image:5.595.322.549.443.711.2]The maximum value shows the oscillations or changes in the window of information being dissected. This progression is rehashed until the complete signal is examined. The spared maximum esteems from FFT technique are assessed to identify suspected events or disturbance in the power system. The pinnacle esteems taken from every window of information are termed as event. Value that are above 3.5 standard deviations from the mean are viewed as speculate events or disturbance which is shown in figure 15, figure 16 & figure 17.
Fig.15. shows the events detected from BTPS-nelamangala signal
[image:5.595.57.301.623.749.2]Fig.17. shows the events detected from Raichur-nelamangala signal
Fig.18. shows the events detected from Raichur-nelamangala signal
Contour analysis can be used to visually explain the information the data is providing. Contouring data represents an elementary step in data analysis. Ability to correctly and confidently analyze data is critical to interpreting conditions. Figure 18 shows the contour plot of phase angle of all three stations.
VII. CONCLUSION
This paper is based on synchrophasor or phasor measurement unit placement & analysis of the data. It mainly focuses on placement of PMUs optimally & detect the events, contingency or disturbances from the PMU data. Optimal PMU placement problem is formulated, solved using path finding algorithm & implemented on IEEE 14 bus & IEEE 30 bus system. It is found that four & ten PMUs are sufficient to observe the IEEE 14 bus & IEEE 30 bus system optimally.
The PMU data will be in CSV format; it is analyzed, identified each column in PMU data, modified the phase angle data. This modified data is used to detect the events, contingency or disturbances in the system. It is implemented on Karnataka 400kv system & PMU data from Nelamangala 400kv station, Raichur 400kv station, Alipur 400kv station & BTPS 400kv station are utilized. The algorithm is found to be effective & was able to detect the events, contingency or disturbances in the system.
ACKNOWLEDGMENT
I would like to thank Power grid, India & Ministry of Power, India & KPTCL, Karnataka for providing valuable data.
REFERENCES
1. Xi Fang, Satyajayant Misra, Guoliang Xue, and Dejun Yang, “Smart Grid – The New and Improved Power Grid: A Survey”, in IEEE communications surveys & tutorials, vol. 14, no. 4, fourth quarter 2012. 2. A. G. Phadke and J. S. Thorp, “Synchronized Phasor Measurements and
Their Applications”, in New York: Springer, 2008.
3. Chandarani Sutar, Dr. K. S. Verma, “Application Of Phasor Measurement Unit In SMART GRID”, in Pratibha: International Journal Of Science, Spirituality, Business And Technology (IJSSBT), vol. 1, no.2, February 2013 .
4. Abderrahmane Ouadi, Hamid Bentarzi, and Jean Claude Maun, “A New Computer Based Phasor Measurement Unit Framework”, in 6th International Multi-Conference on Systems, Signals and Devices, 2009. 5. David G. Hart, David Uy, Vasudev Gharpure, Damir Novosel, Daniel Karlsson, Mehmet Kaba, “PMUs – A new approach to power network monitoring”, in ABB Review, 2001.
6. S. Nithin,, Sivraj P, Sasi K. K, Robert Lagerstöm, “Development of a Real Time Data Collection Unit for Distribution Network in a Smart Grid Environment”, in Power and Energy Systems Conference: Towards sustainable energy, 2014.
7. R Kiran, B.R. Lakshmikantha, R.V. Parimala, "Optimal placement of PMUs & analytics on PMU data using ANN technique", in 2017 International Conference on Energy, Communication, Data Analytics and Soft Computing (ICECDS), 2017.
8. W.M. Grady and D. Costello, “Implementation and application of an independent texas synchrophasor network”, in Protective Relay Engineers, 2010 63rd Annual Conference, april 2010.
9. Kiran R, B.R. Lakshmikantha, R.V. Parimala, "A novel software model for enhancement of system performance and security through an optimal placement of PMU & FACTS", 2016 IEEE Students' Conference on Electrical, Electronics and Computer Science (SCEECS), 2016. 10. W.M.; Santoso S. Allen, A.J.; Sang-Wook Sohn; Grady, “Algorithm for
screening pmu data for power system events”, in IEEE International Smart Grid Technologies, IEEE, 2012.
11. S. Muljadi E.; Allen, A.J.; Santoso, “Phasor measurement unit (pmu) for wide area monitoring, protection, and control (wampac) applications”, in Technical report, National Renewable Energy Laboratory (NREL), 2012.
12. A.J. Allen, S. Santoso, and W.M. Grady, “Voltage phase angle variation in relation to wind power”, in Power and Energy Society General Meeting, IEEE, july 2010.
13. S.W. Sohn, A.J. Allen, S. Kulkarni, W.M. Grady, and S. Santoso, “Event detection method for the pmus synchrophasor data”, in Power Electronics and Machines in Wind Applications (PEMWA), IEEE, 2012. 14. Joonhyun Kim and W.M. Grady, “Synchrophasor analysis of 221 generating unit trips in ercot”, in Power and Energy Society General Meeting, IEEE, july 2011.
15. L. Vanfretti, R. Garcia-Valle, K. Uhlen, E. Johansson, D. Trudnowski, J.W. Pierre, J.H. Chow, O. Samuelsson, J.stergaard, and K.E.Martin, “Estimation of eastern denmark's electromechanical modes from ambient phasor measurement data”, in Power and Energy Society General Meeting, IEEE, july 2010
AUTHORSPROFILE
Kiran R obtained his B.E and M.Tech from Visveswaraya Technological University in 2010 and 2012 respectively He is pursuing Ph.D degree under Visveswaraya Technological Univ ersity, Belgaum, Karnataka State, India. Presently he is working as an Assistant Professor in Department of Electrical & Electronics Engineering at Dayananda Sagar Academy of Technology & Management. His areas of interest are in PMU, FACTS controllers, ANN & optimization of Power System.