International Journal of Innovative Technology and Exploring Engineering (IJITEE) ISSN: 2278-3075, Volume-9 Issue-1, November 2019
Effect of Fe Substitution on the Structural,
Electrical and Dielectric Properties of
La0.70Ca0.30MnO3 Cathode for SOFCs
Surinder Paul, Manokamna, ShubhpreetKaur , P.S. Malhi, Anupinder Singh, Arvind Kumar
Abstract: Perovskite solid solutions (La0.70Ca0.30)(FexMn1-x)O3 where x = 0.01, 0.20, 0.30 and 0.40 ceramics were synthesized by solid state reaction route. The structural studies were carried by X-Ray diffraction method and the observed results have indicated that all the prepared samples were crystallized into single phase. The surface morphology was studied by Scanning Electron Microscopy and the images have revealed that grain size has increased with the increasing concentration of Fe. Archimedes principle was used to calculate the density of all the sintered samples and the density values were observed to be in increasing order. The impedance and dielectric properties have been characterized at different ranges of temperature and frequency. The value of electrical conductivity were found to be more than 100 S cm-1, which indicate that the synthesized material is suitable material for cathode of Solid Oxide Fuel Cell.
Index Terms: Solid Oxide Fuel Cell, Cathode Material, XRD, Conductivity, Magnites
I. INTRODUCTION
The depletion of fossil fuel resources makes it an urgency to find alternative energy sources which are sustainable and clean. For the next generation energy carriers, hydrogen has been considered as one such alternative because it is clean, renewable and portable [1, 2]. Solid oxide fuel cells are one of the main sources of production of hydrogen. As solid oxide fuel cell offers renewable energies and also the potential to be carbon free [3]. The efficiency of SOFC can reach up to 60 % ,and goes up to 80 % on heat recovery [4]. SOFC has three main components: an anode, an electrolyte, the cathode [5]. Development of cost-effective component is becomes a major research aim on SOFC. To get good performance form SOFC and to be sustainable at high temperature conditions, the cathode must fulfill some requirements like adequate conductivity preferably greater than 100 S cm-1 under oxidizing environment, thermal expansion compatibility, and chemical compatibility with other components etc[10]. Platinum has been studied as air electrode for yttrium doped zirconia (YSG)[11].
Revised Manuscript Received on November 05, 2019.
Surinder Paul, I.K.Gujral Punjab Technical University, Kapurthala ,
Punjab, India
Manokamna, I.K.Gujral, PTU, Kapurthala , Punjab, India
ShubhpreetKaur, MFM Lab, Guru Nanak Dev University, Amritsar ,
Punjab, India
P.S.Malhi, Department of Chemistry , Guru Nanak Dev University,
Amritsar , Punjab, India
Anupinder Singh, Department of Physics, Guru Nanak Dev
University, Amritsar , Punjab, India
Arvind Kumar, Department of Applied Sciences, B.C.E.T,
Gurdaspur, Punjab, India
materials for operation temperature lower than 800°C [6-9] But platinum being expensive become uneconomically feasible Sr doped LaMnO3 (LSM), LaCO3 (LSC) and LaFeO3 (LSF) solid solutions of perovskite oxide are considered as inexpensive good material candidates for SOFC cathode. But the electrochemical performance of LSM decreases at reduced temperature due to low conductivity [12-13]. However, LSC is also limited useful; due to thermal expansion mismatch with the electrolytes [14-15]. The flexibility of perovskite to the alkali earth and transition metals provides a vast composition range for demanding targets. Calcium is considered to be another pronouncing doping element. Investigations on La1-xCaxMnO3 have been made by Takeda et al. [16] and found to be excellent material having high electrical conductivity and thermal expansion compatibility with YSZ electrolyte. Jie et al. [17] synthesized and characterized La1-xCaxFe0.9Mn0.1O3 and found high mixed conductivity. Keeping all the above information in mind the main objective of this work is to find novel cathode material with high electrical conductivity. In this paper, we focused on the synthesis and characterization of Ca and Fe co doped LaMnO3in order to make the cathode material for SOFC.
II. EXPERIMENTAL
Conventional solid state reaction route was used to synthesize the (La0.70Ca0.30)(FexMn1-x)O3, where x = 0.10, 0.20, 0.30 and 0.40 ceramic solid solutions. La2O3, Fe2O3 CaCO3 and Mn2O3 (99.9% pure, from sigma Aldrich) were used as raw materials. After weighing in stoichiometric proportion, raw materials were mixed by mortar and pestle for one hour. The mixed powder then ball milled by simple ball mill for 24 hours after pours it into a bottle containing zirconia balls and propanol. After the normal ball milling, powder was further planetary ball milled for 12 hour. The resulting mixture were dried and calcined for 12 hour at 1200°C in high temperature furnace. Polyvinyl alcohol (PVA) binder of 2 wt % was then mixed with calcined powder. The mixed powder then sieved using 70-mesh sieve after grinding and then uniaxially die-pressed into discs of 10 mm diameter and 1mm thickness. The resulting pellets were further sintered for 2 hour at 1400°C.
III.RESULTS AND DISCUSSION A. XRD
SOFCs
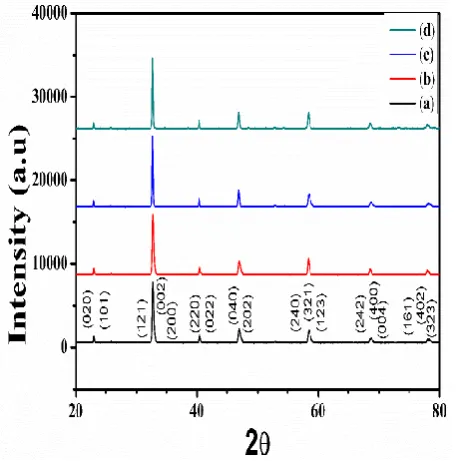
[image:2.595.310.539.102.280.2]X-rays of wavelength 1.54 Å was used and the diffraction data were obtained in the range of 20°–80°with a step size 0.02° and at the speed of 2° per minute. The samples were well crystallized which were recognized by the high intensity sharp crystalline peaks present in the XRD pattern.
Figure 1. X-ray diffraction of (La0.7Ca0.3)(FexMn1-x)O3 Patterns ; (a) x = 0.10, (b) x = 0.20, (c) x = 0.30, and (d) x
= 0.40
The Lebail fittings were carried out using orthorhombic primitive space group (Pnma, group no. 62) with FULL PROF SUITE Software. The theoretical and experimental data were comparatively well matched signify that the two models are extremely close to each other. All the peaks present are indexed according to Pnma space group. None of the peak left unassigned which show that all the prepared samples were well crystallized and formed in single phase. The various crystallographic parameters obtained from the refinements are given in table 1.
Table 1: Crystallographic Parameters of (La0.70Ca0.30)(FexMn1-x)O3 where x = 0.10, 0.20, 0.30 and
0.40 .
Composition
(x) a (Ả) b (Ả) c (Ả) V (nm 3
)
0.1 5.476 7.759 5.462 232.07
0.2 5.476 7.761 5.462 232.13
0.3 5.475 7.778 5.463 232.63
0.4 5.476 7.782 5.463 232.80
B. Surface Morphology
The SEM micrographs of prepared
(La0.70Ca0.30)(FexMn1-x)O3 where x = 0.10, 0.20, 0.30 and 0.40 solid solutions are shown in figure 2.
Figure 2: Scanning electron micrographs of (La0.70Ca0.30) (FexMn1-x)O3 for (a) x = 0.10, (b) x = 0.20,
(c) x = 0.30, (d) x = 0.40
The images have clearly revealed the information about the microstructure of all the samples. The grains of non-regular shape and size are formed which are clearly visible from the images. Increasing content of Fe continuously enhance the grain size of the samples. Archimedes principle was used to measure the density of the samples. The experimental density values obtained for different compositions are tabulated in table 2. The density values and SEM micrographs were found to be in well agreement.
Table 2: Density Values of (La0.70Ca0.30)(FexMn1-x)O3 for
x = 0.10, 0.20, 0.30 and 0.40 . Sr. No. Composition
(x)
Density
1 0.10 3.48
2 0.20 4.08
3 0.30 4.57
4 0.40 4.81
C. Conductivity
The temperature dependent electrical conductivity profile at different frequencies range starting from room temperature to 600°C for (La0.70Ca0.30)(FexMn1-x)O3, x= 0.10, 0.40 samples is shown in figure 3.
Figure 3: Variation of electrical conductivity with temperature at different frequencies for (a) x = 0.10 and
[image:2.595.50.279.133.364.2]International Journal of Innovative Technology and Exploring Engineering (IJITEE) ISSN: 2278-3075, Volume-9 Issue-1, November 2019
The electrical conductivity values have calculated by using formula σac = G where G, a, l and σac be conductance, area, thickness and electrical conductivity of the electrode respectively.
[image:3.595.324.535.117.266.2]The conductivity profiles clearly show a gradual increase with increasing Fe content from x = 0.10- 0.40. Graph also show that conductivity increased with temperature. The maximum calculated conductivity value for x = 0.10 and 0.40 compositions are 98.169 S/cm and 112.31 S/cm respectively. The activation energy has also calculated using Arrhenius fitting from the experimental data andArrhenius plots for (a) x = 0.10 and (b) x = 0.40are shown in figure 4. The activation energy has found to be decreasing from 0.183eV to 0.138eV with increasing x which is a direct evidence for increase in electrical conductivity with Fe substitution.
Figure 4: Arrhenius curves (lnσ vs. 1000/T) of (La0.70Ca0.30)(FexMn1-x)O3 for (a) x = 0.10 and (b) x = 0.40
The electrical conductivity vs. frequency of (La0.70Ca0.30)(FexMn1-x)O3, x= 0.10 – 0.40 has also measured and shown in figure 5. The graphs clearly depict that Fe substitution raise the conductivity. This enhancement in the conductivity suggests that the prepared samples are good for solid oxide fuel cell and can be used for the manufacturing
[image:3.595.58.253.258.374.2]of the cathode materials.
Figure 5: Electrical conductivity with frequency of (a) x = 0.10, (b) x = 0.20, (c) x = 0.30, (d) x = 0.40
D. Impedance Spectroscopy
The dielectric relaxation in the prepared samples has studied using impedance spectroscopy. The Z’ verses frequency graphs for (La0.70Ca0.30)(FexMn1-x)O3, x= 0.10 - 0.40 samples are shown in figure 6. Graphs clearly show continuous decrease in the magnitude of real part of impedance (Z’) with increase in temperature and frequency.
This type of behavior is a signal of negative temperature coefficient of resistance (NTCR) behavior present in the samples [18]. This decrement in the magnitude of Z’ with frequency and temperature accounts for the increase in conductivity of the samples [19, 20].
Figure 6: Real part of impedance (Z’) vs. frequency of (a) x = 0.1, (b) x = 0.2, (c) x = 0.3 and (d) x = 0.4
Figure 7 shows the variation of Z” versus frequency of (La0.7Ca0.3)(FexMn1-x)O3, for x= 0.1 - 0.4 samples at different temperature values. As the frequency increases, graphs clearly show a continuous decrease in the value of Z”. This behavior of Z” indicates the decrease in resistive properties. The
Figure 7: Z’’ vs. frequency of (a) x = 0.1, (b) x = 0.2, (c) x
= 0.3, (d) x = 0.4
[image:3.595.324.523.390.528.2] [image:3.595.49.286.429.655.2]continuous broadening of Z” versus frequency plot with increase in temperature shows that samples exhibit temperature dependent relaxation process.In low temperature this type of relaxation may be due to immobile electrons and in higher temperature region, defects are responsible for this. The merging of Z” versus frequency curve indicates the disappearing of space charge polarization [21, 22].
E. Temperature Dependent Dielectric Data
SOFCs
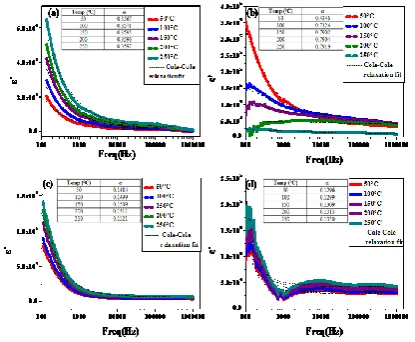
[image:4.595.66.274.134.305.2]The graphs clearly reveal that with increasing frequency (in lower region), both ε’ and ε’’ continuously decreases at all temperature whereas in high frequency region both shows almost linear behavior.
[image:4.595.64.272.348.510.2]Figure 8: Dielectric constant ε’ vs. frequency (a) x = 0.1, (b) x = 0.2, (c) x = 0.3, (d) x = 0.4
Figure 9: Dielectric constant ε’’ vs. frequency (a) x = 0.1, (b) x = 0.2, (c) x = 0.3, (d) x = 0.4
The dipolar relaxation phenomenon [23] has explained this type of behavior. In the region of lower frequency, all type of polarization like dipolar, ionic, electronic etc plays very important role which results in to maximum polarizability. With the frequency raise, both dielectric constant ε’ and ε’’ lags behinds the switching signal of dipolar orientation which consequences in approximately linear variation in region of higher frequency due to filtered out a quantity of polarization from polarizability. Therefore, in higher frequency region net polarization of both ε’ and ε’’ become less. Further it is clear from the graphs that with the increasing Fe substitution in the samples the value of both ε’ and ε’’ regularly increases. The contribution of interfacial polarization may be responsible for this type of increase and not the dipolar polarization. Both ε’ and ε’’ graphs are fitted with Cole-Cole equation [24].Cole-Cole equation is a relaxation model which is used to describe dielectric relaxation. Different spectral shapes are described by exponent which act as a parameter here. When , the Cole-Cole model reduces to Debye model. When , the
relaxation is stretched which means the system now moves towards non-Debye model. As it is cleared from the figure 8 and 9, the values increased continuously, this indicated that the system exhibits Non-Debye relaxation.
ε’ and ε’’ graphs show that the value of is greater than ‘’0’’ for all the samples at all the temperatures which suggests that the relaxations are stretched. Hence the relaxations cover a wide range of frequencies than Debye relaxation indicates that the samples exhibit non- Debye type relaxation [25].
IV. CONCLUSIONS
(La0.70Ca0.30)(FexMn1-x)O3 where x = 0.10 - 0.40 sample show a orthorhombic perovskite structure with Pnma space group. Solid state reaction method was used to prepare the samples. SEM micrographs revealed that increasing Fe concentration incessantly increases the grain size. The same results established by the density measurement. The conductivity values were found to be in increasing order at different frequencies and at different temperature value with increasing substituent concentration. Impedance spectroscopy of all the prepared samples confirmed their non-Debye relaxation behavior.
REFERENCES
1. J.E.O’Brein, C.M.Stoots, J.S.Herring, J.J. Hartvigsen, “J. Fuel Cell Sci.Technol”.;2006; Vol -3; 213–219.
2. A. Hauch, S.H. Jensen, S. Ramousse, M. Mogensen, “J. Electrochem. Soc”.; 2006 Vol- 153; Pp A1741–A1747.
3. R. Rivera-Tinoco, C. Mansilla, C. Bouallou, “Energy Convers. Manag.” 2010 ; Vol- 51, Pp 2623–2634
4. S.C.Singhal, “Solid State Ionics” 135 (2000) 305.
5. N.Q. Minh, Ceramic fuel cells, “J. Am. Ceram. Soc.”1993; Vol.- 76, Pp 563–588 .
6. M. Dokiya,” Solid State Ionics”, 2002; 152–153, 383–392. 7. S.C. Singhal, “Solid State Ionics”, 2002; 152–153, 405–410.
8. N.P. Brandon, S. Skinner, B.C.H. Steele,” Annu. Rev. Mater. Res.” 2003; 33, 183–213 .
9. K.C. Wincewicz, J.S. Cooper, “Journal of Power Sources” 2005, Vol.- 140, Pp 280–296 .
10. C.Sun, R.Hui, J. Roller, “Journal of Solid State Electrochem.” 14 (2010) 1125.
11. H.H. Mobius, “ Journal of Solid State Electrochem.”1997; Vol- 1, Pp 2–16.
12. S. Carter, A. Selcuk, R.J. Chater, J. Kajda, J.A. Kilner, B.C.H. Steele, “Solid State Ion” 1992;.Vol 53–56, Pp 597–605.
13. R.A. De Souza, J.A. Kilner, J.F. Walker, “Material. Letter”2000 . Vol -43, Pp 43–52.
14. V.V. Srdic, R.P. Omorjan, J. Seydel, “Material Science and Engg”2005. Vol- 116, Pp 119–124.
15. H. Ullmann, N. Trofimenko, F. Tietz, D. Strover, A. Ahmad-Khanlou, “Solid State Ion”2000; Vol- 138, Pp 79–90 .
16. Y. Takeda, Y. Sakaki, T. Ichikawa, N. Imanishi, O. Yamamoto; “Solid State Ion” 1994: Vol -72, Pp 257–264 .
17. Z. Jie, L.I. Chen, K. Linglong, W.U. Xuewei, M.A. Yongchang; “journal of Rare Earths”2011 ; Vol -29, Pp 1066–1069.
18. T.Badapanda, S. Sarangi, B. Behra , S.Anwar ; “Current applied Physics” 2014 , 14: 1192-1200.
International Journal of Innovative Technology and Exploring Engineering (IJITEE) ISSN: 2278-3075, Volume-9 Issue-1, November 2019
Advanced ceramics”2014, 3:89-97.
20. B. Tiwari, R.N.P. Choudhary, “ IEEE transactions on dielectric and electrical insulation 2010, 17: 5-17.
21. R. Ranjan , R. Kumar , B.Behra , R.N.P.Choudhary ;2009; Physica B, 404: 3709-3716.
22. M.R. Biswal. J. Nanda , N.C. Mishra ,S. Anwar, A. Mishra “ Advanced Materials Letter” 2014 5: 531-537.
23. M. Kumar, K. L. Yadav, J. Phys.: Condensed Matter (2002) 19:242202.
24. K.S. Cole and H.Robert. ;1941; “ Journal of Chemical Physics” 9:341-351
25. S. Havriliak and S.Negami , 1967. Polymer 8: 161-210.
AUTHORS PROFILE
Surinder Paul, research scholar in the field of material science , Dept. of Applied Physics , I.K.Gujral Punjab Technical University, Kapurthala , Punjab, India
Manokamna, research scholar in the field
material chemistry , Dept. of Applied Chemistry ,I.K.Gujral Punjab Technical University, Kapurthala , Punjab, India
Shubhpreet Kaur, MFM Lab, Physics
department, Guru Nanak Dev University, Amritsar, Punjab, India
Er.P.S.Malhi, Department of Chemistry, Guru
Nanak Dev University, Amritsar , Punjab, India
Dr. Anupinder Singh, Studied at IIT Delhi .Asstt. Prof. ,MFM Lab, Department of Physics, Guru Nanak Dev University, Amritsar, Punjab, India.
Dr. Arvind Sharma,