Abstract: Severe mental disorder is recognized as Depression. State of low mood and aversion to activity causes abnormal behavior of a person in both professional and daily lives. As per WHO, around 350 million people worldwide are victimized by depression. Importance of automated real time mental health analysis is increasing day by day. In this paper, we proposed a system of automated depression diagnosis. This is a new approach to predict the depression severity corresponding to HAM-D score values obtained from prediction models. The proposed framework is designed keeping in mind a multi-modal approach, aiming at capturing facial characteristics, speech properties and brain waves. Further, a decision fusion technique has been implemented to integrate the obtained information in real-time. Using statistical features extracted from the speech recording, facial video and EEG data, the individual prediction models classify the subject according to severity of depression and the outputs are then fused to increase the performance parameters. The training data was obtained from 50 subjects, who provided all three recordings necessary for analysis. In unimodal systems the EEG data provides 80%, Speech 78% and Facial recording 72% accuracy, which is much inferior to a multimodal framework which provides 92% accuracy. The experimental results show that the proposed multimodal framework significantly improves the depression prediction performance, compared to other techniques. Inferior to a multimodal framework which provides 92% accuracy. The experimental results show that the proposed multimodal framework significantly improves the depression prediction performance, compared to other techniques.
Index Terms: Artificial Intelligence, ANN, Depression analysis, machine learning, signal processing.
I. INTRODUCTION
Mood changes are a normal aspect of one's life, as long as these changes are not severe. Intensely frequent or extreme mood changes that interfere with that individual’s daily life functions are harmful. If the mentioned properties persist then it can be a case of major depression disorder. Major depressive disorder is a mental disorder that may last for uncertain period, may vary in severity, and impairs an individual’s ability to function in daily life. WHO has listed depression as the fourth most significant cause of disability worldwide and predicted it to be the major cause by 2020[1]. Moreover the WHO has estimated that 350 million people worldwide are affected by depression [1]. The suicide risk is more than 30 times higher among depressed than in the general population [2]. Treatment of depression disorders is effective in many cases [3], but misdiagnosing depressed patients is a common obstacle [4]. Although clinical
Revised Manuscript Received on July 9, 2019.
Shamla T. Mantri, IT, World Peace University, Pune, India
Dipti D. Patil, IT, Department, MKSSS’s Cummins College of
Engineering for Women, Pune, India.
V.M.Wadhai, Electronics and telecommunication, D.Y.Patil College of
Engineering, Akurdi, Pune, India.
Pankaj Agrawal, EXTC, Nagpur university, Nagpur, India
[image:1.595.317.532.404.550.2]depression is one of the most common mental disorders, it proves to be difficult to diagnose. Currently depression identification is solely obtained by self-report. Moreover the assessment techniques used by psychologists are prone to subjective biases. Evaluations by medical personal vary depending on their expertise and the diagnostic methods used. Interview style assessment, such as the Hamilton Rating Scale for Depression [5] and Suicide Probability Scales [6] are commonly used diagnosis tools. No as such any objective laboratory tests are available for depression detection. Even there is not a single clinical characterization for a suicidal or depressed individual. This makes the diagnosis for both suicide and depression, subjective in nature and time consuming [7-9]. The proposed system can act as a multimodal sensing system that aids clinicians during the diagnosis and monitoring of clinical depression. Such a system may also become a very useful tool for remote depression detection and monitoring. The assessment of patients with depression relies mainly on two domains; the clinical history and the mental state examination. Here we focus on the examination aspect.
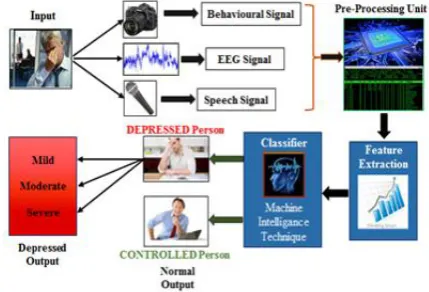
Fig 1 Multimodal system flowchart
The proposed system uses data extracted from three sources: brain waves, speech and facial video recording, as can be seen in Fig 1. The system requires a microphone, a real sense camera and a single electrode EEG headset for collecting data. The collected data is then fed to three different processing modules; one for each modality. The processing modules extract essential properties of the data used for depression analysis in real time. The three processing modules classify the subject individually. Then to get an accurate result the outputs are fused using a decision fusion technique which provides a final diagnosis based on the output of all three modalities.
The processing of EEG data is preceded by accepting the patient's age, sex, marital
status and whether he/she is a smoker. After collection of
Real Time Multimodal Depression Analysis
EEG data the power of Lower Alpha(8-9 Hz) and Higher Alpha(9-13 Hz) frequency bands is extracted. The alpha band power has been studied to be a good indicator for depression thus it is being considered here. The two powers along with the patient's details is fed to an Artificial Neural Network (ANN). The ANN gives the output in terms of Severity of depression. The Speech signal is processed to extract pitch and intensity of the subject's voice. The processing is done using Cepstral Analysis (CA) or Autocorrelation Function (ACF). The video recording is used for first detecting a face by Viola-Jones detector and then a subject independent Dynamic Mesh Model (DMM) is created. 21 Fiducial points called AU’s are extracted which aid in depression diagnosis.
II. REVIEWOFLITERATURE
Behshad Hosseinifard and team, in 2012, described a system of depression diagnosis using machine learning techniques. It was observed that alpha band had highest accuracy to discriminate between normal and depressed groups among their all tested classifiers [10]. In 2010 Vera A. Grin-Yatsenko and team performed an experiment of analysis of independent component of EEG at earlier stages of depression. Alpha power in various regions of brain was found to be a distinct discriminator between control and depressed subjects [11]. Hunter A. M. and team had described that treatment of the illness with antidepressants cause a decline in alpha activity of the brain [12].
Advances in information processing and recognition of speech has created new avenues for extracting speech cues. These speech cues can potentially uncover a person's attitude, mood, emotional state, and personality in natural settings such as social interactions. The rich studies on speech correlates of stress quantifiably draw a relation between these cues and stress. Particularly, fundamental frequency (F0) analysis had aided this, as the F0 should naturally increase with stress [13-14]. Auditory features of patients such as speaking rate, pitch, loudness, and articulation have been observed to change before and after treatment of depressed patients. Thus, this led to many studies those used measurements of speech features [15]. The analysis of glottal features, as produced by the glottis, has produced accuracy of around 87% to 100%. Using a combination of MFCC and formant-based features, classification accuracy approached 80% for this database [16]. Moreover, the acoustic speech properties have been investigated for possible cues in the past to indicate depression in adults. Samples of 139 adolescents are evaluated for speech correlates of depression, from which 68 were diagnosed with clinical depression and 71 acted as controls. Realistic audio recordings of the subjects were made during the interaction between them and their parents. These results supported the theory that vocal prosody is a main measure of change in severity over the mental disorder [17]. Facial expressions carry substantial information about a person’s emotional state. Facial Action Coding System (FACS) is the most popular method adopted by researchers
for describing facial activity [18]. FACS measurement units are Action Units (AUs), not muscles even though being established on musculature. A single AU or more than one AUs can represent one facial muscle. The local shape and texture features were fitted by utilizing an Active Appearance Models (AAMs) to locate the fiduciary facial points. The measurements obtained by AAMs were used for expression recognition with the help of Region Units (RU). [18-19]. Affective state of a person conveys lot of information about Facial expressions which are dynamic in nature [20]. In 2012 Jyoti Joshi presented hypotheses of using a multimodal approach for depression analysis. She proposed to consider facial dynamics, upper body gestures, head movements, speech characteristics and EEG measures as discriminating factors for major depressive disorder [21]. In 2015 Sharifa Alghowinem, et.al. used statistical features from speaking patterns, head pose and eye activity to characterize the behavior associated with depression. They used a Support Vector Machine(SVM) and examined the performance of the classification of individual modalities and when they were fused. They found that fusion resulted in better accuracy for their study [22].
III. APPROACH&METHODOLOGY
This section describes the concepts used to build the multimodal system. The system uses information from the subject’s EEG readings, speech properties and facial features to classify the system. For this various property and their significance in depression detection from eachmodality have been described below.
A. Depression Scaling
Tools used for depression and suicidality diagnoses and continuous assessment still stem from the judgment of specific clinicians. This risks a range of subjective biases. Most well-known diagnostic tools require a questionnaire which supports an interview style assessment. Examples of these are the Depression scale, Hamilton Rating and Suicide Probability Scales. These assessments give the score of symptoms severity and behaviors of person observed in depression or suicidality. These ratings then contribute towards the patient's score [5-6]. This score indicates their depression level or risk of suicide. A diagnosis which uses this style of testing is complicated and heavily dependent on the honesty and desire of a patient to convey their symptoms considering their motivation and outlook can be naturally weakened due to their depression.
Clinical depression can be effectively measured using depression scaling methods. Among all depression scaling, usually two gold standards scaling namely the Beck Depression Inventory (BDI) (patient-rated) and the Hamilton Rating Scale for Depression (HAM-D) (clinician administered) are used for
depression rating scale to identify the depression level in the subject. It has 21 questions related to the depression symptoms observed. A score is given to the patient depicting his depression level. The classification levels of severity of depression using HAM-D score is given below in Table 1.
Table 1: HAMD scoring instructions
HAM-D Score Depression
Interpretation
0 to 7 Normal
8 to 13 Mild
14 to 19 Moderate
20 onwards Severe
B. EEG
The brainwaves of the patient are recorded using a single electrode wearable EEG device, which is designed like a regular pair of headphones [23]. One dry sensor that can be placed on the forehead at position FP1, according to the 10-20 electrode placement system, with 3 dry sensors on the left ear, for reference voltage [24]. It has a microcontroller which pre-processes the EEG signal and transmits the processed data via Bluetooth. Fast Fourier Transform (FFT) is applied on incoming EEG signal through which the band powers are calculated. By applying FFT on EEG signal, EEG frequency bands are separated for the necessary feature extraction. The formula for obtaining FFT from the EEG signal is given in equation 1. The Lower Alpha and Higher Alpha band powers are selected from the frequency spectrum with average band powers of 180 EEG signal frames.
Where N is number of samples, n=k=0, 1…, N-1, x(n) is input signal in discrete form and X(k) is DFT of x(n).
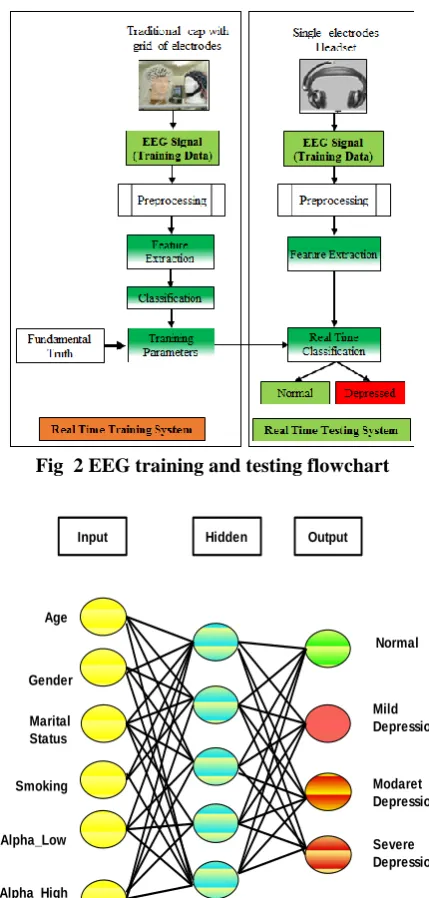
[image:3.595.324.529.50.275.2]The alpha powers along with the patient's details, namely age, gender, marital status and smoking habit are fed to an Artificial Neural Network as input [25]. Fig 3 shows the training and real-time testing flow of the EEG analysis module. The neural network uses backpropagation algorithm for training with a learning rate of 0.01. The error function of the net was calculated by calculating the mean square error of the output with the HAMD score of subject. Thus the network has 6 input nodes, 4 output nodes and is aided by 5 hidden node.
Fig 2 EEG training and testing flowchart
Input Hidden Output
Age
Gender
Marital Status
Smoking
Alpha_Low
Alpha_High
Normal
Mild Depression
Modaret Depression
[image:3.595.55.270.139.260.2]Severe Depression
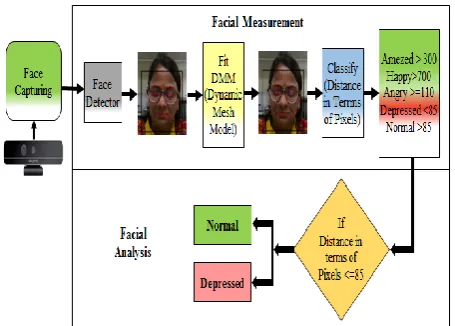
Fig 3 Sample Artificial neural network used for classification based on EEG data C. Speech
Speech samples of subjects are recorded using a consumer grade microphone. Several studies have revealed the relation between prosodic features of speech and the depression condition in patients [26-28]. In this research work, three different speech features, namely pitch, fundamental frequency (f0), intensity and loudness have been computed for the purpose of depression detection.
Subject’s speech data is first captured and then segmented into frames of 20 ms duration. To reduce the Gibbs phenomenon and boundary effect different windowing functions like hamming, hanning, triangular and rectangle functions are applied on each frame. After applying FFT on each frame, magnitude and phase are computed. Intensity is calculated as the minimum
from intensity as given in equation 2
Where I is intensity and =10-12 is threshold hearing intensity3. In this study autocorrelation function (ACF) [26] is used for time domain analysis and Cepstral Analysis (CA) [27] in frequency domain analysis.
Autocorrelation Function (ACF)
To find the similarity between the signal and a shifted version of the same signal autocorrelation routines are used. The main peak in the autocorrelation function is at the zero-lag position. The location of the next peak gives an estimate of the period of the wave, and the height gives an indication of the periodicity of the signal. The mathematical formula for ACF
is given in equation 3. Where as the acf at lag , as the
mean and as the variance.
Cepstrum Analysis (CA)
[image:4.595.313.541.200.363.2]In Cepstrum Analysis the original signal in the time domain is transformed into frequency domain using the Fast Fourier Transform (FFT) and the resulting frequency spectrum is scaled logarithmically. This log-scale frequency spectrum is then transformed to obtain the power cepstrum using the FFT algorithm. The power cepstrum reverts from the frequency domain to the time domain. It and exhibits peaks corresponding to the period of the frequency-spacing in the frequency spectrum. Each block of 512 samples (50 ms) is weighted by a 512-point Hamming window, and then the cepstrum of that block is computed as shown in figure 4 [27].
Fig 4 Flowchart for Speech feature extraction D. Facial Analysis
Facial expressions are captured using videos recorded from a real-sense camera. Real sense camera gives dynamic motion capture with higher-quality depth data, increased middleware quality and decreased power consumption. Face of the subject is detected using Viola-Jones algorithm [18]. Dynamic Mesh Model (DMM) of the face is generated with the help of distances calculated using AU’s and RU’s [19]. AUs specify reduction or expansion of one or more muscles. RUs signify the combination of various AUs. 3D tracking of 78 points of interest with camera on the face of the subject for accurate facial attribute analysis is carried out. For this research some
face landmark regions have been used; namely right and left eyes, right and left eyebrows, mouth ,nose, and jaw. The displacement of the kth AU Dk is achieved using equation 4
Where Sk c
is the k-th AU state in the present appearance, Sk n
is the k-th AU state in a neutral expression, and Nk is the normalization factor for kth AU state. These features have been used to classify the subject as depressed or normal using average pixel distance, as shown in Fig 5
Fig 5 Flowchart for classification based on facial features E. Decision Fusion
Multimodal fusion of different modalities can improve the performance of the classification model. It provides more useful information for classification compared to only using a single modality. Fusion can be performed as pre-matching (early) fusion and post-matching (late) fusion. One of the main objectives of this research is to investigate the best fusion technique for the classification of depression. Three types of fusion techniques were investigated, namely feature fusion, score fusion, and decision fusion. Decision fusion fuses decisions (labels) of individual modalities to obtain a single logical decision. Depression analysis has usually been primarily limited to unimodal information. Here a multimodal analysis has been used as extension for improved classification. The outputs of the three classifiers are used to infer the final class result. Various techniques have been studied for decision fusion namely weighted voting, algebraic combination rules and operators. In this research work AND and OR operators have been used to fuse the decisions from the separate EEG, audio and video processing modalities.
IV. RESULTS
A. Performance comparison of Speech features
[image:5.595.312.540.161.277.2]From the experimentation, it has been concluded that the proposed system is efficient only if fusion of all speech features is done. The signal processing techniques used are namely ACF (time domain) and CA (frequency domain). As shown in Fig 6, using ACF an accuracy of 76% is achieved, whereas an accuracy of 78% is achieved using CA. From this it is concluded that speech signal processing technique using CA with feature fusion technique provides good accuracy as compared to other individual speech features like intensity, loudness and fundamental frequency F0.
Fig 6 Comparative results for performance of speech properties in classification
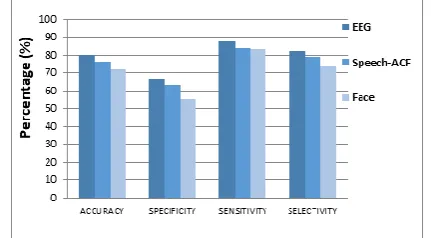
B. Comparative performance analysis of Unimodal system for different parameters-EEG, Speech-ACF and Face
[image:5.595.52.288.211.333.2]In the analysis of the unimodal approach, shown in Fig 7, it has been found that EEG provides significant accuracy, of 80%, when compared to Speech-ACF method or Facial features. From this it can certainly be realized that EEG when taken individually, provides more information about the subject’s state of depression. EEG signal is processed through FFT to extract required frequency bands which correlate to depression. This proves that EEG is far superior at analyzing depression as compared to other selected parameters.
Fig 7 Comparative results for performance of unimodal system using EEG, Speech-ACF and Face C. Performance comparative analysis of Unimodal system for different parameters- EEG, Speech-CA and Face
In the unimodal approach it has been found that EEG provides better accuracy as compared to Speech-CA and Fiducial Features. Satisfactory increase in accuracy of Speech-CA over Speech-ACF has been observed. From this it can certainly be realized that performance parameters of the
proposed system increase in frequency domain than in time domain. This is a major clue which has been recognized in our research work, that frequency domain analysis provides more information about the subject’s state of depression, using speech signal. An increase from 76% to 78% has been recorded with the shift from Speech-ACF to Speech-CA. Moreover EEG provides the greatest accuracy among the three, of 80% using the unimodal approach.
Fig 8 Comparative results for performance of unimodal system using EEG, Speech-CA and Face D. Performance comparison analysis of Multimodal system for different parameters-EEG, Speech-CA and Face
The analysis presents the fact that the accuracy of multimodal approach is significantly better than the previous technique used, namely unimodal Therefore this method possesses good diagnostic capability through real time analysis of EEG data, Speech-CA and Facial features. The accuracy of the system is satisfactory judging by practical medical needs. The proposed system is based on multiple techniques which include signal processing, algorithmic and machine learning techniques. The fusion of all the necessary techniques results in an advanced, intricate analytical system for depression classification. The analysis shown in Fig 9 shows that the system yields an accuracy of 92% which is exceptionally good for any classification system. Thus, it proves fit to be used for practical applications.
Fig 9 Performance of multimodal system using EEG, Speech-CA and Facial features
V. CONCLUSION
A system has been developed that uses that captures essential features form a
[image:5.595.60.276.531.650.2] [image:5.595.311.540.549.672.2]subject based on their depression strength. The system yields an accuracy of 92% which is very good for diagnostic purposes. EEG readings, speech and facial features of the subject are used for the classification. The multimodal nature of the classification ensures maximum accuracy with the provided information to the system. Lower Alpha and Higher Alpha band powers have been extracted from the EEG readings of the subject using FFT algorithm. These frequency bands have been selected as they are the most significant discriminators of the subject’s state of depression. Speech-CA (Cepstral Analysis) proved to yield greater accuracy in depression classification compared to other methods that were studied. Pixel distances from a novel Dynamic Mesh Model have been used to extract facial cues of the subject. This DMM is specially designed for depression analysis. EEG, Speech and Facial features solely provide 80%, 76% and 72% accuracy respectively, which can be increased using fusion of the modalities. Lastly Decision Fusion method has been used to fuse the outputs of each modality to produce the final output, which is the strength of depression of that subject. This fusion finally gives 92% accuracy for this multimodal system.
The system is built not only keeping research based statistical parameters in mind but also considering medical parameters. The individual processing modules only extract essential information from their own modality. The extracted parameters have proven to be good indicators of depression in each domain. Such an objective diagnostic system removes the chance of subjective biases from the diagnostic process. The system is designed to act as a diagnostic aid to psychologists and psychiatrists. It not only detects whether a patient is depressed or not, but also informs about the severity of depression. Hence it is also helpful in regular management and historical analysis of the mental disorder. This particular piece of technology has the ability to reduce the statistics of depression either SI (MKS) or CGS as primary units. (SI units are strongly encouraged.)
REFERENCES
1. C. Mathers, J. Boerma, and D. Fat, The Global Burden of Disease: 2004 Update. Geneva, Switzerland: WHO, 2008.
2. S. B. Guze and E. Robins, “Suicide and Primary Affective Disorders,” The British Journal of Psychiatry, vol. 117, no. 539, Oct. 1970. 3. L. G. Kiloh, G. Andrews, and M. Neilson, “The long-term outcome of
depressive illness.” The British Journal of Psychiatry, vol. 153, no. Dec, 1988.
4. A. J. Mitchell, A. Vaze, and S. Rao, “Clinical diagnosis of depression in primary care: a meta-analysis,” The Lancet, vol. 374, no. 9690, pp. 609–619, 2009.
5. Ronald C. Kessler, “The Epidemiology of major Depressive Disorder”, Vol 289, No. 23,University of California,Pg. No. 3095-3105,Jama 2000
6. K. Hawton, C.Comabella, C. Haw, and K. Saunders, “Risk factors for suicide in individuals with depression: a systematic review, “Journal of affective disorders, Science Direct, Elsevier,Volume 147, Issues 1-3, 2013.
7. A. J. Mitchell, A. Vaze, and S. Rao., “Clinical diagnosis of depression in primary care: a meta-analysis”, The Lancet, 374(9690), pp. 609–619, 2009.
8. P. E. Greenberg, A.-A. Fournier, T. Sisitsky, C. T. Pike, R. C. Kessler, “ The economic burden of adults with major depressive disorder in the united states (2005 and 2010)”, The Journal of clinical psychiatry, vol. no.76(2), pp. 155–162, 2015.
9. K. Kroenke, T. W. Strine, R. L. Spitzer, J. B. Williams, J. T. Berry, and A. H. Mokdad, “The phq-8 as a measure of current depression in the
general population”, Journal of affective disorders, Vol. No. 114(1), pp. 163–173, 2009.
10. Behshad Hosseinifard, Mohammad Hassan Moradi, Reza Rostami, "Classifying depression patients and normal subjects using machine learning techniques and nonlinear features from EEG signal," Elsevier, Computer Methods and Programs in Biomedicine, 2012
11. Vera A. Grin-Yatsinko, Ineke Baas, Valery A. Ponomarev, Juri D. Kropotov, "Independent component approach to the analysis of EEG recordings at early stages of depressive disorders," Elsevier, Clinical Neurophysiology 121, pages 281-289, 2012
12. Hunter AM, Leuchter AF, Morgan ML, Cook IA, "Changes in brain function (quantitative EEG cordance) during placebo lead-in and treatment outcomes in clinical trials for major depression," Am J Psychiatry 2006, 163, pages 1426– 1432
13. Alpert, M., Pouget, E. R., Silva, R. R., “Reflections of depression in acoustic measures of the patient's speech,” Journal of Affective Disorders, vol.66, pp. 59-69, 2001.
14. A. Nilsonne, J. Sundberg, S. Ternstrom, A. Askenfelt, “Measuring the rate of change of voice fundamental frequency in fluent speech during mental depression”, The Journal of the Acoustical Society of America, 83(2):716–728, 1988.
15. N. Cummins, J. Epps, M. Breakspear, and R. Goecke, “An Investigation of Depressed Speech Detection: Features and Normalization,” Interspeech,12th Annual Conference of the International Speech Communication Association, Florence, Italy, page 2997-3000.,ACM , 2011
16. S Kuny, H. H. Stassen, “Speaking behavior and voice sound characteristics in depressive patients during recovery”, Journal of psychiatric research , Vol. 3,Pg. No.289-307, Elsevier,1993 17. Ying Yang, Catherine Fairbairn, Jeffrey F. Cohn, “Detecting
Depression Severity from Vocal Prosody”, IEEE Transactions on Affective Computing Volume 4 Issue 2, Pages 142-150,April 2013 18. P. Ekman., “The Handbook of Cognition and Emotion, chapter Facial
Expressions”, John Wiley and Sons, Ltd, Sussex, U.K, 1999. 19. Gordon McIntyre, Roland Gocke, Matthew Hyett, Melissa Green,
Michael Breakspear, “An Approach for Automatically Measuring Facial Activity in Depressed Subjects”, IEEE Transaction, 978-1-4244-4799-2, 2009.
20. Jyoti Joshi, Abhinav Dhall, Roland Goecke, Michael Breakspear, Gordon Parker, “Neural-net classification for spatio-temporal descriptor based depression analysis”, IEEE Transaction, pp. 2634-2638,2012.
21. Jyoti Joshi, "Depression Analysis: A Multimodal Approach," ICMI’12, Santa Monica, California, USA, October 22–26, 2012
22. Sharifa Alghowinem, Roland Goecke, Michael Wagner, Julien Epps, Matthew Hyett, Gordon Parker and Michael Breakspear, "Multimodal Depression Detection: Fusion Analysis of Paralinguistic, Head Pose and Eye Gaze Behaviors," IEEE Transactions On Affective Computing, Vol. X, No. X, January 2015
23. NeuroSky. (n.d.), “NeuroSky Think Gear Socket Protocol”, NeuroSky Brain Computer Interface Technologies’ 2009.
24. Subha DP, Joseph PK, Acharya R, Lin CM, “EEG signal analysis: A survey”, J Med Syst 34(2):195–212, 2010
25. Lotte, F., Congedo, M., L´ecuyer, a., Lamarche, F., &Arnaldi, B., “A review of classification algorithms for EEG-based brain-computer interfaces”, Journal of neural engineering, 4(2), R1–R13, Bio-Inspired Artificial Intelligence (R. C. Arkin, Ed.). London, England: MIT press, 2008.
26. Lawrence R. Rabiner, “On the Use of Autocorrelation Analysis for Pitch Detection”, IEEE Transactions on Acoustics Speech and Signal Processing 25(1):24 - 33 · March 1977
27. Lu-Shih Alex Low, Namunu C. Maddage, “Detection of Clinical Depression in Adolescents’ Speech During Family Interactions”, IEEE transactions on bio-medical engineering 58(3), Pg. No. 574-86, 2011. 28. Mantri, Shamla, Patil Dipti, Agrawal Pankaj, Wadhai Vijay, "Non- invasive EEG signal processing framework for real time depression analysis," in SAI Intelligent Systems Conference (IntelliSys), London
UK, 2015, pp.518-521, 10-11 Nov. 2015 doi:
AUTHORSPROFILE
Shamla T. Mantri has received B.E. degree in
Electronics Engineering from Marathwada University in 1993 and M.E. degree in Electronics (VLSI and Embedded System) from Pune University, India in 2011. She has completed her PhD in Electronics from Nagpur University in G.H. Raisoni College of Engineering, Nagpur department of Electronics. She is currently working as Assistant Professor in MITWPU, Pune. She has published number of national and international papers. Her Research interests include Signal Processing and Image processing.
Dipti D. Patil is Associate Professor in Information
Technology Department at MKSSS’s Cummins College of Engineering for Women, Pune. She earned her doctorate in the year 2014 from Sant Gadgebaba Amravati University in Computer Science and Engineering. She pursued her UG and PG Computer Engineering from Thadomal Shahani Engineering College, Bandra of Mumbai University in 2002 and 2008 respectively. She has authored books in areas of Data Structures and Mobile healthcare. Dr. Dipti has published many research articles, which are published in various national and international Journals and conferences. She is involved in developing healthcare system prototypes and for which she has filed various national and international patents. Her areas of special interest include mobile healthcare, analytics, data science, artificial intelligence and Internet of Things. Dr. Patil is member, board of Studies, IT of SPPU, Pune, India. She is life member of professional bodies like CSI and ISTE
Pankaj Agrawal is working as Professor in Dept. of Electronics & Comm. Engg., G H Raisoni Academy of Engineering and Technology, Nagpur His qualification is Ph.D. in Electronics from RTM Nagpur University, Nagpur. He is having industrial as well as Teaching Experience. His specialization includes Digital Communication, Digital Signal Processing and Computer Networking. He has published many research papers in International journals, proceedings of International and National conferences. He has chaired the session in International Conference at China and reviewed the paper in International Conferences. He has guided M.Tech. and Ph.D. students.
Vijay M. Wadhai received his B.E. from Nagpur