Chemistry Publications
Chemistry
5-15-1998
High-resolution LEED profile analysis and
diffusion barrier estimation for submonolayer
homoepitaxy of Ag/Ag(100)
L. Bardotti
Iowa State UniversityC. R. Stoldt
Iowa State UniversityCynthia J. Jenks
Iowa State University, [email protected]
M. C. Bartelt
Iowa State UniversityJames W. Evans
Iowa State University, [email protected]
See next page for additional authors
Follow this and additional works at:
http://lib.dr.iastate.edu/chem_pubs
Part of the
Mathematics Commons
, and the
Physical Chemistry Commons
The complete bibliographic information for this item can be found at
http://lib.dr.iastate.edu/
chem_pubs/65
. For information on how to cite this item, please visit
http://lib.dr.iastate.edu/
howtocite.html
.
This Article is brought to you for free and open access by the Chemistry at Iowa State University Digital Repository. It has been accepted for inclusion in Chemistry Publications by an authorized administrator of Iowa State University Digital Repository. For more information, please contact
High-resolution LEED profile analysis and diffusion barrier estimation for
submonolayer homoepitaxy of Ag/Ag(100)
Abstract
We present a high-resolution low-energy electron diffraction study of two-dimensional island distributions
formed by depositing 0.3 ML of Ag on Ag(100). The substrate temperature ranged between 170 and 295 K.
From the ring structure or “splitting” of the diffraction profiles, we determine the behavior of the spatial
correlation length characterizing the island distribution. The precise relationship between this correlation
length and the mean island separation is also determined via an analysis of kinematic diffraction from island
distributions in a realistic model of nucleation and growth. Resulting estimates of this separation are
consistent with those based on results from a previous scanning tunneling microscopy study at 295 K. From
the Arrhenius behavior of the correlation length, we estimate a terrace diffusion barrier for Ag on Ag(100) of
0.40 ±0.04eV, with a vibrational prefactor of about 3×10¹³s-1.
Keywords
Institute of Physical Research and Technology, Ames Laboratory, Mathematics
Disciplines
Mathematics | Physical Chemistry
Comments
This article is from
Physical Review B
57, no. 19 (1998): 12544–12549, doi:
10.1103/PhysRevB.57.12544
.
Authors
L. Bardotti, C. R. Stoldt, Cynthia J. Jenks, M. C. Bartelt, James W. Evans, and Patricia A. Thiel
High-resolution LEED profile analysis and diffusion barrier estimation
for submonolayer homoepitaxy of Ag/Ag
„
100
…
L. Bardotti,*C. R. Stoldt, C. J. Jenks, M. C. Bartelt,†J. W. Evans, and P. A. Thiel
Departments of Chemistry and Mathematics, IPRT, and Ames Laboratory, Iowa State University, Ames, Iowa 50011 ~Received 16 December 1997!
We present a high-resolution low-energy electron diffraction study of two-dimensional island distributions formed by depositing 0.3 ML of Ag on Ag~100!. The substrate temperature ranged between 170 and 295 K. From the ring structure or ‘‘splitting’’ of the diffraction profiles, we determine the behavior of the spatial correlation length characterizing the island distribution. The precise relationship between this correlation length and the mean island separation is also determined via an analysis of kinematic diffraction from island distri-butions in a realistic model of nucleation and growth. Resulting estimates of this separation are consistent with those based on results from a previous scanning tunneling microscopy study at 295 K. From the Arrhenius behavior of the correlation length, we estimate a terrace diffusion barrier for Ag on Ag~100! of 0.40 60.04 eV, with a vibrational prefactor of about 331013s21. @S0163-1829~98!08819-5#
I. INTRODUCTION
High-resolution surface-sensitive diffraction techniques provide a powerful tool for analysis of submonolayer and multilayer thin-film structure.1The utility of these techniques is enhanced if the kinematic or single-scattering approxima-tion can be applied to analyze the shape of the diffuse inten-sity profile~i.e., the variation of diffuse intensity with lateral momentum transfer!. This approximation ensures a simple and direct Fourier transform relationship between the dif-fracted intensity and certain spatial-pair correlation functions describing surface structure.2–4The kinematic approximation is generally assumed valid for analysis of the shape of high-resolution low-energy electron diffraction ~HRLEED! pro-files, but not for the variation of intensity with energy.3Here we present experimental data, together with a theoretical analysis, for HRLEED profiles for homoepitaxy of Ag on Ag~100! in the submonolayer regime, where the overlayer can be best described as a distribution of two-dimensional near-square islands.5
General aspects of the relationship between the shape of the diffraction profile and submonolayer film structure are well recognized. For randomly distributed islands, the dif-fraction profile is simply a weighted sum of intensities from individual islands, and thus is determined by the island shape and size distribution.4For distributions with a depleted popu-lation of nearby island pairs, a well-defined characteristic length Lcemerges that reflects the average island separation Lav. This produces a corresponding ring structure to the
dif-fuse intensity, and thus a ‘‘splitting’’ of the diffraction profile.6Such splitting was first observed and discussed in an experimental study of submonolayer W/W~110! deposition by Hahn, Clabes, and Henzler.7A variety of simple, typically one-dimensional models for the adlayer statistics~e.g., speci-fying island size and separation distributions! have further clarified these ideas.6However, a precise quantitative analy-sis of diffraction profiles must be based upon an accurate description of the nontrivial spatial correlations characteriz-ing the two-dimensional island distribution. Such a descrip-tion is provided by Monte Carlo simuladescrip-tions of realistic mod-els for nucleation and growth of islands during deposition.8
These quantify the depletion of nearby pairs of islands, in-trinsic to the nucleation process,9 as well as the associated profile splitting.8
Scanning tunneling microscopy~STM!provides the pos-sibility of direct access to real-space information about the island distribution. Thus, it is natural to compare such direct observations against predictions from the type of analysis described above of reciprocal-space HRLEED data. How-ever, to date, such careful comparisons are lacking, even for the simple metal~100! homoepitaxial systems of interest here.5,10–15 Thus, we are motivated to provide such a com-parison for the Ag/Ag~100!system, exploiting our previous STM study,5 and focusing on the mean-island separation
Lav.
A traditional goal of analyzing the behavior of the mean-island separation Lav, or density Nav5(Lav)22, in nucleation and growth processes, is the estimation of the barrier for terrace diffusion Ed.9 Clearly, both HRLEED and STM techniques are well suited to this task. Apart from field ion microscopy studies for a specific subset of metal-on-metal systems,16there is actually only a limited set of reliable data on such barriers. Thus, these results are of considerable in-terest both in their own right, and for comparison with the-oretical estimates from various electronic structure calcula-tions. Thus, a key application of our HRLEED analysis is the estimation of Ed for the Ag/Ag~100!system.
In Sec. II, we describe the experimental setup and proce-dure for our HRLEED analysis of the Ag/Ag~100! system. We also comment briefly on the procedure and results of our previous STM study. A summary of the relevant aspects of kinematic diffraction theory is presented in Sec. III, together with some results relating diffraction profile splitting to the mean island separation. The key HRLEED results of this study are described in Sec. IV. Discussion of these results, and detailed comparison with the previous STM results, is presented in Sec. V. A summary is provided in Sec. VI.
II. THE Ag/Ag„100…SYSTEM AND EXPERIMENTAL TECHNIQUES
First, it is appropriate to note that the submonolayer Ag/Ag~100! system has been studied previously by several
PHYSICAL REVIEW B VOLUME 57, NUMBER 19 15 MAY 1998-I
57
diffraction techniques: LEED,13,14He-beam scattering,14and surface x-ray scattering.15 While all these studies reported the expected splitting of the diffraction profiles, none have quantified the behavior of Lavor extracted estimates of Ed. Thus, the full potential of these techniques has not been ex-ploited.
Our experiments were performed in an ultrahigh vacuum
chamber with a base pressure of 6310211 to 2
310210Torr, equipped with both an Omicron HRLEED system, and an Omicron room-temperature STM. Silver was deposited on an Ag~100! crystal from a resistively heated liquid-nitrogen-shrouded source. In the HRLEED studies with the substrate held at room temperature, a high-quality Ag crystal with typical terrace widths of 1000 Å was used. HRLEED studies were also performed for lower substrate temperatures down to 170 K, using a lower-quality crystal with typical terrace widths of 600 Å. In both cases, terrace widths are far larger than the mean island separation, so the influence of steps or of finite terraces should be small. HR-LEED intensities were obtained near an out-of-phase condi-tion for destructive interference between scattering from suc-cessive layers for the Ag/Ag~100!system. At the~0,0!beam corresponding to zero lateral momentum transfer, the out-of-phase condition corresponds to qzb5(2n11)p, for integer n. Here, qz is the vertical momentum transfer, and b is the interlayer spacing. We choose an energy of 110.4 eV, corre-sponding to n53, which is consistent with the known value of b52.05 Å for the fcc Ag crystal. All the profiles shown are taken in the ^110& direction, and were measured within about 2.5–5 min following deposition. The deposition source was calibrated by monitoring the Bragg intensity oscillations near the out-of-phase condition, during deposition of a few monolayers of Ag. The minima~maxima!correspond to half ~full! monolayer coverages. All of the diffraction profiles shown below were taken after deposition of 0.3 ML of Ag, and for similar deposition fluxes in the range of 2 – 4
31023 ML/s.
As noted in the Introduction, we will compare the results from analysis of the HRLEED profiles with those from our previous STM studies at room temperature~and above!.5In the latter studies, STM images of island distributions were obtained on broad terraces ~at least 1000 Å wide!. The first image was obtained typically 15–45 min after deposition. Monitoring the subsequent time evolution of the island dis-tribution allowed estimation of the island densities at the time of deposition via a extrapolation of Nav back to this time. It is instructive to show in Fig. 1~a!a typical image of an island distribution obtained by deposition of 0.26 ML of Ag on Ag~100!.~Note that some restructuring of small over-lapping pairs of islands to form a single near-square island is possible since deposition.!It is just this type of island distri-bution on which the HRLEED studies are performed. Thus, we emphasize again ~cf. Sec. I!that the islands are not dis-tributed randomly in space. Instead, there is a depletion of nearby pairs of islands, as quantified by the island-island separation distribution shown in Fig. 1~b!.
III. KINEMATIC DIFFRACTION THEORY
Within the kinematic approximation, the diffracted inten-sity for a lateral momentum transfer q, and vertical
momen-tum transfer qz, is given by2–4,8
I~q,qz!}~2p!2$122@u1u2#@12cos~qzb!#%d~q!
12@12cos~qzb!#Idiff~q!, ~1!
for q near the~0,0!spot and where again b is the interlayer spacing. The first term in the sum is the Bragg d-function intensity, and the second term is the diffuse intensity. At the in-phase condition, qzb52np, there is no interference be-tween scattering from different layers, so the diffuse inten-sity vanishes, and I}(2p)2d(q) is coverage independent. At the out-of-phase condition, qzb5(2n11)p, interference be-tween different layers is maximum, and thus the diffuse in-tensity is maximized. The term Idiff(q)5Srexp(iq•r)C(r)
corresponds to the diffuse intensity for the overlayer, and is determined by the associated two-point correlation function
C(r).8 ~See the Appendix for an alternative formulation.! Due to depletion, this correlation function exhibits a local minimum or ‘‘weak oscillation,’’ which produces the ring in the diffraction profile upon Fourier transformation.8Also, we should emphasize that the experimentally observed intensi-ties actually correspond to the above expression convoluted with an instrument response function, and also modified by the finite terrace widths.4 Thus, for example, the Bragg in-FIG. 1. ~a!STM image (1103100 nm2) of 0.26 ML Ag depos-ited on Ag~100! at 295 K with F'231023ML/s. Here Nav'3.631023nm22, so Lav'17 nm. ~b! The normalized island-island separation distribution, measuring island-island center-to-center separations L. Despite significant noise in the data due to limited statistics, dramatic depletion is evident for separations L&Lav/2.
[image:4.612.341.532.58.386.2]tensity is correspondingly broadened, as will be clear in the experimental profiles shown in Sec. IV.
The key quantity extracted directly from experiment is the diameter d*of the ring in the diffraction intensity, measured from the profile in the^110&direction. This quantity is typi-cally recast as a real-space correlation length Lc54p/d*. Usually Lc is identified as the mean island separation Lav 5Nav21/2. However, the precise relationship between Lc and Lavis nontrivial~cf. Sec. II!, and is determined immediately
below.
The required analysis of the kinematic diffraction profile is achieved via Monte Carlo simulations of a canonical model for irreversible nucleation and growth of square islands.8 The only model parameters are deposition rate F and ~total! hop rate for isolated adatoms on terraces, h
5zn exp@2Ed/(kBT)#. Here, z54 is the coordination num-ber for the square lattice of adsorption sites on the fcc~100! surface. In this model, dimers and larger islands are treated as immobile, and islands pairs that ‘‘collide’’ due to growth do not restructure, but continue to grow as overlapping squares. The individual constituents of such clusters of partly overlapping islands are counted separately in determining
Nav. For a fixed coverage ofu50.3 ML~corresponding to
the experiments!, we have determined Lav as a function of
h/F, and also evaluated the corresponding Idiff(q), and thus d*and Lc. The variation of Lavand Lcwith h/F is shown in Table I. As expected from classic nucleation theory,8,9 one finds the scaling Lav'1.37(h/F)p ~measured in units of the
surface lattice constant!, for sufficiently large h/F, with the classic exponent of p'16 for irreversible island formation.
The key observation is that if one writes Lc5lLav, thenlis
not unity, as commonly assumed, but rather l'1.6 for this model at 0.3 ML.
It is appropriate to make some other comments about this key factorl. First, recall that most island nucleation occurs for low coverages, after which Nav and Lav are essentially
constant, while islands just grow in size. However, the form of the spatial correlation functions changes significantly with coverage, due to island growth, and thus so shouldl. In fact, l increases significantly with coverage up to at least 0.5 ML.17Second, note that depletion of nearby island pairs be-comes more dramatic with the onset of reversibility in island nucleation.9,18This also affects the correlation functions, and thus l. Finally, we have performed analysis of a modified model incorporating some restructuring of islands upon col-lision to form a single larger square island.19 Limited results suggest that the associated increase in Lav, relative to the
canonical model ~due to a decrease in Nav, since collided
islands are no longer counted separately!, is roughly matched by an increase in Lc. Together, these features roughly pre-serve the value ofl.
IV. HRLEED RESULTS AND DIFFUSION BARRIER ESTIMATION
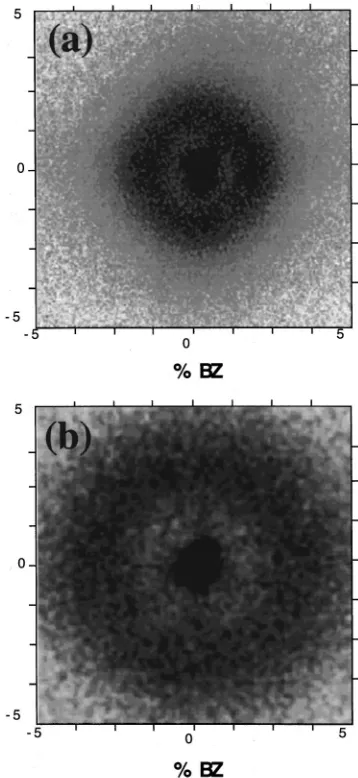
Gray scale images of the diffracted intensity as a function of lateral momentum transfer for deposition of 0.3 ML of Ag on Ag~100! at 295 and 230 K are shown in Fig. 2. The features at 295 K are much narrower than at 230 K, reflecting the larger characteristic lengths. However, in both cases, the intensity displays an inner circular ring, separated from an
outer feature revealing weak fourfold symmetry. Similar
[image:5.612.346.525.58.447.2]be-havior was observed previously for HRLEED intensities ob-tained during Cu/Cu~100! homoepitaxy, and a detailed dis-cussion was provided.12 The inner ring reflects the near circularly symmetric depletion in the island separation distri-bution, its diameter being controlled by the mean island TABLE I. Lavand Lc54p/d* ~in units of the surface lattice
constant!versus h/F at 0.3 ML; also shown is the effective value of the exponent, peff, in the relation Lav;(h/F)peff.
h/F Lav Lc l5Lc/Lav peff
103 5.2 8.0 1.5 0.129
104 7.0 10.7 1.5 0.146
105 9.8 15.3 1.6 0.153
106 13.9 22 1.6 0.160
[image:5.612.52.300.95.183.2]107 20.2 32 1.6 0.165
FIG. 2. Gray scale image of variation of the diffracted intensity with lateral momentum transfer, measured as a fraction of the Brillouin-zone ~BZ! width, near the ~0,0! beam. The intensities were measured following deposition of 0.3 ML of Ag on Ag~100! for ~a! T5295 K and F52.431023ML/s; ~b! T5230 K and F 52.031023ML/s.
separation Lav. The outer feature reflects the shape and size
distribution of individual islands, its location being con-trolled by the smaller mean linear island size Rav5u1/2Lav 50.55Lavat 0.3 ML. This outer feature is described well by a ‘‘random-phase approximation’’ that neglects interference between scattering from different islands. Its weak fourfold symmetry reflects the near-square shape of individual is-lands, together with an averaging over the distribution of island sizes. See the Appendix.
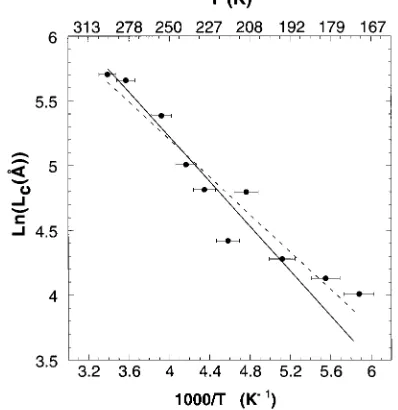
Figure 3 summarizes the dependence of the splitting of the diffraction profiles, for 0.3 ML of Ag on Ag~100!, on deposition temperature between 170 and 295 K. Fluxes were in the range F'2 – 431023 ML/s. These profiles show the
systematic decrease in the ring diameter with increasing tem-perature. A corresponding Arrhenius plot of Lc54p/d* is given in Fig. 4. From our previous STM study, it is known that island formation is irreversible at and below room tem-perature, and that the mobility of dimers and other small clusters is not significant.5Then, from nucleation theory,8,9it
follows that both Lc and Lav should scale like
exp@2pEd/(kBT)#, where p'
1
6 ~cf Table I!. Using Arrhenius
data from the full range 170–295 K, one obtains
Lc'3.263103 exp@2Ed/~6kBT!# Å
with Ed'0.3760.06 eV. Instead, using only data from 195– 295 K, one obtains
Lc'5.783103 exp@2Ed/~6kBT!# Å
with Ed'0.4560.06 eV. The latter choice is prompted by the possibility that classic scaling begins to break down at the lower end of the observed temperature range, as dis-cussed further in Sec. V.
V. DISCUSSION AND COMPARISON WITH STM OBSERVATIONS
Our previous STM study of island density behavior in the Ag/Ag~100! system indicated that Nav'(2.360.2) 31024F0.3160.02Å22, for deposition at 295 K.5This value
of the exponent of 0.31 demonstrates that island formation is irreversible, and that mobility of dimers and other small clus-ters is not significant during island nucleation. Then, by com-parison with results from our model for irreversible nucle-ation and growth of square islands, we estimate that h'1.6
3107 s21 at 295 K. If one chooses the estimate Ed
50.37 eV from Sec. IV using data for the full T range, then one has a prefactor of n'1013s21. Simulations with these parameters produce the scaling
Lav'1.863103 exp@2E
d/~6kBT!# Å
for F53.731023 ML/s, so l5Lc/Lav'1.8. Instead,
choosing Ed50.45 eV, using only higher-T data ~cf. Sec. IV!, yields n'1.631014 s21, which seems somewhat too high. Simulations with these parameters produce the scaling
Lav'2.983103 exp@2Ed/~6kBT!# Å,
for F53.731023 ML/s, sol5Lc/Lav'1.9. These values
of l appear consistent with the theoretical estimate of l '1.6 in Sec. III, particularly given the uncertainties in de-termination of d*from the experimental data.
Next, we discuss sources of deviation from classic scaling for lower temperatures, and associated refined estimates of
[image:6.612.58.293.53.290.2]Ed. First, it is well known that such deviations occur in canonical models of irreversible nucleation and growth for sufficiently low h/F. See Ref. 8 and Table I. For Ed
FIG. 3. Temperature dependence of the splitting of the diffrac-tion profiles for 0.3 ML of Ag on Ag~100!. Profiles are shown for 295 K ~with F52.431023ML/s), 280 K ~with F52 31023ML/s), 240, 210, 195, and 170 K ~with F53.7 31023ML/s!. Shown is the logarithm of normalized intensities, where normalization is relative to their maximum values.
FIG. 4. Arrhenius behavior of the correlation length Lc 54p/d*. Data are shown for temperatures and fluxes of~295 K, 2.431023ML/s!, ~280 K, 231023ML/s!, ~255 K, 4 31023ML/s!,~240 K, 3.731023ML/s!,~230 K, 231023ML/s!, ~218 K, 2.531023ML/s!, ~210 K, 3.731023ML/s!, ~195 K, 3.7 31023ML/s!, ~180 K, 3.731023ML/s!, and ~170 K, 3.7 31023ML/s!. The dashed line is the linear fit to all data producing Ed'0.37 eV, and the solid line neglects the 180- and 170-K data producing Ed'0.45 eV.
[image:6.612.336.535.63.268.2]50.37 eV andn'1013s21, one still has a large h/F'105 at 170 K~for F53.731023 s21!, and simulations predict only a 10% reduction in the scaling exponent and Arrhenius slope from classic values at 170 K. For Ed50.45 eV and n
'1014s21, one has h/F'103 at 170 K, producing a 30%
reduction. Note that at 170 K, for the former choice, one has
Lav'10 lattice constants, and an average island size of sav 5u/Nav'536 atoms, whereas for the latter one has Lav
'6 lattice constants, and sav'334 atoms~at 0.3 ML!.
The possibility of more extreme ‘‘anomalous’’ behavior at lower T was suggested by previous He-atom scattering11 and HRLEED~Ref. 20!studies of Cu/Cu~100!homoepitaxy. Here, an unexpected plateau in Lc at a high value of ;10 lattice constants was observed below 100 K. The plateau was first attributed to significant ‘‘transient mobility’’ of isolated deposited atoms.20 Instead, we believe that it is due to sig-nificant restructuring or ‘‘clumping’’ of adatoms following deposition. This is possible at such low T only since most atoms are deposited near other adatoms and islands, allowing rearrangement via edge diffusion type processes that have low activation barriers.21From Fig. 4, it seems plausible that such a plateau is beginning to emerge in the experimental data for Ag/Ag~100! by 180 K, where island structures are already small ~see above!. This interpretation is consistent with recent HRLEED experiments by Swan22for 0.4 ML of Ag deposited on Ag~100! for a lower temperature range of 110–230 K.
In conclusion, we expect that there is some refinement to classic scaling, primarily due to ‘‘clumping,’’ for our lower
T range. Accounting for this effect, and the need for a
rea-sonable prefactor, we propose a best estimate of Ed50.40
60.04 eV~andn'331013s21!.
VI. SUMMARY
We have presented results from an HRLEED analysis of island distributions formed by depositing 0.3 ML of Ag on Ag~100!for temperatures between 170 and 295 K. The real-space correlation length Lc, obtained from the splitting of the diffraction profiles, is successfully compared with the average island separation Lav, based on our previous STM
study. However, this requires recognition of a nontrivial re-lationship Lc'lLav, withl'1.6– 1.8 determined by the
de-tailed form of the spatial correlations in the island distribu-tion. Analysis of the temperature dependence of Lc, together with an estimate of the room-temperature mobility from our STM study, leads to an estimate of Ed50.4060.04 eV for the activation barrier for terrace diffusion of Ag on Ag~100!, and n'331013 s21 for the prefactor. This should be com-pared with another experimental estimate of 0.4 eV using low-energy ion scattering, which assessed only the onset of diffusion,23and recent estimates from sophisticated ab initio electronic structure calculations of 0.52 eV~local-density
ap-proximation! and 0.45 eV ~generalized gradient
approximation!,24 and 0.50 eV~full-potential linear muffin-tin orbital!.25
ACKNOWLEDGMENTS
This work was supported by NSF Grant No. CHE-9700592. It was performed at Ames Laboratory, which is
operated for the U.S. Department of Energy by Iowa State University, under Contract No. 7405-Eng-82.
APPENDIX: ISLAND REPRESENTATION FOR THE DIFFUSE INTENSITY
The exact expression in Sec. III for Idiffis often recast in
an ‘‘island representation’’ as a sum Idiff5I01Iint.2–4 The
‘‘random-phase approximation’’ I0 neglects interference be-tween scattering form different islands, and Iintaccounts for
this interference. Specifically, one has8
I0~q!5
(
s
NsuAs~q!u2, I int~q!
'
U
(
s
NsAs~q!
U
2(
rexp~iq•r!@Cisl~r!21#.
~A1!
Here Ns is the density, andAs(q) is the average scattering amplitude for islands of size s, and Cisl(r) is the
island-island correlation function, as in Fig. 1~b!. While the expres-sion for Iint neglects significant correlations between island
size and separation,26 this formulation provides at least a semiquantitative description of the diffuse intensity. I0 is ob-tained by taking the diffracted intensity for a single square island, with edges aligned in the ^110& direction@Fig. 5~a!#, and averaging over the appropriate size distribution.8,26The result is a monomodal intensity distribution shown in Fig. 5~b!, with width reflecting the mean island size. The details are quite sensitive to the form of the size distribution, and are remarkably similar to the experimental plot in Ref. 12. Iint
has a negative value at q50, with a magnitude measuring
the ‘‘total amount of depletion’’ (r@12Cisl(r)#, of nearby
island pairs. When combined with I0, this produces the cen-tral ring feature to Idiff.
FIG. 5. Gray scale image and contour plot of variation of the logarithm of the diffracted intensity I0vs lateral momentum transfer near the ~0,0! beam for~a! square islands with a single size;~b! square islands with a realistic distribution of sizes, as determined in Ref. 8. Axes are labeled in units of the momentum transfer multi-plied by the average side length of the square islands.
*Present address: De´partement de Physique des Materiaux, Univer-site´ Claude Bernard, Lyon I, 69622 Villeurbanne, France. †Present address: Computational Materials Science Department,
Sandia National Laboratories, Livermore, CA 94550.
1D. P. Woodruff and T. A. Delchar, Modern Techniques in Surface
Science, 2nd ed. ~Cambridge University Press, Cambridge, 1994!.
2M. A. Van Hove, W. H. Weinberg, and C.-M. Chan, Low Energy
Electron Diffraction~Springer, Berlin, 1986!.
3M. Henzler, Appl. Phys. 9, 11~1976!; Surf. Sci. 73, 240~1978!;
Appl. Surf. Sci. 11, 450~1982!; Surf. Sci. 132, 82~1983!; Appl. Phys. A: Solids Surf. 34, 205~1984!; Surf. Sci. 168, 744~1986!. 4M. G. Lagally, G.-C. Wang, and T.-M. Lu, in The Chemistry and
Physics of Solid Surfaces, edited by R. Vanselow~CRC, Boca Raton, FL, 1979!.
5C.-M. Zhang, M. C. Bartelt, J.-M. Wen, C. J. Jenks, J. W. Evans,
and P. A. Thiel, J. Cryst. Growth 174, 851~1997!; Surf. Sci.~to be published!; L. Bardotti, M. C. Bartelt, C. J. Jenks, C. R. Stoldt, J.-M. Wen, C.-M. Zhang, P. A. Thiel, and J. W. Evans, Langmuir 14, 1487~1998!.
6J. M. Pimbley and T.-M. Lu, J. Vac. Sci. Technol. A 2, 457 ~1984!.
7P. Hahn, J. Clabes, and M. Henzler, J. Appl. Phys. 51, 2079 ~1980!.
8M. C. Bartelt and J. W. Evans, Surf. Sci. 298, 421~1993!; in
Common Themes and Mechanisms of Epitaxial Growth, edited by F. Fuoss et al., MRS Symposia Proceedings No. 312~ Mate-rials Research Society, Pittsburgh, 1993!, p. 255; Surf. Sci. 284, L437~1993!. We write C(r)5P(r)2u2, where P(r) gives the probability that a pair of sites separated by r are both occupied. P(r) decreases from a value of roughlyufor small r~sites are likely either both within or outside an island!, tou2for large r ~sites are independently occupied!, through a local minimum for r somewhat larger than the typical island ‘‘radius’’ ~one site is likely within an island, and the other is in the depletion zone surrounding the island!.
9
J. A. Venables, Philos. Mag. 27, 697~1973!.
10J. A. Stroscio, D. T. Pierce, and R. A. Dragoset, Phys. Rev. Lett.
70, 3615~1993!; J. A. Stroscio and D. T. Pierce, Phys. Rev. B
49, 8522~1994!; E. Kopatzki, S. Gu¨nther, W. Nichtl-Pecher, and R. J. Behm, Surf. Sci. 284, 154~1993!; D. K. Flynn-Sanders, J. W. Evans, and P. A. Thiel, ibid. 289, 75 ~1993!; 298, 378 ~1993!.
11H.-J. Ernst, F. Fabre, and H. Lapujoulade, Phys. Rev. B 46, 1929 ~1992!.
12H. Du¨rr, J. F. Wendelken, and J.-K. Zuo, Surf. Sci. 328, L527 ~1995!; J.-K. Zuo, J. F. Wendelken, H. Du¨rr, and C.-L. Liu, Phys. Rev. Lett. 72, 3064~1994!.
13W. F. Egelhoff and I. Jacob, Phys. Rev. Lett. 62, 921~1989!; Ch.
Ammer, Solid State Phenom. 12, 73~1990!; Ch. Teichert, Ph.D. thesis, Martin-Luther-Universita¨t Halle-Wittenberg, 1992. 14P. Bedrossian, B. Poelsema, G. Rosenfeld, L. C. Jorritsma, N. N.
Lipkin, and G. Comsa, Surf. Sci. 334, 1~1995!.
15H. A. van der Vegt, W. J. Huisman, P. B. Howes, and E. Vlieg,
Surf. Sci. 330, 101~1995!.
16G. L. Kellogg, Surf. Sci. Rep. 21, 1~1994!. 17
J. W. Evans and M. C. Bartelt, in Morphological Organization in Epitaxial Growth and Removal, edited by Z. Zhang and M. G. Lagally~World Scientific, Singapore, 1998!.
18J. W. Evans and M. C. Bartelt, J. Vac. Sci. Technol. A 12, 1800 ~1994!.
19J. W. Evans and M. C. Bartelt, in Surface Diffusion: Atomistic
and Collective Processes, edited by M. C. Tringides ~Plenum, New York, 1997!.
20G. L. Nyberg, M. T. Kief, and W. F. Egelhoff, Phys. Rev. B 48,
14 509~1993!.
21‘‘Transient mobility’’ is not observed in molecular dynamic
simulations. See, e.g., J. W. Evans, D. E. Sanders, P. A. Thiel, and A. E. DePristo, Phys. Rev. B 41, 5410~1990!. ‘‘Clumping’’ is discussed in more detail by M. C. Bartelt and J. W. Evans, Surf. Sci.~to be published!and by M. Breeman~unpublished!. 22A. K. Swan~private communication!.
23M. H. Langelaar, M. Breeman, and D. O. Boerma, Surf. Sci.
352-354, 597~1996!.
24B. D. Yu and M. Scheffler, Phys. Rev. Lett. 77, 1095~1996!. 25
G. Boisvert, L. J. Lewis, M. J. Puska, and R. M. Nieminen, Phys. Rev. B 52, 9078~1995!.
26M. C. Bartelt and J. W. Evans, Phys. Rev. B 54, R17 359~1996!.